Conflux (CFX) Hits 7-Month High as On-Chain Metrics Signal Further Upside

Layer-1 (L1) coin CFX has emerged as the top-performing altcoin today, hitting its highest price level since December 9, 2024. 

The rally follows a series of recent ecosystem updates that have significantly boosted trading activity and investor sentiment around CFX. With demand continuing to strengthen, the coin appears well-positioned for further upside in the short term.

CFX Price Doubles in a Week as Asia-Focused Roadmap Unfolds

CFX currently trades at $0.23, climbing 83% over the past day. Over the past week, the coin’s price has increased by over 110%.

CFX’s price surge is largely driven by anticipation of its Tree Graph 3.0 mainnet upgrade, set to launch in August. The upgrade promises a major performance boost, enabling up to 15,000 transactions per second. It also introduces support for AI agents, real-world asset settlements, and cross-border payments, aimed at strengthening Web3 infrastructure in Asia.

Further, Conflux is developing an offshore RMB stablecoin in collaboration with AnchorX, Dongxin, and Ping An. The stablecoin is expected to gain traction through upcoming pilot programs in Central and Southeast Asia, expanding Conflux’s regional relevance.

Adding to its momentum, Conflux recently partnered with MetYa, an AI-centric SocialFi platform. These updates have culminated in a surge of demand for CFX, significantly driving up its value over the past few days.

CFX Rallies on Smart Money Accumulation

According to Santiment, CFX’s social dominance—a metric that tracks the percentage of crypto-related discussions focused on the asset—has soared to an all-time high. Per the on-chain data provider, this stood at 0.74% at press time, confirming the notable surge in online chatter about CFX.

For token TA and market updates: Want more token insights like this? Sign up for Editor Harsh Notariya’s Daily Crypto Newsletter here.

CFX Social Dominance.
CFX Social Dominance. Source: Santiment

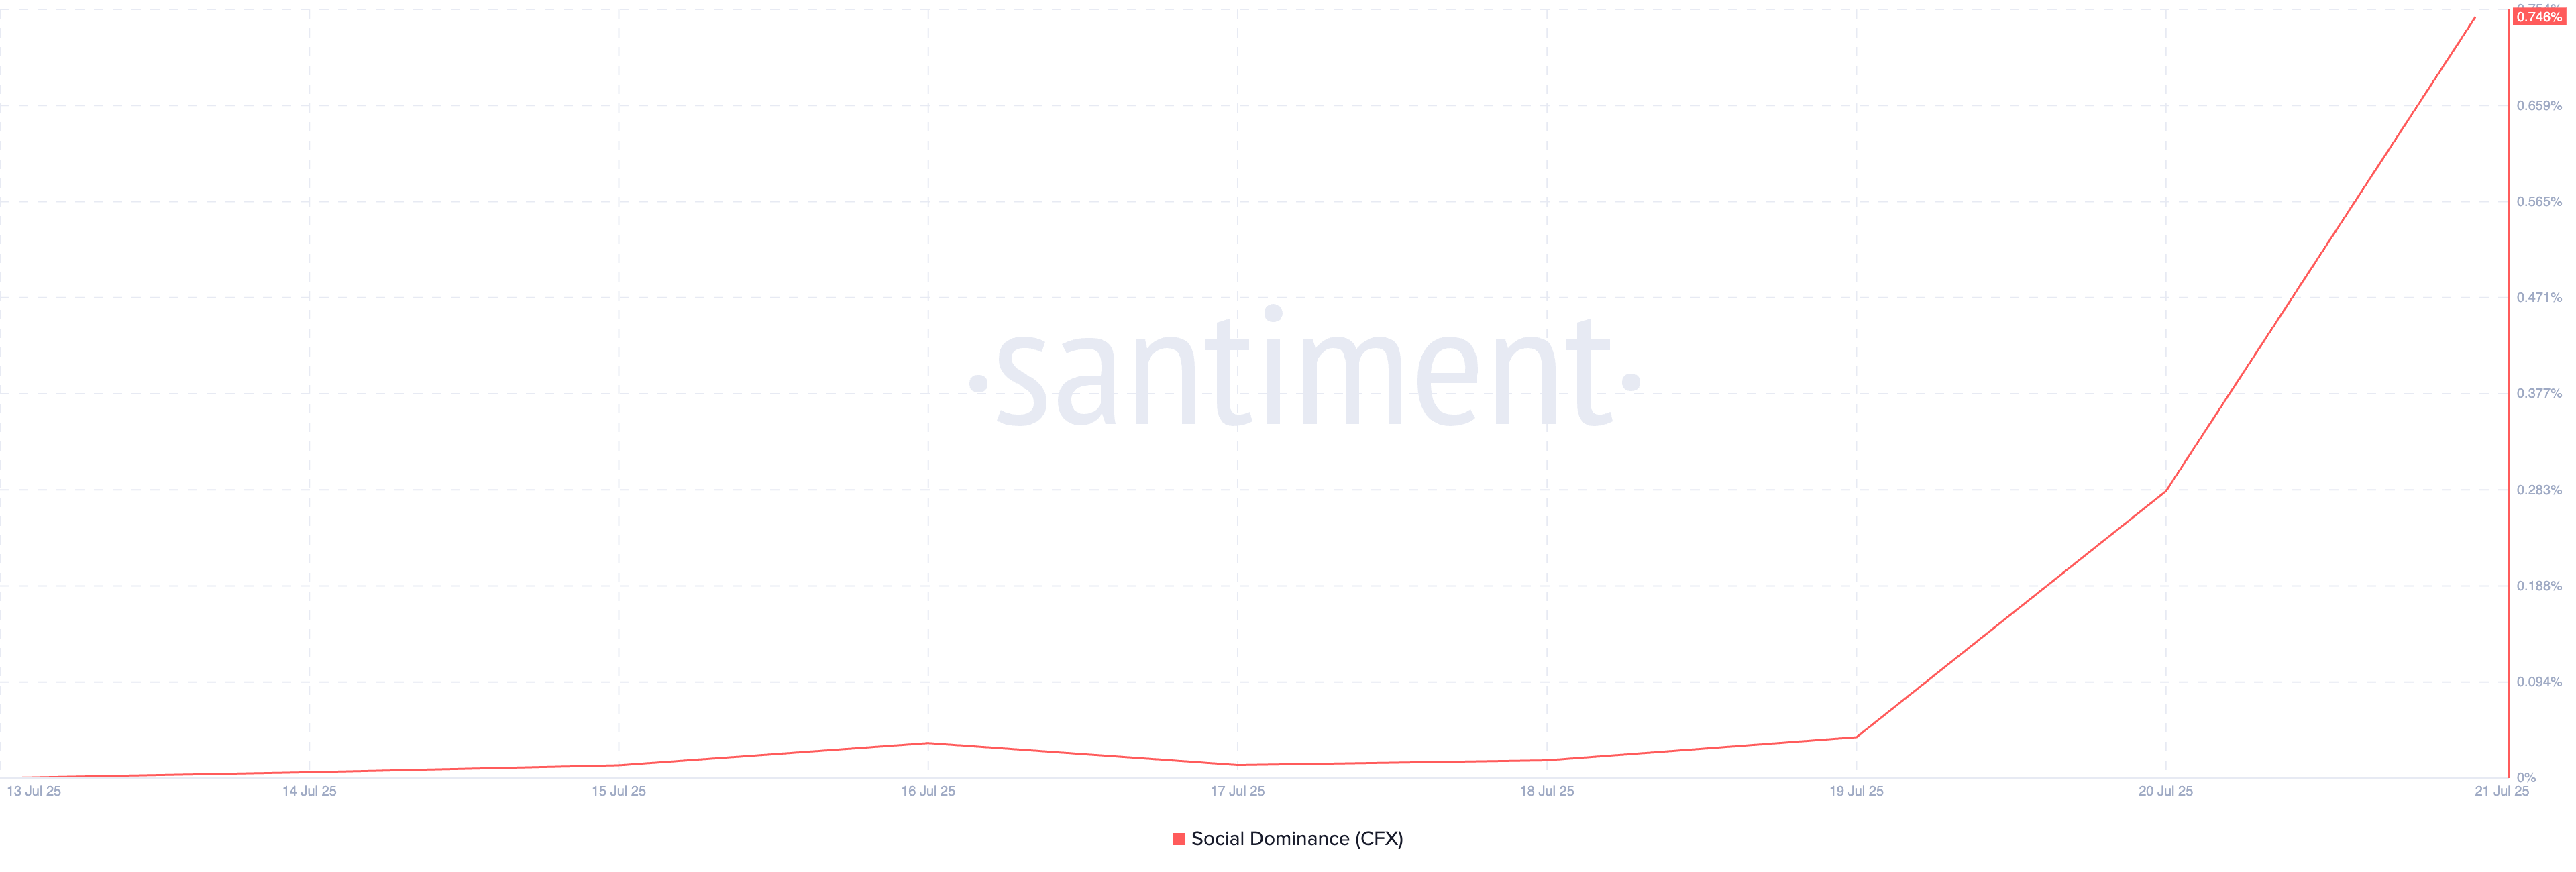
This confirms that the altcoin has captured significant attention in the broader market conversation, a trend that is often a precursor to increased retail activity and short-term price momentum.

Moreover, over the past three days, CFX’s Smart Money Index (SMI) has climbed, indicating rising interest from influential investors and large holders. Readings from this indicator show that its value has risen by 46% since July 19.

CFX SMI
CFX SMI. Source: TradingView

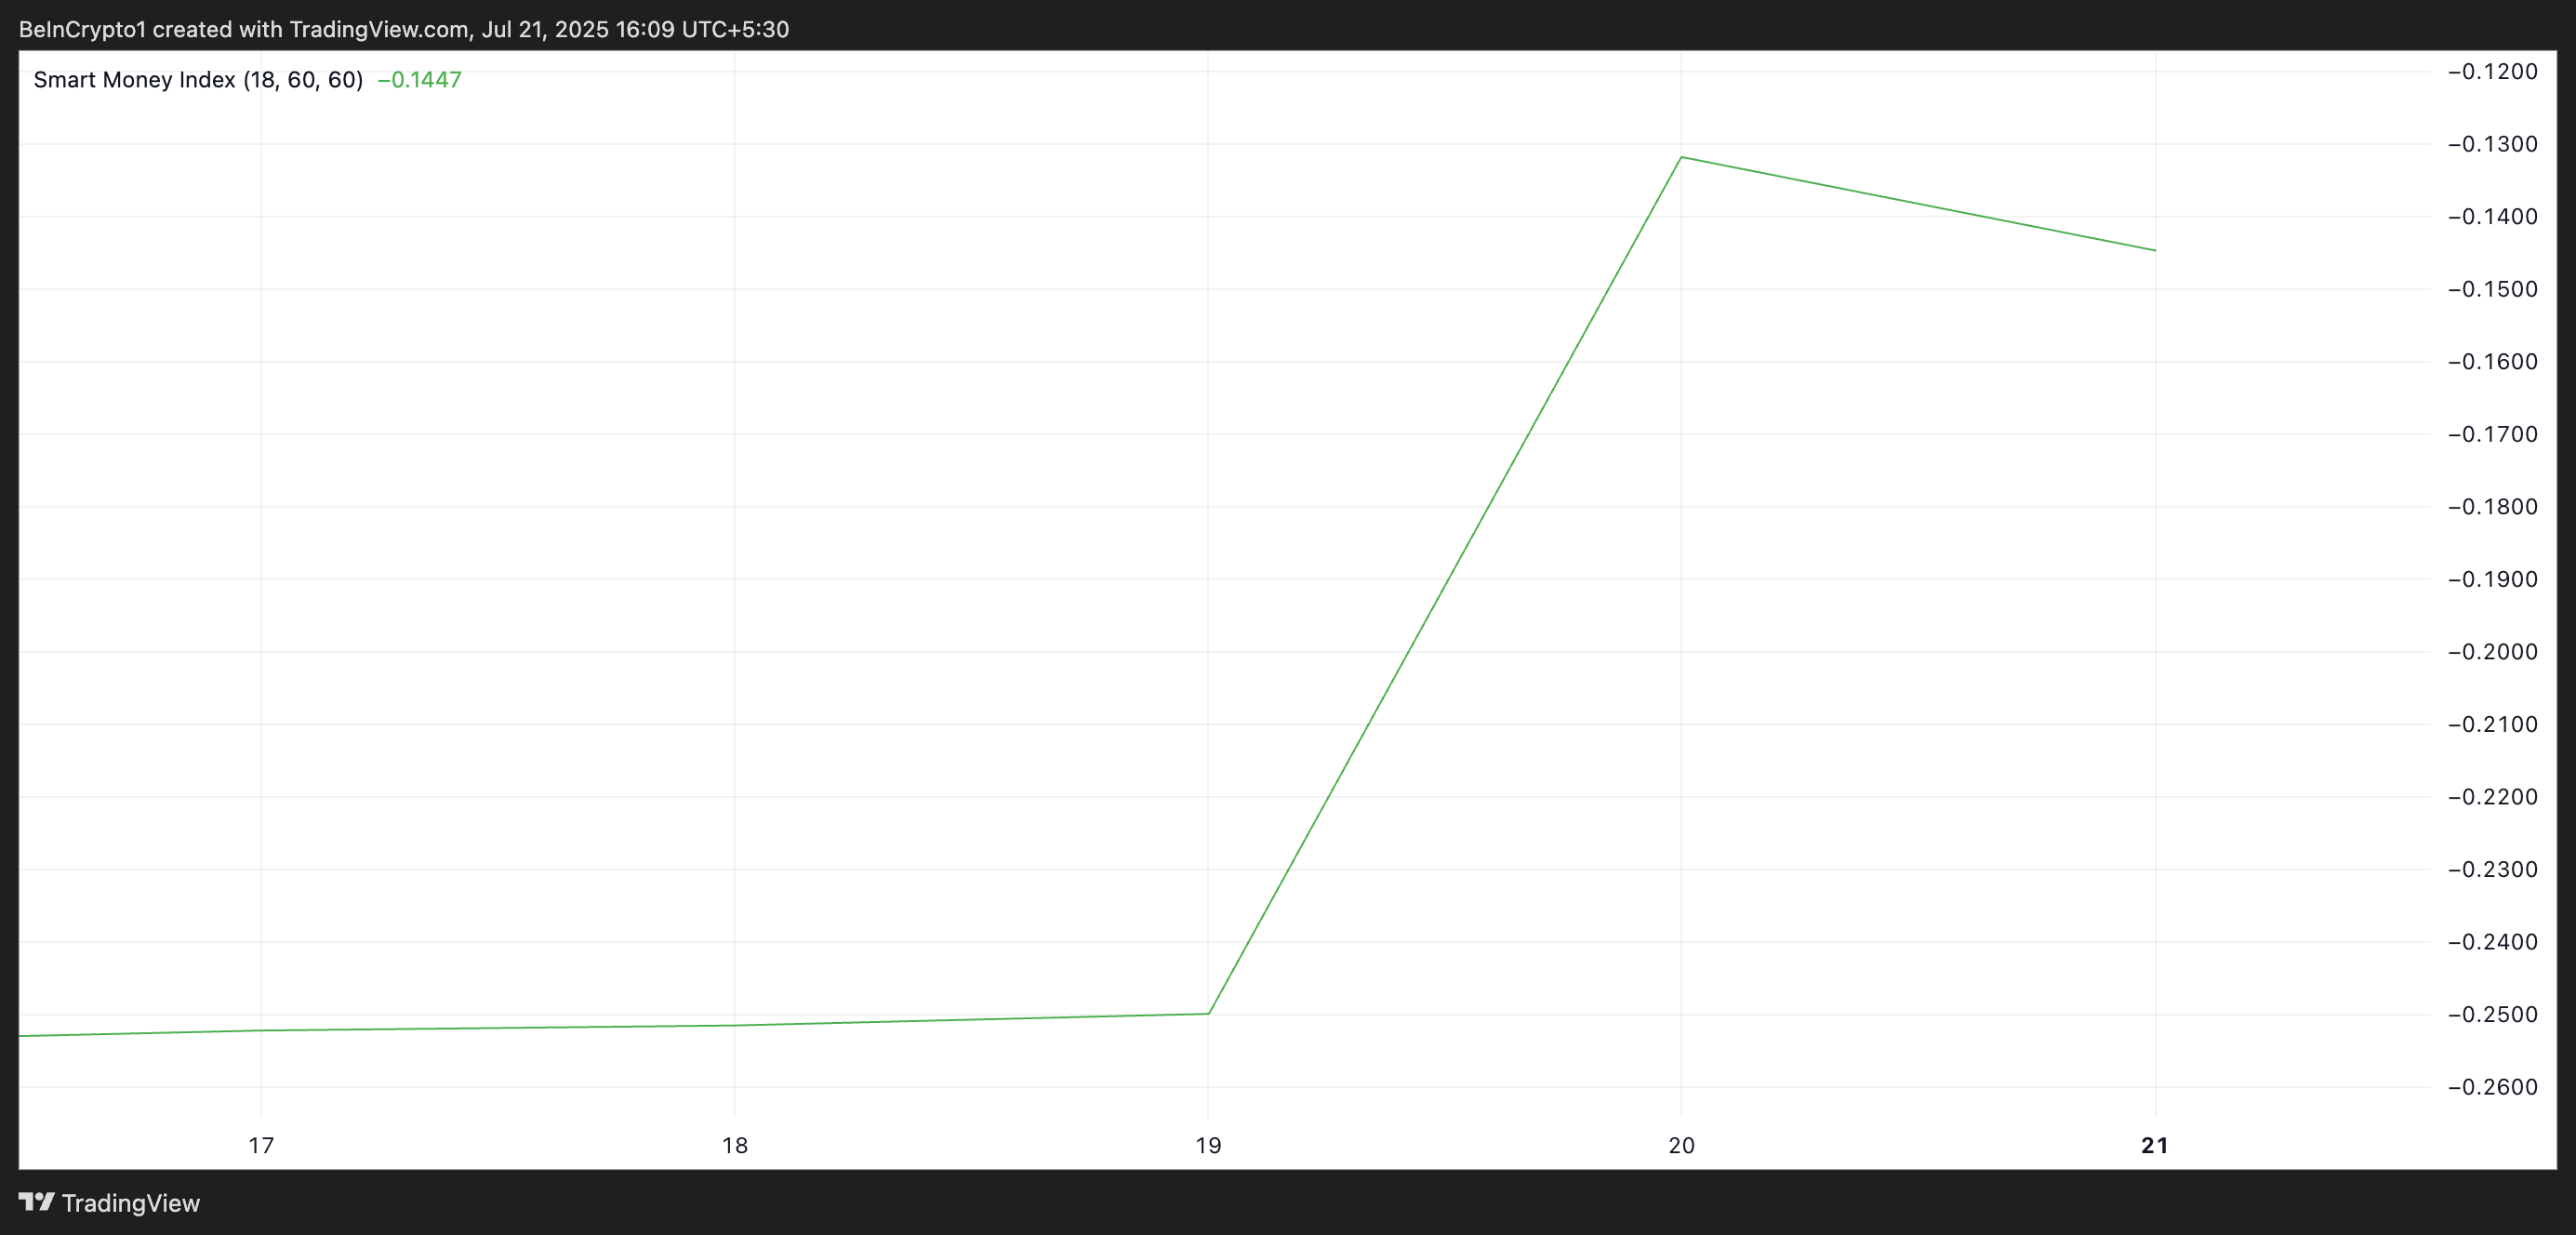
Smart money refers to capital controlled by institutional investors or experienced traders who understand market trends and timing more deeply. The SMI tracks the behavior of these investors by analyzing intraday price movements.

It measures selling in the morning (when retail traders dominate) versus buying in the afternoon (when institutions are more active). 

A rising SMI like this signals that smart money is accumulating CFX, often ahead of major price moves — a trend primarily driven by the upcoming launch of the Tree-Graph 3.0 mainnet upgrade, which is set for the next few days.

CFX Eyes Breakout Above $0.25 — Can Bulls Push Toward April 2024 Highs?

Sustained buying pressure could see CFX break above its immediate resistance at $0.2484. A successful breach of this level could drive its price toward $0.306, a high last reached in April 2024.

CFX Price Analysis
CFX Price Analysis. Source: TradingView

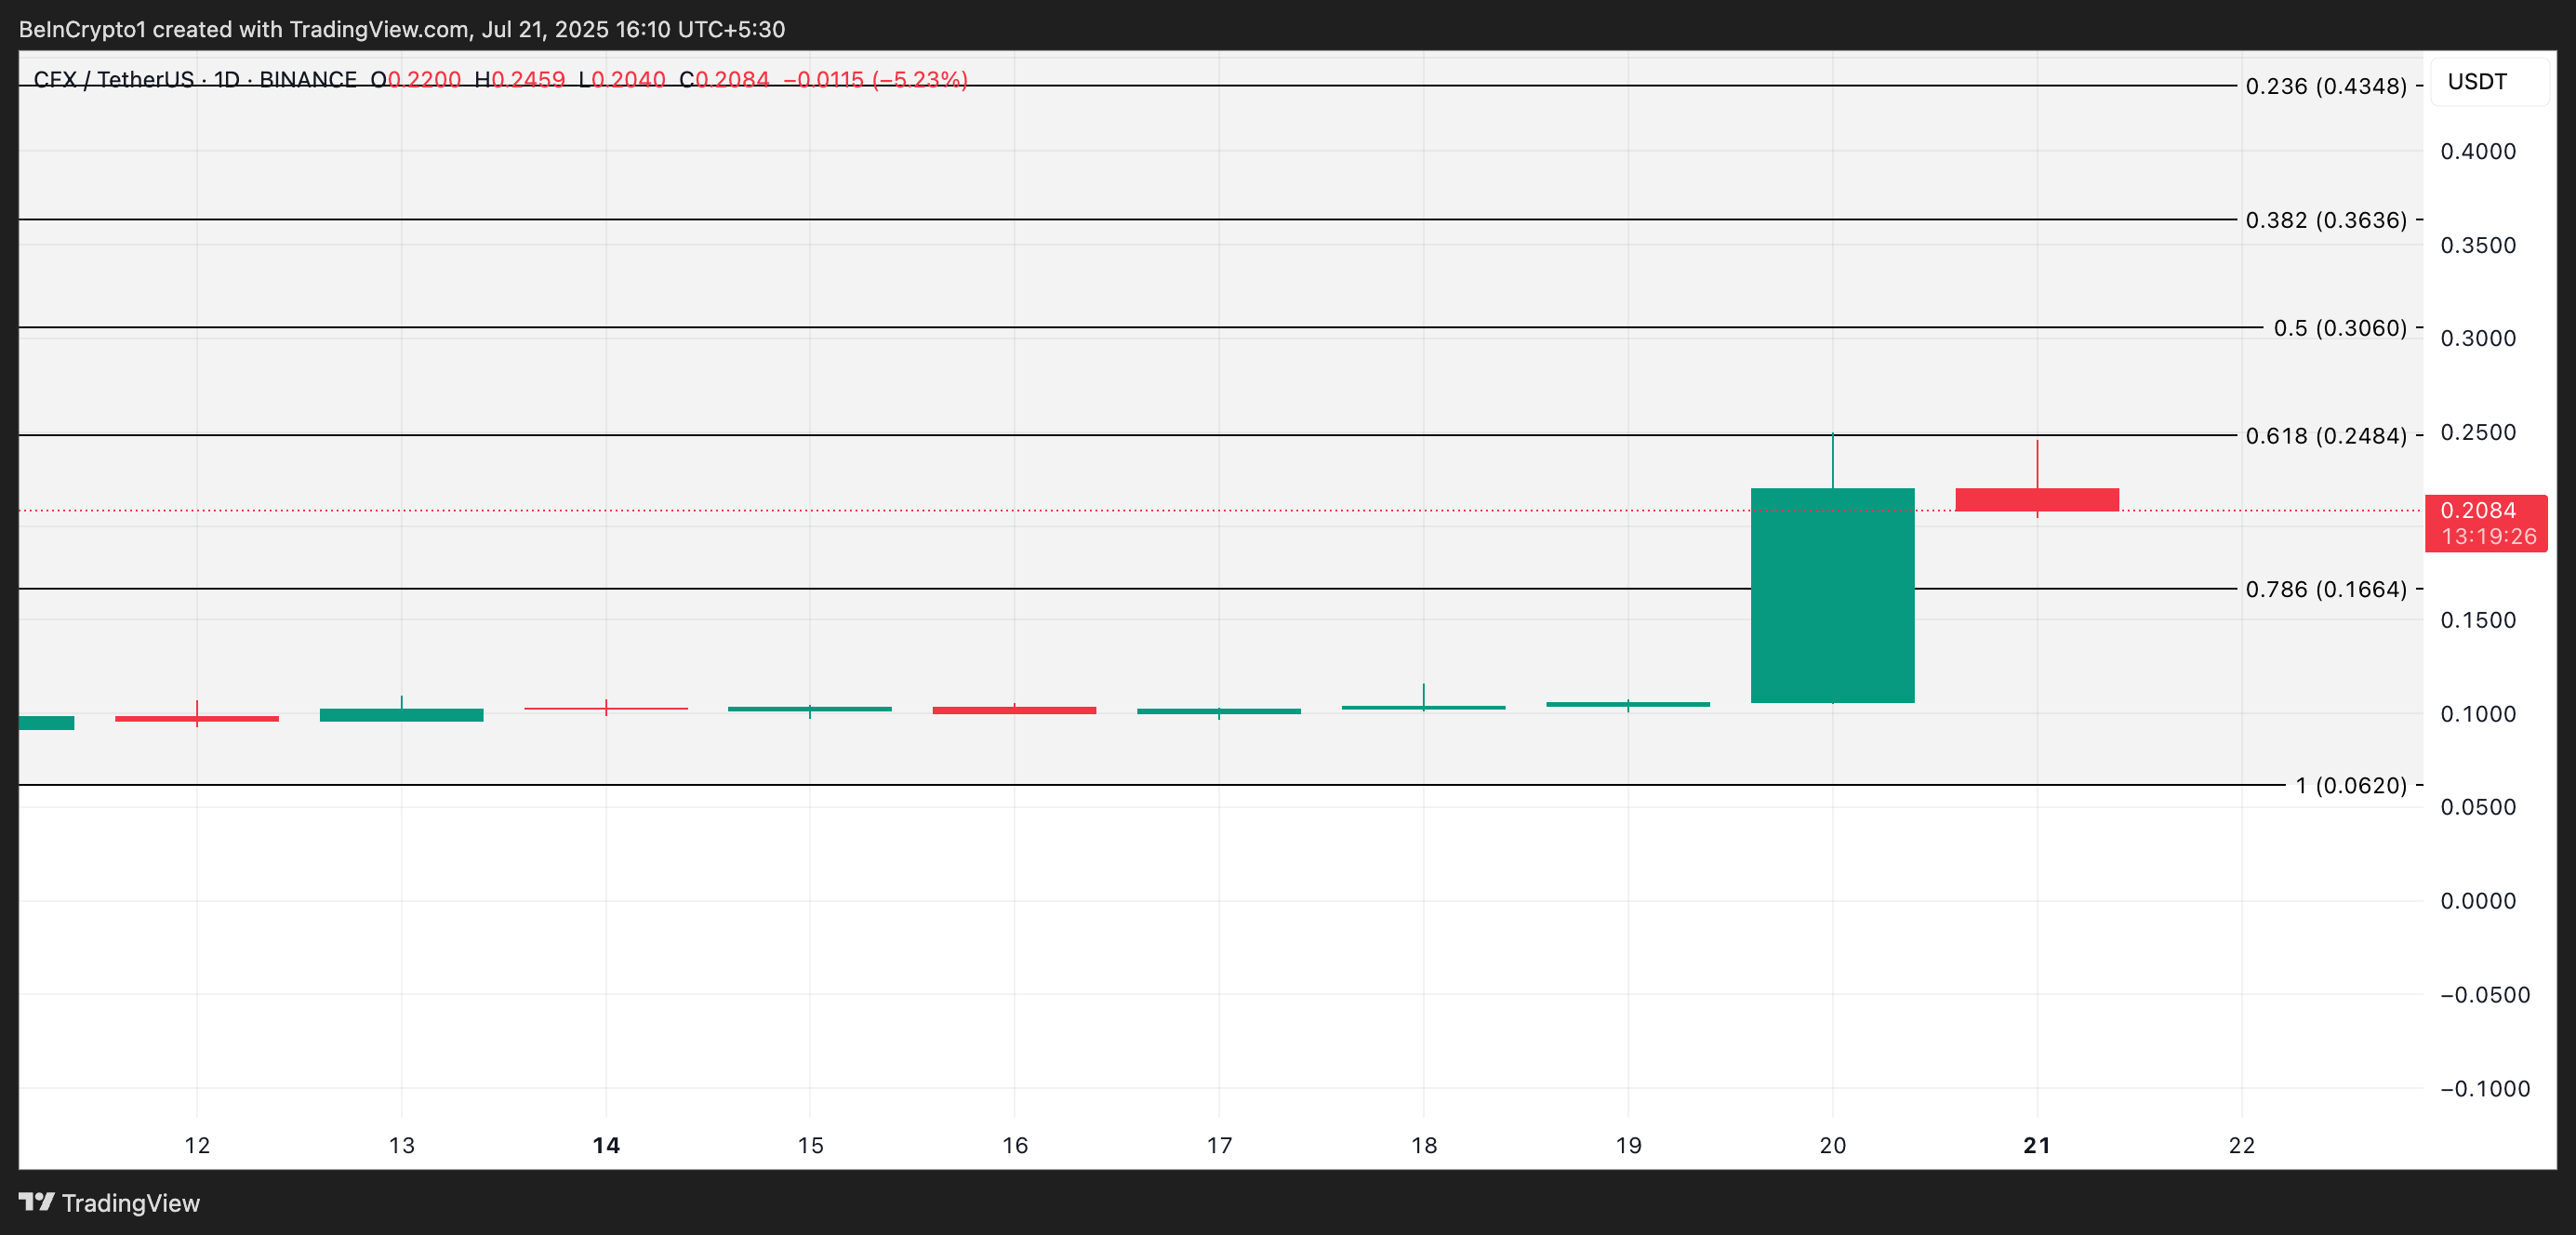
However, if market participants resume profit-taking, this bullish projection will be invalidated. In that case, the coin’s price could fall to $0.1664.

The post Conflux (CFX) Hits 7-Month High as On-Chain Metrics Signal Further Upside appeared first on BeInCrypto.

Hedera Mainnet Upgrade Is Coming – Will It Affect HBAR Price?

Hedera will upgrade its mainnet to version 0.63 on July 23, 2025, at 17:00 UTC. The scheduled maintenance will last about 40 minutes and may temporarily slow transaction processing across the network.

The update focuses on improving system operations and network performance. However, it does not introduce any changes to HBAR tokenomics or smart contract execution.

What is the Hedera Mainnet Upgrade?

The new version includes three primary changes:

  • Support for non-zero shard and realm IDs in system commands.
  • Fee configuration throttling, which adds rate-limiting to administrative changes.
  • MerkleDB tuning, which improves node storage efficiency and reduces processing overhead.

These changes aim to increase resilience and operational flexibility for developers and node operators. Hedera CLI tools like yahcli will now function across custom network partitions.

In simple terms, it will expand Hedera’s potential for enterprise deployments. The upgrade will boost the network’s throughput and reduce ledger syncing time.

Will the Upgrade Affect HBAR Utility?

There are no direct changes to HBAR’s utility. Core token functions—transfers, staking, smart contract gas—will remain unaffected. Transaction fees and staking mechanisms also remain unchanged.

Users may experience temporary delays or halted transaction processing during the upgrade window. 

However, normal operations will resume once maintenance ends.

HBAR has surged over 100% this month, rising from ~$0.15 to around $0.28–$0.29 as of July 21.

Analysts pointed to a bullish technical setup, with a golden cross forming and strong exchange inflows backing the move. While short-term RSI suggests HBAR may be overbought, the broader sentiment remains bullish. 

BeInCrypto’s latest analysis indicates the next resistance between $0.37 and $0.50 if momentum holds.

hbar RSI chart
HBAR RSI Chart. Source: TradingView

Could the Hedera Upgrade Impact Price?

The v0.63 upgrade is a technical maintenance release, not a feature launch or tokenomics update. It is unlikely to drive price action directly.

However, Hedera’s stability and reliability improvements may help reinforce investor confidence, especially after July’s volatile spike. 

If the upgrade proceeds without issue, it may help sustain the current price range by reducing technical risk.

Still, any significant move in HBAR will likely depend more on macro sentiment and upcoming ecosystem news rather than this upgrade alone.

hdera tvl
Hedera TVL in 2025. Source: DeFiLlama

HBAR has already seen major gains this month. The upgrade may support the bullish trend—but it isn’t the catalyst for further price action. 

Traders should watch network stability during the rollout, while keeping an eye on broader market cues for the next move.

The post Hedera Mainnet Upgrade Is Coming – Will It Affect HBAR Price? appeared first on BeInCrypto.

3 CoinGecko Top Gainers to Watch for the Fourth Week of July

The past week has seen a notable surge in crypto trading activity, fueled by improving market sentiment and investor confidence. This uptick is reflected in the 3% increase in the global crypto market capitalization over the last seven days.

As attention returns to altcoins, several lesser-known tokens have emerged as standout performers. According to Coingecko’s data, here are three top gainers to keep an eye on for the third week of July:

Epic Chain (EPIC)

EPIC has surged by 155% over the past week and is currently trading at $2.50. On the daily chart, the altcoin’s Elder-Ray Index has consistently printed prominent histogram bars over the last four days, indicating strong accumulation by market participants.

The indicator stands at 2.28 at press time, reflecting sustained bullish momentum.

The Elder-Ray Index measures the strength of bulls and bears in the market by analyzing the difference between an asset’s price and its exponential moving average (EMA). A positive Elder-Ray reading occurs when the bulls are dominant, meaning the price is trading above the EMA, indicating strong buying momentum. 

This suggests that EPIC buyers are in control and may continue to push prices higher in the short term. In this scenario, the altcoin could rally above $2.63. 

EPIC Price Analysis.
EPIC Price Analysis. Source: TradingView

However, if demand plunges, EPIC could reverse current gains and fall to $2.21.

Mango Network (MGO)

Layer-1 (L1) coin MGO is another top gainer to watch this week. Trading at $0.0272 at press time, the altcoin is up by 128% over the past week.

MGO’s triple-digit rally today has pushed its price above the 20-day exponential moving average (EMA). This key moving average now forms dynamic support below the token’s price at $0.017. 

The 20-day EMA measures an asset’s average price over the past 20 trading days, giving weight to recent prices. When price trades above the 20-day EMA, it signals short-term bullish momentum and suggests buyers are in control.

MGO could extend its rally to trade at $0.029 if this continues.

MGO Price Analysis
MGO Price Analysis. Source: TradingView

However, if profit-taking resumes, the coin’s price could fall below $0.026.

ZORA

ZORA is one of the top crypto gainers to watch this week. At press time, the token trades at $0.0211, up by almost 90% in the past seven days.

Over the past 24 hours, ZORA has noted 40% gains. During the review period, the token’s trading volume surged by 293%, reaching $161.17 million. The increase in the token’s price and trading volume indicates strong bullish momentum and heightened investor interest. 

This trend suggests that market participation is backing the price rally. If it continues, ZORA’s price could breach $0.0215 and climb toward $0.0253.

ZRO Price Analysis.
ZRO Price Analysis. Source: TradingView

On the other hand, if demand declines, the altcoin’s value could fall to $0.0186

The post 3 CoinGecko Top Gainers to Watch for the Fourth Week of July appeared first on BeInCrypto.

XRP Eyes New All-Time High as Whale Selling Intent Drops 94%

XRP price surged to a new all-time high of $3.66 before cooling off near $3.50, holding onto 21% weekly gains.

While some feared a pullback, fresh data from whale wallets and investor behavior tells a different story, one that suggests this might just be a pause before a much bigger move.

Whale-to-Exchange Flow Nosedives 94%

One of the clearest signals comes from whale behavior. Back on July 11, large holders’ wallets moving big amounts shifted over 43,575 XRP to exchanges, likely prepping to sell. But by July 21, that number collapsed to just 2,339 XRP. That’s a 94% drop in whale-to-exchange flow.

For token TA and market updates: Want more token insights like this? Sign up for Editor Harsh Notariya’s Daily Crypto Newsletter here.

XRP price and whale-to-exchange flow
XRP price and whale-to-exchange flow: CryptoQuant

When whales send less to exchanges, they’re not rushing to sell. It’s like the big players are sitting tight, waiting for the next move rather than exiting. This cool-down in whale selling pressure usually removes a big source of downward price pressure, giving XRP some breathing room at current levels.


HODL Waves Show New Holders Holding Strong

Interestingly, while whales slowed their exits, short-term holders seem to be stepping up. The HODL Wave data from July 10 to July 20 shows an uptick in wallets that have held XRP between one week and six months.

XRP price and short-term HODL waves
XRP price and short-term HODL waves: Glassnode
  • 3 to 6-month band grew from 10.4% to 12.08%
  • 1 to 3-month holders rose from 4.8% to 6.3%
  • 1 week to 1 month climbed from 4.1% to 5.4%

That’s a clear sign that new buyers aren’t flipping XRP quickly; they’re holding onto their bags. Even when whales were offloading earlier, prices didn’t crash. These newer holders may have absorbed the selling, keeping the momentum steady.

HODL Waves show how long coins sit in wallets. If the bands for newer holders grow, it means fresh buyers are staying put and even entering. That’s often a sign of confidence.


XRP Price Action: All Eyes on the Psychological Resistance

From a price chart angle, XRP price is still hovering near its key resistance at $3.59. This level acted as a ceiling during the previous attempt to break out, and traders are watching it like hawks.

XRP price analysis
XRP price analysis: TradingView

If XRP can decisively break above $3.59, the next major target sits near $4.64. This level isn’t just random; it aligns with the 2.618 Fibonacci extension level from the last completed swing, which started in early-April and retraced towards June-end. We aren’t using the current high in this calculation since that move is still in progress.

Do note that even if XRP price manages to breach $3.59, it might still face some psychological resistance near $3.6597 or $3.66 (the current all-time high).

However, if the XRP price fails to hold above $2.95, another key Fib level now turned support, it may invalidate the bullish scenario in the short term. Yet, as long as the price remains above $3.13 ( another key support level), the bullish outlook persists.

The post XRP Eyes New All-Time High as Whale Selling Intent Drops 94% appeared first on BeInCrypto.

Bitcoin Price Stuck Under $120,000 As Profit Taking Hits 7-Month High

Bitcoin’s price rise has stalled just under $120,000, moving sideways as the broader crypto market pivots to altcoins. This stagnation follows a recent rally that lifted BTC close to its all-time high. 

However, saturated demand and increasing sell pressure are reducing Bitcoin’s momentum, raising concerns of a potential reversal.

Bitcoin Investors Beginning Profit Taking

Realized profits for Bitcoin have surged to a 7-month high, signaling growing selling activity among investors. The spike indicates that holders are securing gains rather than betting on further upside. This behavior often emerges when investors lose confidence in continued bullish momentum, which appears to be happening now.

As profit-taking intensifies, investor sentiment has started shifting away from Bitcoin. This could limit the upside potential in the near term. When large numbers of investors exit at once, it typically places downward pressure on the price, reinforcing the likelihood of consolidation or a correction.

For token TA and market updates: Want more token insights like this? Sign up for Editor Harsh Notariya’s Daily Crypto Newsletter here.

Bitcoin Realized Profits
Bitcoin Realized Profits. Source: Glassnode

Velocity, another key indicator, is also spiking and currently sits at a 4-month high. This metric tracks the rate at which Bitcoin changes hands within the network. Higher velocity usually accompanies increased trading activity, reflecting investor attempts to capitalize on short-term movements.

This uptick in velocity shows that Bitcoin demand is still present, but it’s driven by quick trades rather than long-term accumulation. The conflicting signals of profit-taking and rising demand are keeping Bitcoin from making a sharp move in either direction. This tug-of-war is contributing to the ongoing price stagnation.

Bitcoin Velocity
Bitcoin Velocity. Source: Glassnode

BTC Price Could Escape Consolidation, But For The Worse

At the time of writing, Bitcoin is priced at $119,366. The crypto giant is struggling to break past the $120,000 resistance level. Its fading dominance suggests capital is shifting to altcoins, decreasing the likelihood of a breakout above this barrier in the immediate future.

Bitcoin’s current indicators support a sideways price movement. If the market holds steady, BTC may continue to consolidate between $117,000 and $120,000. This range is likely to remain intact unless significant buying momentum returns.

Bitcoin Price Analysis.
Bitcoin Price Analysis. Source: TradingView

On the downside, if selling pressure surpasses demand, Bitcoin could fall below $115,000. A stronger correction could push the price toward $110,000, invalidating the current bullish narrative and reinforcing concerns about near-term weakness.

The post Bitcoin Price Stuck Under $120,000 As Profit Taking Hits 7-Month High appeared first on BeInCrypto.

3 Warning Signs Bitcoin May Be Headed for a Cooldown This July

Bitcoin (BTC) has entered its fourth consecutive month of gains. However, it just ended the first red weekly candle of July.

While many analysts believe the bullrun may not be over yet, some concerning signals have begun to emerge, hinting at a possible price correction or consolidation.

After Four Months of Gains, Is Bitcoin Due for a Breather?

These warning signs don’t necessarily mean Bitcoin will reverse, but they serve as early indicators that demand attention before stronger moves or major volatility occur.

1. Bitcoin Whale-to-Exchange Flow Spikes

First, Bitcoin Whale-to-Exchange Flow data shows a significant increase in July. This metric reflects the volume of BTC large holders (whales) send to exchanges, usually implying an intention to sell.

Bitcoin Whale to Exchange Flow - Source: CryptoQuant
Bitcoin Whale to Exchange Flow – Source: CryptoQuant

According to analyst Darkfost, in the last two market peaks, whale capital inflows exceeded $75 billion, marking the beginning of a correction or consolidation phase. Between July 14 and July 18, 2025, the figure has already reached $45 billion. This sharp rise indicates increased activity from large investors.

“[This whale activity] should be closely monitored, since whales can exert significant selling pressure, just as they did during the last two tops,” Darkfost said.

Darkfost’s view aligns with recent on-chain observations from Lookonchain. Today, Lookonchain reported that a savvy Bitcoin whale sent 400 BTC (worth $47.1 million) to Binance to take profits, with total realized gains reaching $91.5 million.

2. Bitcoin Coin Days Destroyed (CDD) Hits Yearly High

Beyond whale flows, on-chain data shows another signal: Bitcoin’s Coin Days Destroyed (CDD) in July reached a one-year high.

CDD measures how long coins were held before being moved. It reflects the sentiment and behavior of long-term holders. A high CDD value suggests long-term holders are moving their coins and are likely to sell them.

Bitcoin Coin Days Destroyed (CDD) - Source: CryptoQuant
Bitcoin Coin Days Destroyed (CDD) – Source: CryptoQuant

According to CryptoQuant, the 30-day average CDD in July surpassed 31 million, the highest since April 2024. A previous report from BeInCrypto noted that a spike in this metric often precedes major market corrections. However, on the positive side, it can also be seen as a redistribution to new investors.

3. Altcoin-Bitcoin Correlation Turns Negative

Finally, changes in the correlation between altcoins and Bitcoin have raised further concern.

According to Alphractal, the Altcoin-Bitcoin Correlation Heatmap recently dropped below zero. This shift means that altcoins have outperformed Bitcoin in recent days.

However, historical data shows that a low correlation between Bitcoin and altcoins is often a red flag.

Altcoin-Bitcoin Correlation Heatmap. Source: Alphractal

Since the start of 2025, this indicator has turned negative thrice. The first was in January, followed by a drop in Bitcoin’s price from $110,000 to $74,900. The second time was in May, when BTC fell from $112,000 to $98,500. Now, we are seeing the third occurrence.

“Historically, low correlation is a red flag. It often precedes periods of high volatility and mass liquidations — whether from shorts or longs,” Alphractal warned.

A recent report from BeInCrypto also highlighted another concerning signal. The Coinbase Premium has decoupled from the Kimchi Premium. This disconnection suggests an uneven bullrun across global regions, primarily driven by strong institutional demand in the US.

The post 3 Warning Signs Bitcoin May Be Headed for a Cooldown This July appeared first on BeInCrypto.

HBAR Whale Holdings Jump 5% in a Week; Is a Price Breakout Ahead?

Hedera (HBAR) is showing no signs of slowing down. The token is up over 92% month-on-month, signaling strong bullish momentum. But the story doesn’t end there.

Whale wallets are piling in, funding rates are holding steady, and the price structure shows room for a potential breakout continuation. With multiple legs of support behind this move, HBAR price could be gearing up for more.

Whale Wallet Surge Signals Confidence

Whale wallets have continued their accumulation spree. Over the past week, the number of wallets holding 1 million HBAR or more rose from 67.28% to 71.41%. Also, wallets with 10 million+ HBAR jumped from 86.29% to 91.62%. That’s a more than 5% rise in a matter of days.

For token TA and market updates: Want more token insights like this? Sign up for Editor Harsh Notariya’s Daily Crypto Newsletter here.

HBAR whale holdings
HBAR whale holdings: Hedera Watch

Such a concentrated increase in whale holdings typically reflects growing confidence in near-term price action. It also suggests that larger players are positioning themselves before a potential continuation rally.

Whale wallet data tracks the percentage of supply held by large wallets, helping measure accumulation pressure.

Funding Rate Spikes Show Aggressive Longs

The open interest-weighted funding rate for HBAR reached 0.057% on July 18, its highest level in months. As of July 21, it sits at a still-elevated 0.01%, suggesting that long positions are maintaining their dominance.

HBAR price and funding rate
HBAR price and funding rate: Coinglass

This spike in funding rates mirrors HBAR’s recent price rally and implies that leverage is building in favor of bulls. Typically, a rising funding rate indicates aggressive long positioning. It can foreshadow continued upward momentum, especially when backed by whale accumulation.

The good thing here is that the Funding rates (despite being positive) aren’t overheated, suggesting that leveraged positions do not dominate the derivatives market. This pattern keeps the risk of a long squeeze out for now.

A long squeeze occurs when over-leveraged long positions are forced to exit as prices dip, triggering a cascade of liquidations that accelerates the price drop.

Funding rates reflect the cost of holding leveraged long vs. short positions. A positive rate means longs are paying shorts, suggesting bullish sentiment.

HBAR Price Action Hints at a Breakout Zone

From a technical perspective, HBAR is currently hovering around the 0.382 Fibonacci extension level at $0.27, after cleanly breaking above the 0.236 resistance or the $0.25 price level. This region has acted as a consolidation zone over the past few sessions, with price finding consistent support.

HBAR price analysis:
HBAR price analysis: TradingView

If this level holds, the next resistances lie at $0.28 (0.5 Fib) and $0.30 (0.618 Fib), followed by the $0.32 (0.786 Fib) level. A confirmed breakout from the 0.382 and 0.5 Fib levels could open up the HBAR price path toward $0.35+, which aligns with the 1.0 Fib extension and previous swing highs.

Fibonacci extension levels are used to identify potential targets or resistance zones by utilizing the previous impulse move and a subsequent price retracement. In this price chart, the $0.22 level is used as the retracement zone, as the current swing is still under development.

As $0.25 serves as one of the strongest support levels, a dip below it can invalidate the bullish trend for now. Also, if the HBAR price corrects below $0.22, the short-term trend might not remain bullish anymore.

The post HBAR Whale Holdings Jump 5% in a Week; Is a Price Breakout Ahead? appeared first on BeInCrypto.

HTX Crypto Gem Hunt #8: 7 Breakout Projects Signal the Next Wave of Long-Term Crypto Value

As Bitcoin smashes through the $120,000 mark and market sentiment surges, HTX, a leading global cryptocurrency exchange takes a more measured approach, cutting through the noise to spotlight crypto assets with strong fundamentals and credible tailwinds. Now in its eighth report, HTX’s Crypto Gem Hunt reinforces the platform’s philosophy of value investing, early discovery, and quality priority, curating a list of seven standout assets that combine market momentum with long-term narrative. This is not merely a hotlist of weekly top gainers. It’s a forward-looking curation of projects positioned to outperform over longer cycles.

HTX New Listing Winners

The Selected Seven Assets: From Meme Coins and GameFi to DeFi and L1 Narratives

HTX’s Crypto Gem Hunt #8 features seven cherry-picked assets from several trending sectors with prosperous narratives. These sectors cover meme coins, GameFi, DeFi and RWA innovations, and public blockchain infrastructure.

L1 Public Chain: Time-Honored Infrastructure, New Catalysts

●        TRON ($TRX) | Rated S: TRON’s native token $TRX was recently adopted by Nasdaq-listed firm SRM as part of its strategic reserve, making TRON one of the first blockchain networks bridging into U.S. capital markets. This also makes TRON as a battle-tested Layer 1 network with a fresh off-chain narrative. While its price move of +16.7% is modest, its global exposure and off-chain integration signal a longer-term value growth.

Meme Coins: Narrative Continues with Strong Community Backing

●        BONK ($BONK): As one of Solana’s OG meme coins, $BONK is back in the spotlight, thanks to the Solana ecosystem revival. According to LetsBONK.fun, BONK has surpassed Pump.fun in on-chain activity, gaining a 193.2% surge over the period.

●        MemeCore ($M): The top gainer, with a jaw-dropping +378.3% performance. Recently listed on both HTX and BN futures markets, its liquidity and social buzz continue to scale.

●        Banana For Scale ($BANANAS31): A dark horse from the BNB Chain, up 347% since launch. Fueled by the light-hearted vibe and community energy, its memetic power still shows further viral marketing potential.

●        Build On BNB ($BOBBSC): Another rising star of meme coin on BNB Smart Chain, $BOBBSC has surged over 200%, leveraging the BNB ecosystem’s benefits. It now plays at a low market cap, ideal for early value investment.

GameFi: Legacy Tokens, New Momentum

●        FUNToken ($FUN): A veteran in the GameFi space, now seeing renewed interest. With a robust tokenomics model and real in-game utility, $FUN has rebounded nearly by 94%, positioning itself as a strong recovery asset in the GameFi comeback story.

DeFi + RWA: Real-World Asset Tokenization Heats Up

●        Maple Finance ($SYRUP): The rising star of DeFi’s institutional pivot, specializing in on-chain credit and RWA lending. While Maple is tokenizing high-quality real-world assets with strong compliance narratives, $SYRUP has gained a 71.1% increase since its launch on HTX, driven by demand for yield-generating, regulation-friendly assets.

Beyond the Charts: Why These Projects Matter

These seven assets in HTX’s Crypto Gem Hunt #8 share a key trait: they are actively delivering on their narratives, not just promising them. From TRON’s growing real-world footprint to BONK’s strong rise on Solana, from the explosive virality of MemeCore and Build On BNB to the yield-driven momentum of Maple behind RWA’s building, these aren’t flash-in-the-pan plays. They’re structurally supported stories with runway left to go.

HTX’s research team carefully tracks narrative fulfillment, not just speculation. This forward-focused methodology aims to help users identify long-term value, especially as retail sentiment continues to chase short-term price spikes. As the market heats up and narratives rotate at breakneck speed, the report stands as a reminder that the next bull cycle won’t be won by hype alone and the true gems may already be on-chain yet underexposed.

About HTX

Founded in 2013, HTX has evolved from a virtual asset exchange into a comprehensive ecosystem of blockchain businesses that span digital asset trading, financial derivatives, research, investments, incubation, and other businesses.

As a world-leading gateway to Web3, HTX harbors global capabilities that enable it to provide users with safe and reliable services. Adhering to the growth strategy of “Global Expansion, Thriving Ecosystem, Wealth Effect, Security & Compliance,” HTX is dedicated to providing quality services and values to virtual asset enthusiasts worldwide.To learn more about HTX, please visit https://www.htx.com/ or HTX Square , and follow HTX on X, Telegram, and Discord.

The post HTX Crypto Gem Hunt #8: 7 Breakout Projects Signal the Next Wave of Long-Term Crypto Value appeared first on BeInCrypto.

High-Risk Trader James Wynn Bags First Half-Million Profit Since May

High-risk crypto trader James Wynn, who made headlines for his aggressive leveraged trading strategies and accompanying losses, has turned a profit, earning over half a million dollars today. This marked his largest profit since May 25.

This marks a dramatic turnaround for Wynn, whose luck had run dry after watching all his previous gains wiped out by highly leveraged positions on Hyperliquid.

James Wynn’s Trading Rollercoaster Ends in Green—for Now

In June, BeInCrypto reported on Wynn’s substantial $100 million loss on Hyperliquid. Despite the blow, he continued making high-stakes bets.

This month, the blockchain analytics platform Lookonchain highlighted that Wynn transferred 27,522 USDC to Hyperliquid and collected a referral bonus of $3,960.84 on July 10. He then opened a high-risk 40x leveraged short position on Bitcoin.

Nonetheless, once again, betting against the market did not prove favorable for Wynn. In less than 12 hours, Wynn’s high-stakes short was fully liquidated, resulting in a fresh loss of $27,921.63. One day later, Wynn deactivated his X (formerly Twitter) account.

“James Wynn has deactivated his X account! What happened? Did he blow up completely?  All his wallets and Hyperliquid balance combined are down to just $10,176,” Lookonchain posted.

However, the silence didn’t last long. On July 15, Wynn reemerged, claiming a referral reward of 6,792.53 USDC. This time, he went long on PEPE with 10x leverage. 

Lookonchain then observed that the trader added around 468,000 USDC into Hyperliquid. He took another bold step, opening a 40x leveraged long position on Bitcoin. Despite facing partial liquidation, Wynn managed to profit by shifting strategies.

“He flipped from long to short on BTC and HYPE — pulling in $473.9K in profits,” the firm added.

Hyperdash data further revealed that he made $105,948 and $345,456, respectively, on July 18 and 19, from his short Bitcoin positions. Furthermore, yesterday, Wynn deposited an additional 536,573 USDC into Hyperliquid. He then opened two new leveraged positions: a 25x long on Ethereum and a 10x long on PEPE.

Today, he closed both trades, earning $33,386 from ETH and a staggering $521,313.86 from PEPE. The latter marks his most profitable single trade since his $18 million win on May 25.

Wynn still has two open leveraged positions. This includes a 10× long on DOGE, which is sitting on an unrealized gain of $374,095. Another 10× long on PEPE currently shows an unrealized gain of $30,759.

James Wynn Hyperliquid Open Positions
James Wynn Hyperliquid Open Positions. Source: Hyperdash

Since returning to the market on July 15, the trader has had a mixed performance, with seven profitable trades and eight net losses recorded. At the time of writing, his win rate stood at 36.6%.

While none of these gains are enough to reverse his losses, they still offer a glimmer of hope for the trader. 

Meanwhile, Lookonchain also highlighted another trader, not for heavy losses, but for a series of well-timed strategic bets that earned him nearly $30 million in just seven days.

“Meet ‘The White Whale,’ a top trader on Hyperliquid with nearly $30 million profit in just one week! Over the past week alone, he used 4 wallets to long ETH and SOL—locking in nearly 30 million in gains and claiming the #1 spot on the leaderboard,” Lookonchain wrote.

Thus, the contrasting performances of James Wynn and the “White Whale” highlight the high-risk, high-reward nature of leveraged trading, where fortunes can be made or lost in a matter of hours.

The post High-Risk Trader James Wynn Bags First Half-Million Profit Since May appeared first on BeInCrypto.

Ethereum Propels Crypto Inflows to Record $4.39 Billion Weekly High

Ethereum (ETH) remains in the spotlight for the third week in a row, benefiting from a surge in institutional interest. Amid growing interest in Ethereum reserve strategies, the largest altcoin has pushed crypto inflows to a record weekly high.

Meanwhile, interest in Ethereum is spilling over to altcoins, inspiring calls for an imminent altseason among analysts.

Crypto Inflows Hit $4.39 Billion Last Week

The latest CoinShares report indicates crypto inflows reached $4.39 billion last week. It marks an all-time high (ATH) in weekly inflows, bringing year-to-date (YTD) positive flows to $27 billion. Meanwhile, assets under management (AuM) are at a record $220 billion.

“Digital asset investment products recorded their largest weekly inflows on record, totaling $4.39 billion, surpassing the previous peak of $4.27 billion set post-US election in December 2024,” wrote James Butterfill, head of research at CoinShares.   

It marks a significant upscale, after the week ending July 12 saw crypto inflows top out at $3.7 billion. It also extends the streak of positive flows, marking the 14th consecutive week of crypto inflows.

Crypto Inflows Last Week
Crypto Inflows Last Week. Source: CoinShares

As indicated in the chart, Bitcoin (BTC) led, recording up to $2,196 billion in crypto inflows. However, Ethereum remains the outlier, more than doubling its inflows in a week. As BeInCrypto reported for the week ending July 12, Ethereum inflows reached $990.4 million.

Last week, however, inflows into Ethereum products reached 2,188.7 billion, a 2.1x growth in a week. Meanwhile, positive flows to Bitcoin dropped from $2,731 to $2,196.

“Ethereum stole the show, attracting a record $2.12 billion in inflows, nearly double its previous record of $1.2 billion. The past 13 weeks of inflows now represent 23% of Ethereum AuM, with 2025 inflows already exceeding the full-year total for 2024 at $6.2 billion,” Butterfill added.

The 2.1x surge in Ethereum inflows is unsurprising, coming on as institutional interest in the pioneer altcoin accelerates. Among them are Sharplink Gaming and BitMine, which now hold over $1 billion in Ethereum.

BeInCrypto also reported the recent surge in Ethereum price, with the giant altcoin’s market capitalization exceeding that of Goldman Sachs and the Bank of China combined.

Whales and ETFs (exchange-traded funds) have also been pouring billions into the Ethereum market, with analysts highlighting a possible ATH soon.

Nevertheless, even as Ethereum continues to ride the wave of soaring interest, both at retail and institutional levels, some analysts call for caution.

“It’s time to start thinking about exit strategies… Bitcoin and altcoins are approaching the traditional 4-year cycle tops in terms of timing,” Ran Neuner, host of Crypto Banter, told his followers.

Similarly, Benjamin Cowen, founder of Into the Cryptoverse, notes that many altcoins are underperforming Ethereum.

According to the analyst, Ethereum’s growing dominance at the expense of smaller-cap assets often signals a late-cycle, with capital consolidating into majors before a broader downturn.

Against these backdrops, trader Daan Crypto Trades advises investors to consider rotating gains and managing risk, a strategy for maximizing returns in the face of inevitable volatility.

Ethereum (ETH) Price Performance
Ethereum (ETH) Price Performance. Source: BeInCrypto

As of this writing, Ethereum was trading for $3,786, up by over 2% in the last 24 hours.

The post Ethereum Propels Crypto Inflows to Record $4.39 Billion Weekly High appeared first on BeInCrypto.