PENGU Price Forms New All-Time High After 6 Months Even As Skeptical Investors Exit
Pudgy Penguins (PENGU) has recently reached a new all-time high (ATH) of $0.046, marking a six-month milestone for the meme coin.
However, even with the record high, the altcoin is facing a challenge from investors who seem to be exiting, albeit gradually. This could lead to a drop in the PENGU price.
Pudgy Penguins Notes Demand
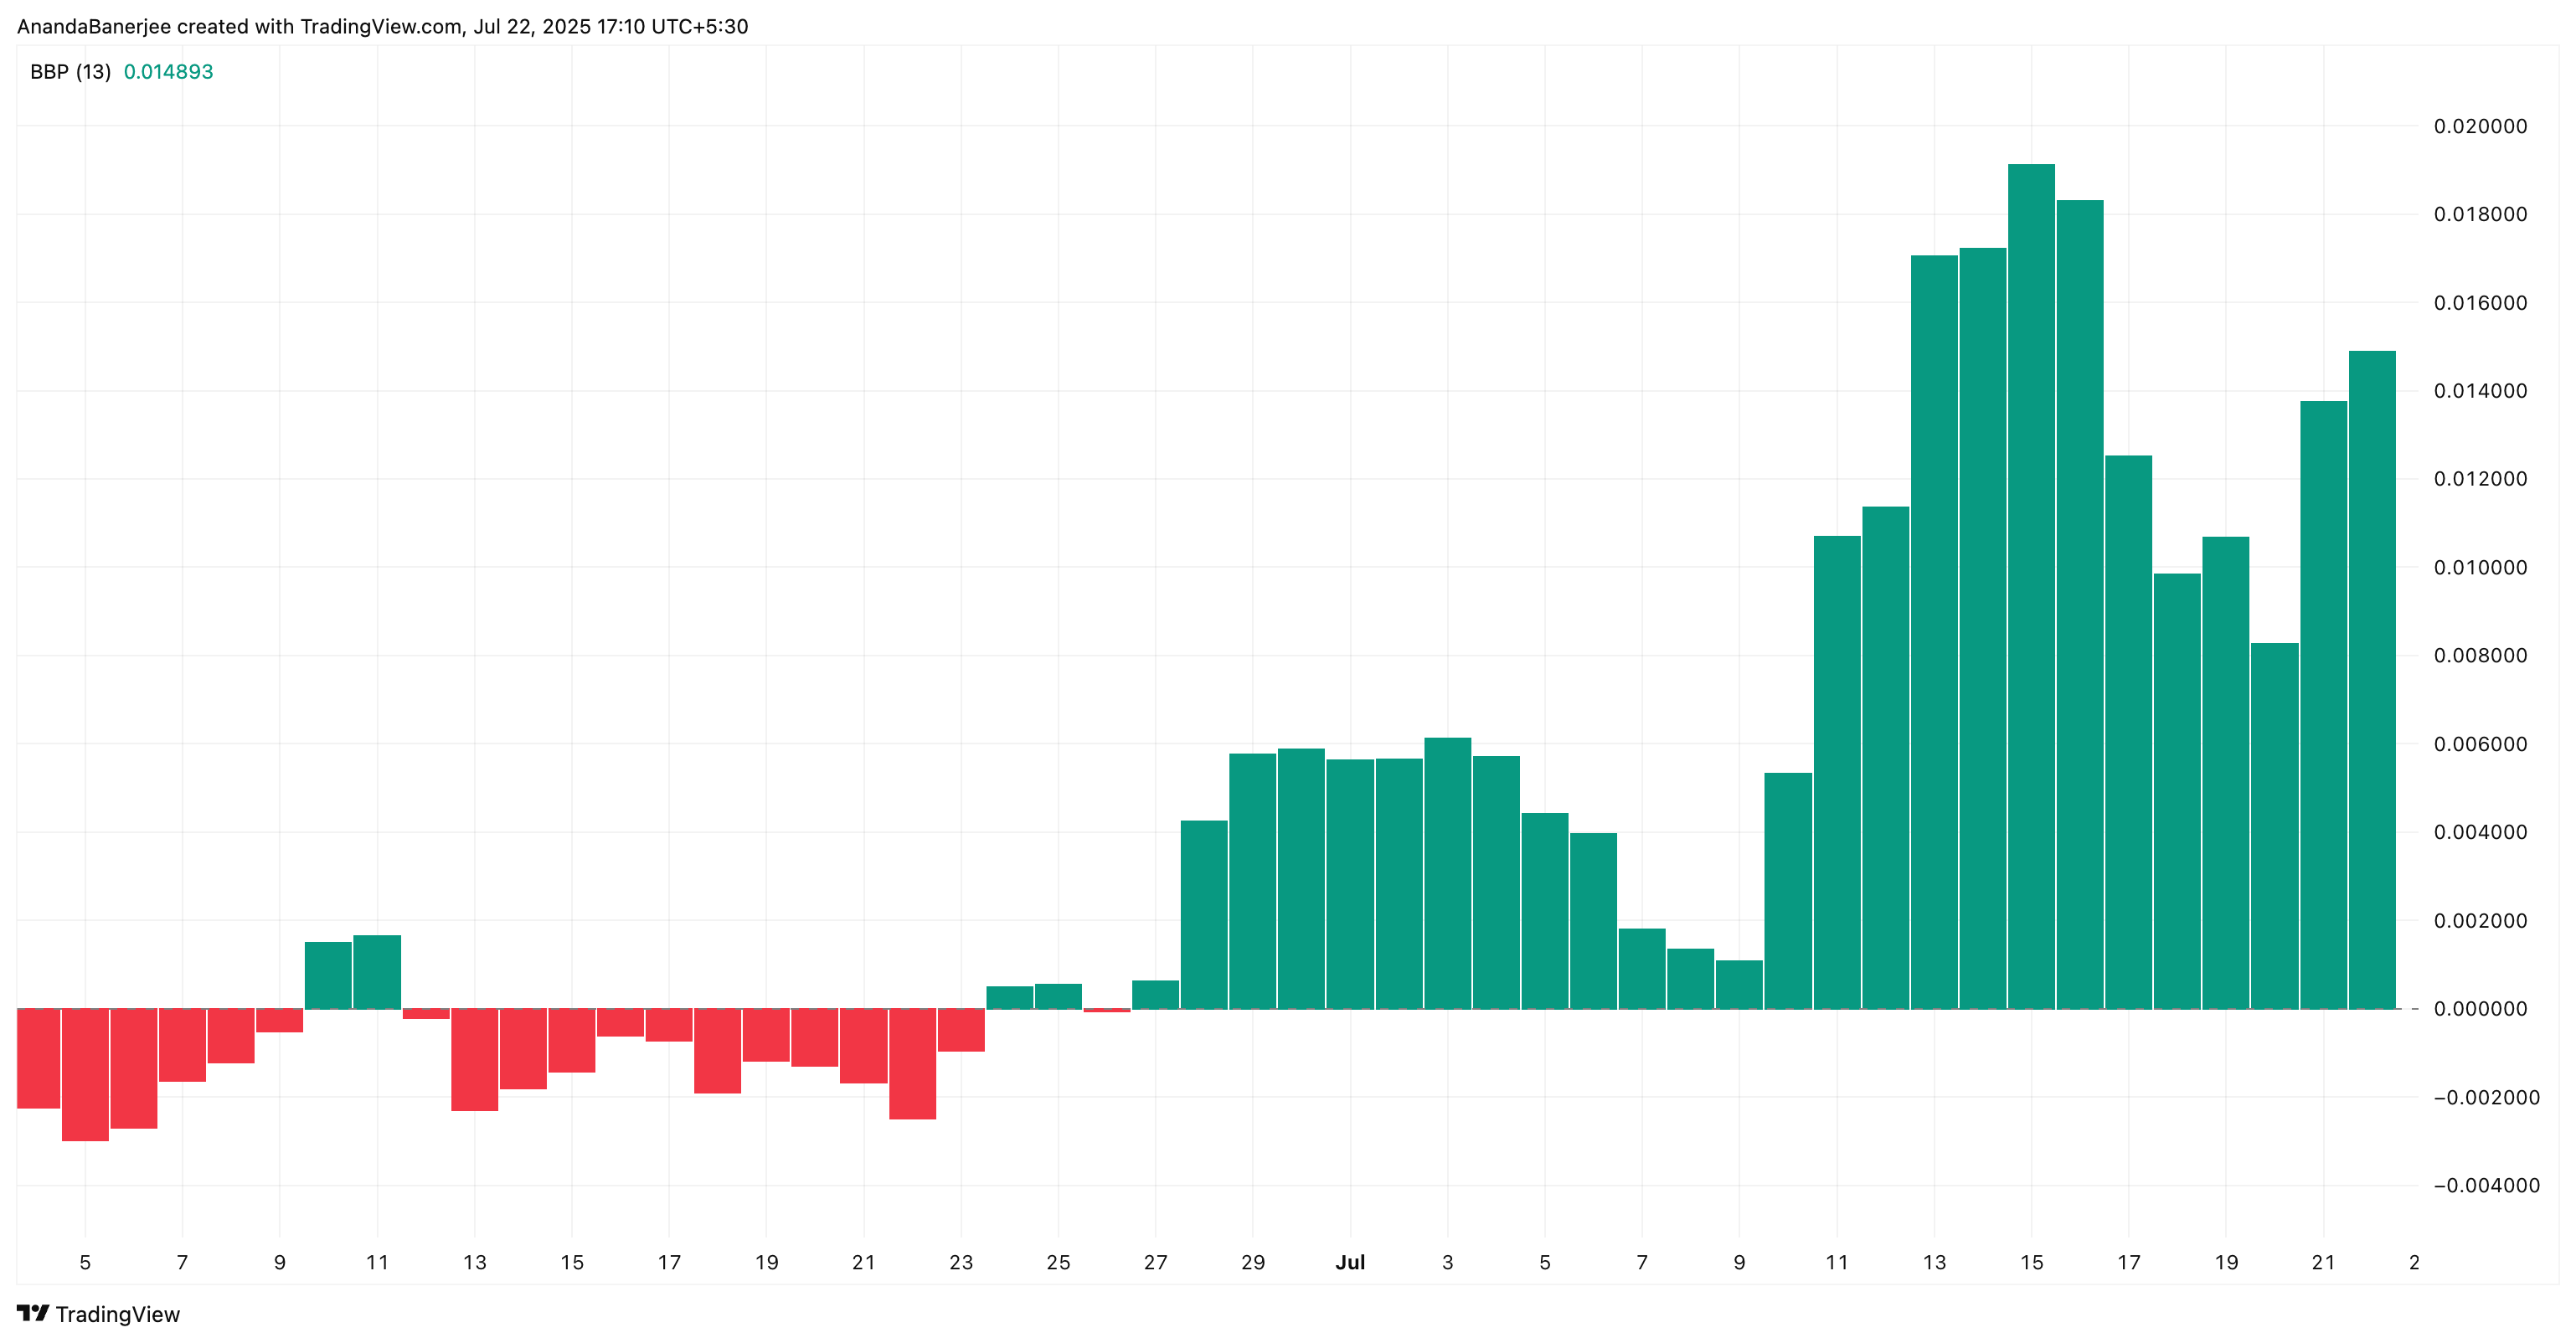
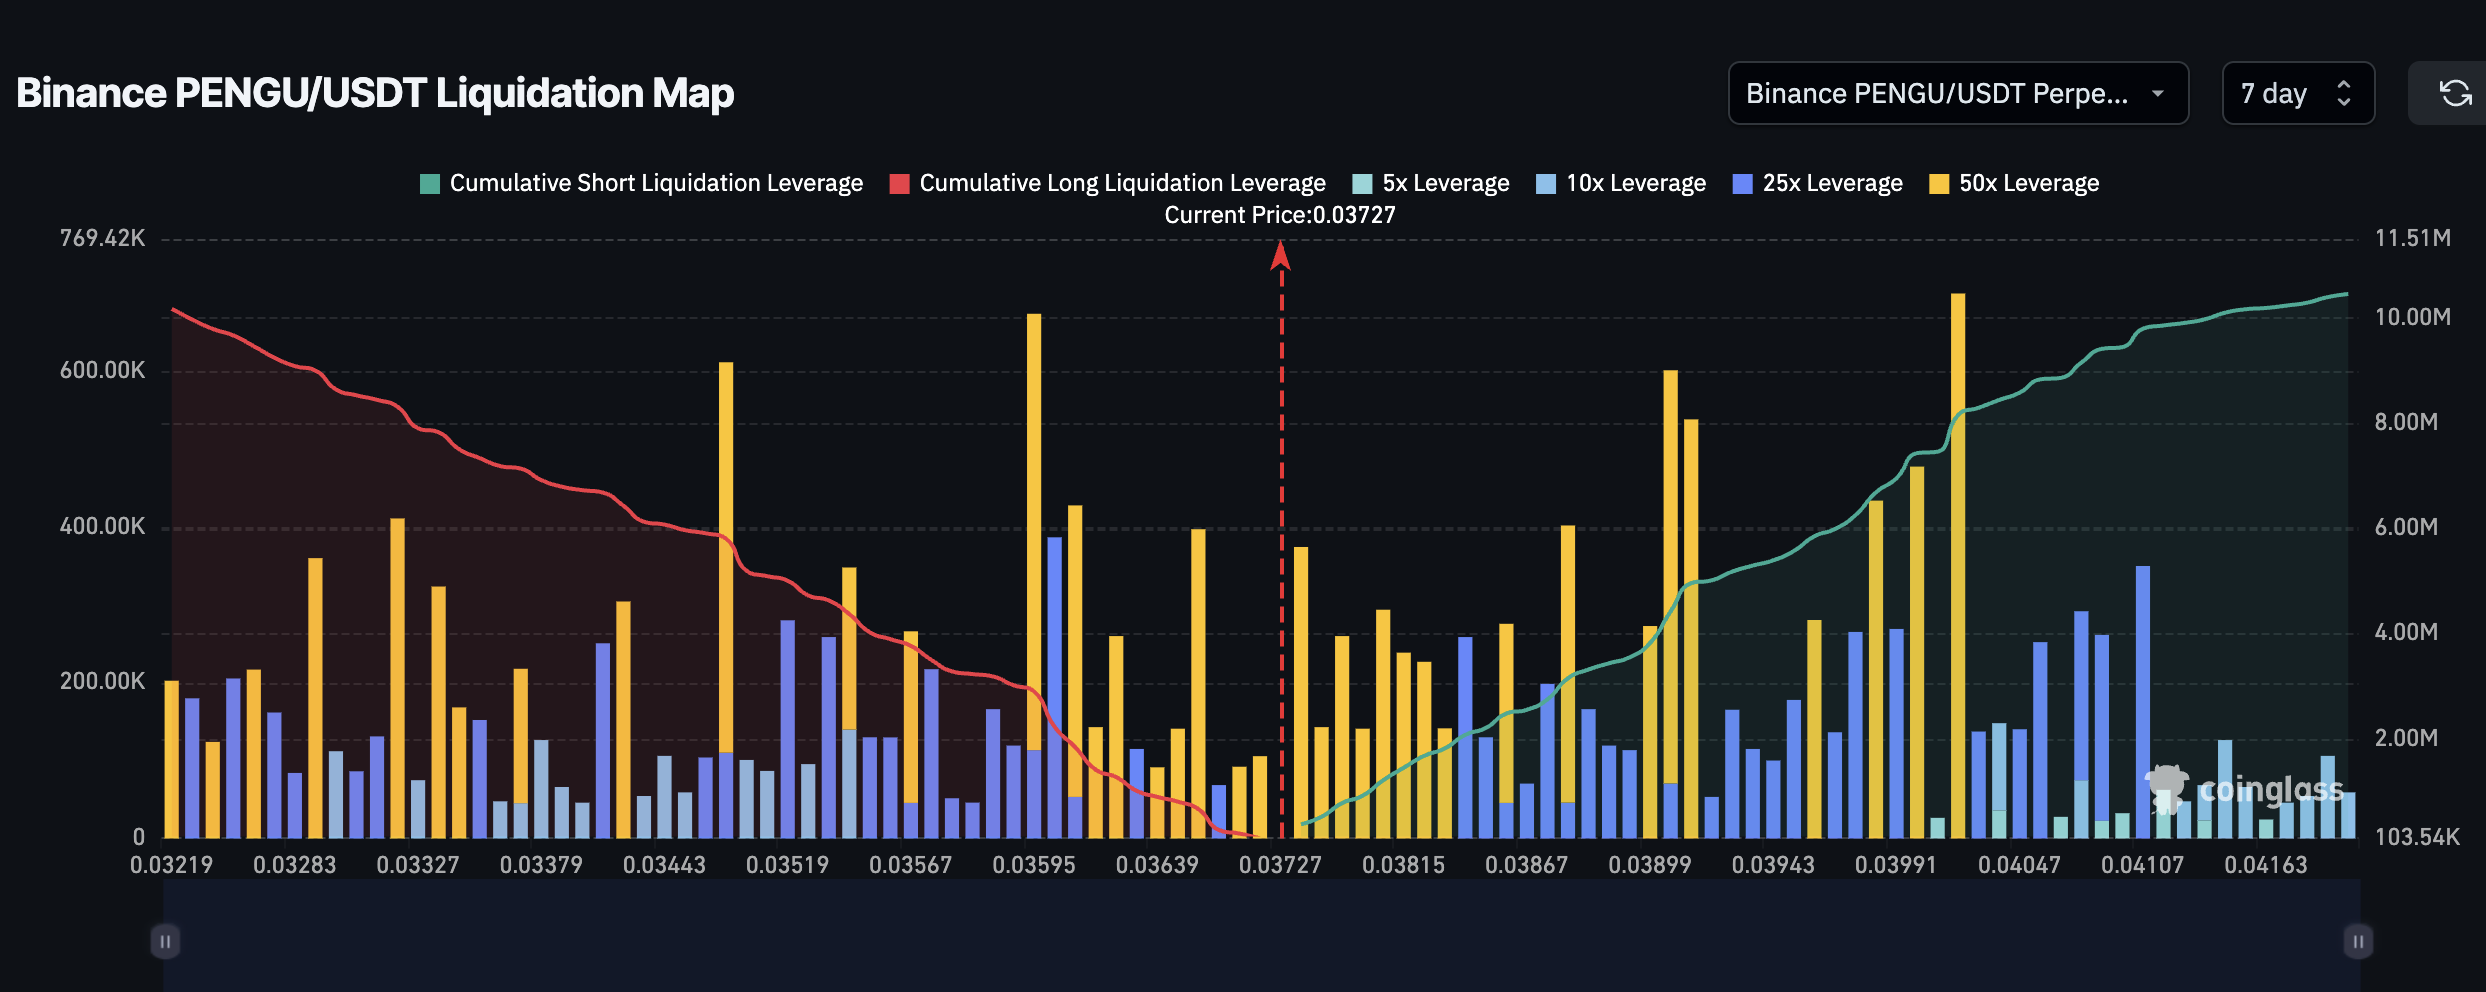
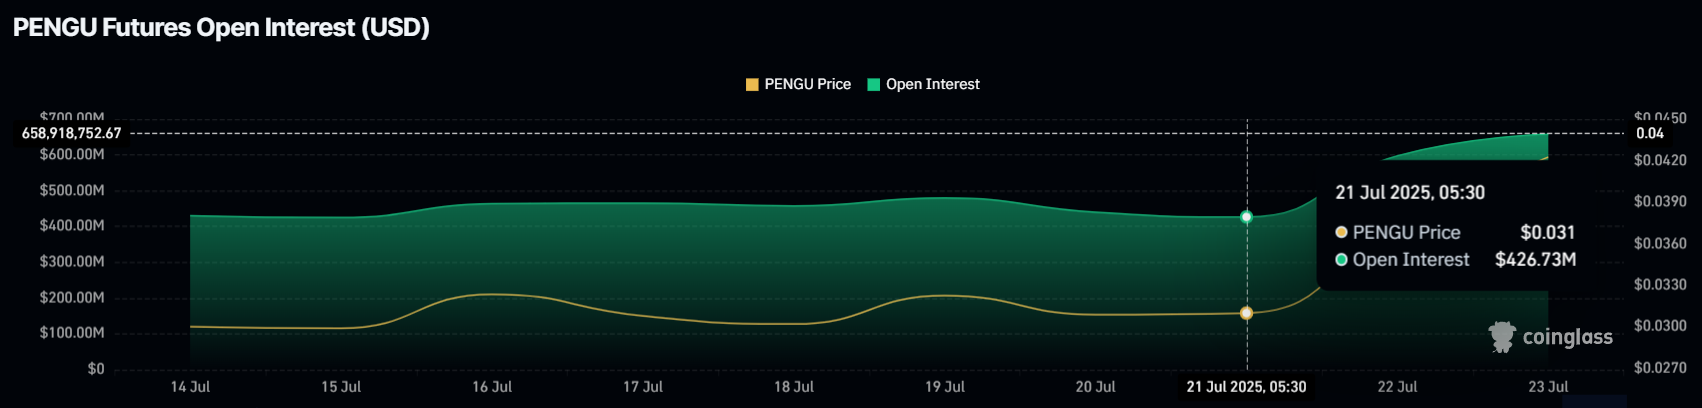
The rising demand for PENGU has been reflected in the derivatives market. Open Interest, which combines both long and short contracts, surged by 54% in just 48 hours, jumping from $426 million to $657 million. This indicates that the majority of market participants are bullish, as the funding rate remains largely positive, suggesting a stronger preference for long contracts.
This increase in Open Interest signals investor optimism despite the broader market’s turbulence. The surge in contract volumes reflects that PENGU’s price rally is based on spot market trades and also on substantial leverage.
For token TA and market updates: Want more token insights like this? Sign up for Editor Harsh Notariya’s Daily Crypto Newsletter here.
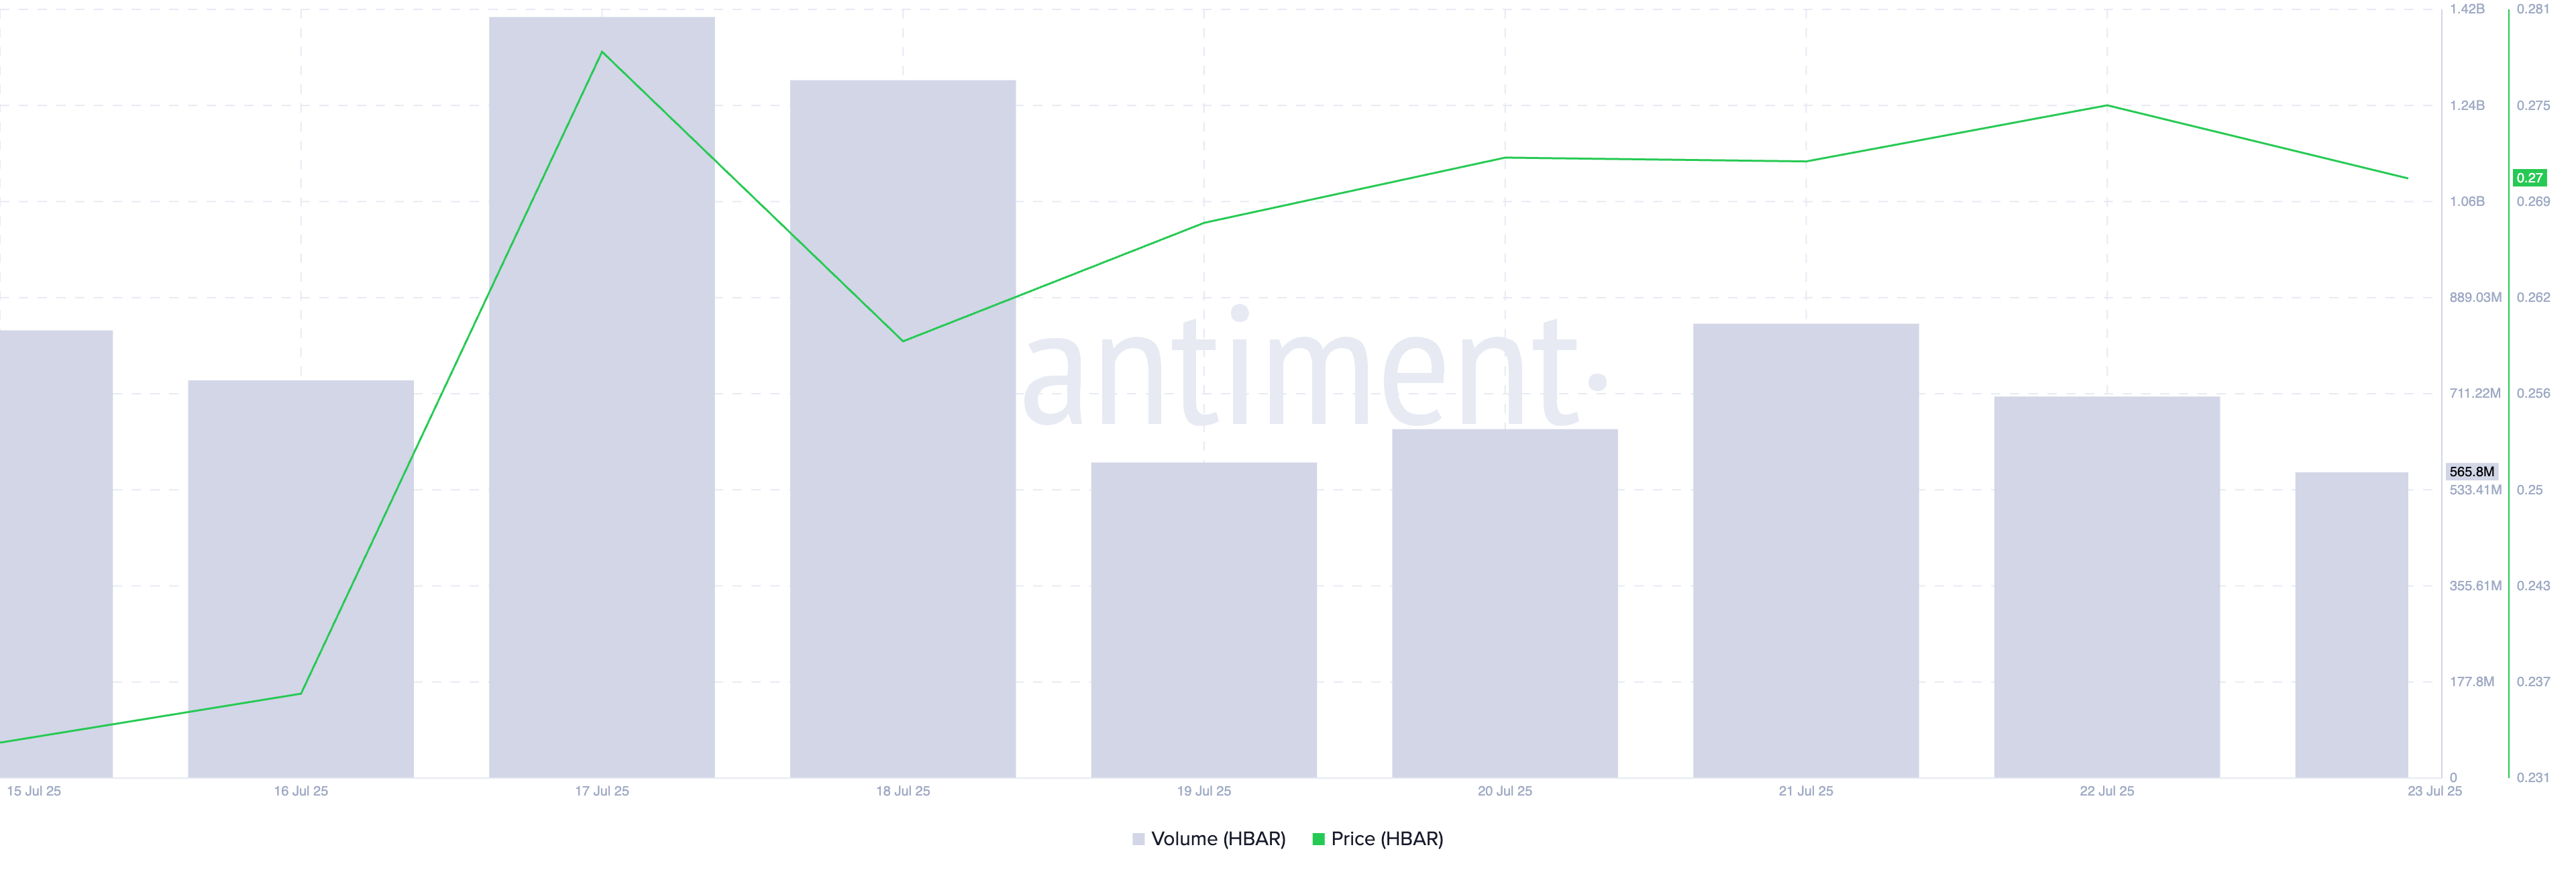
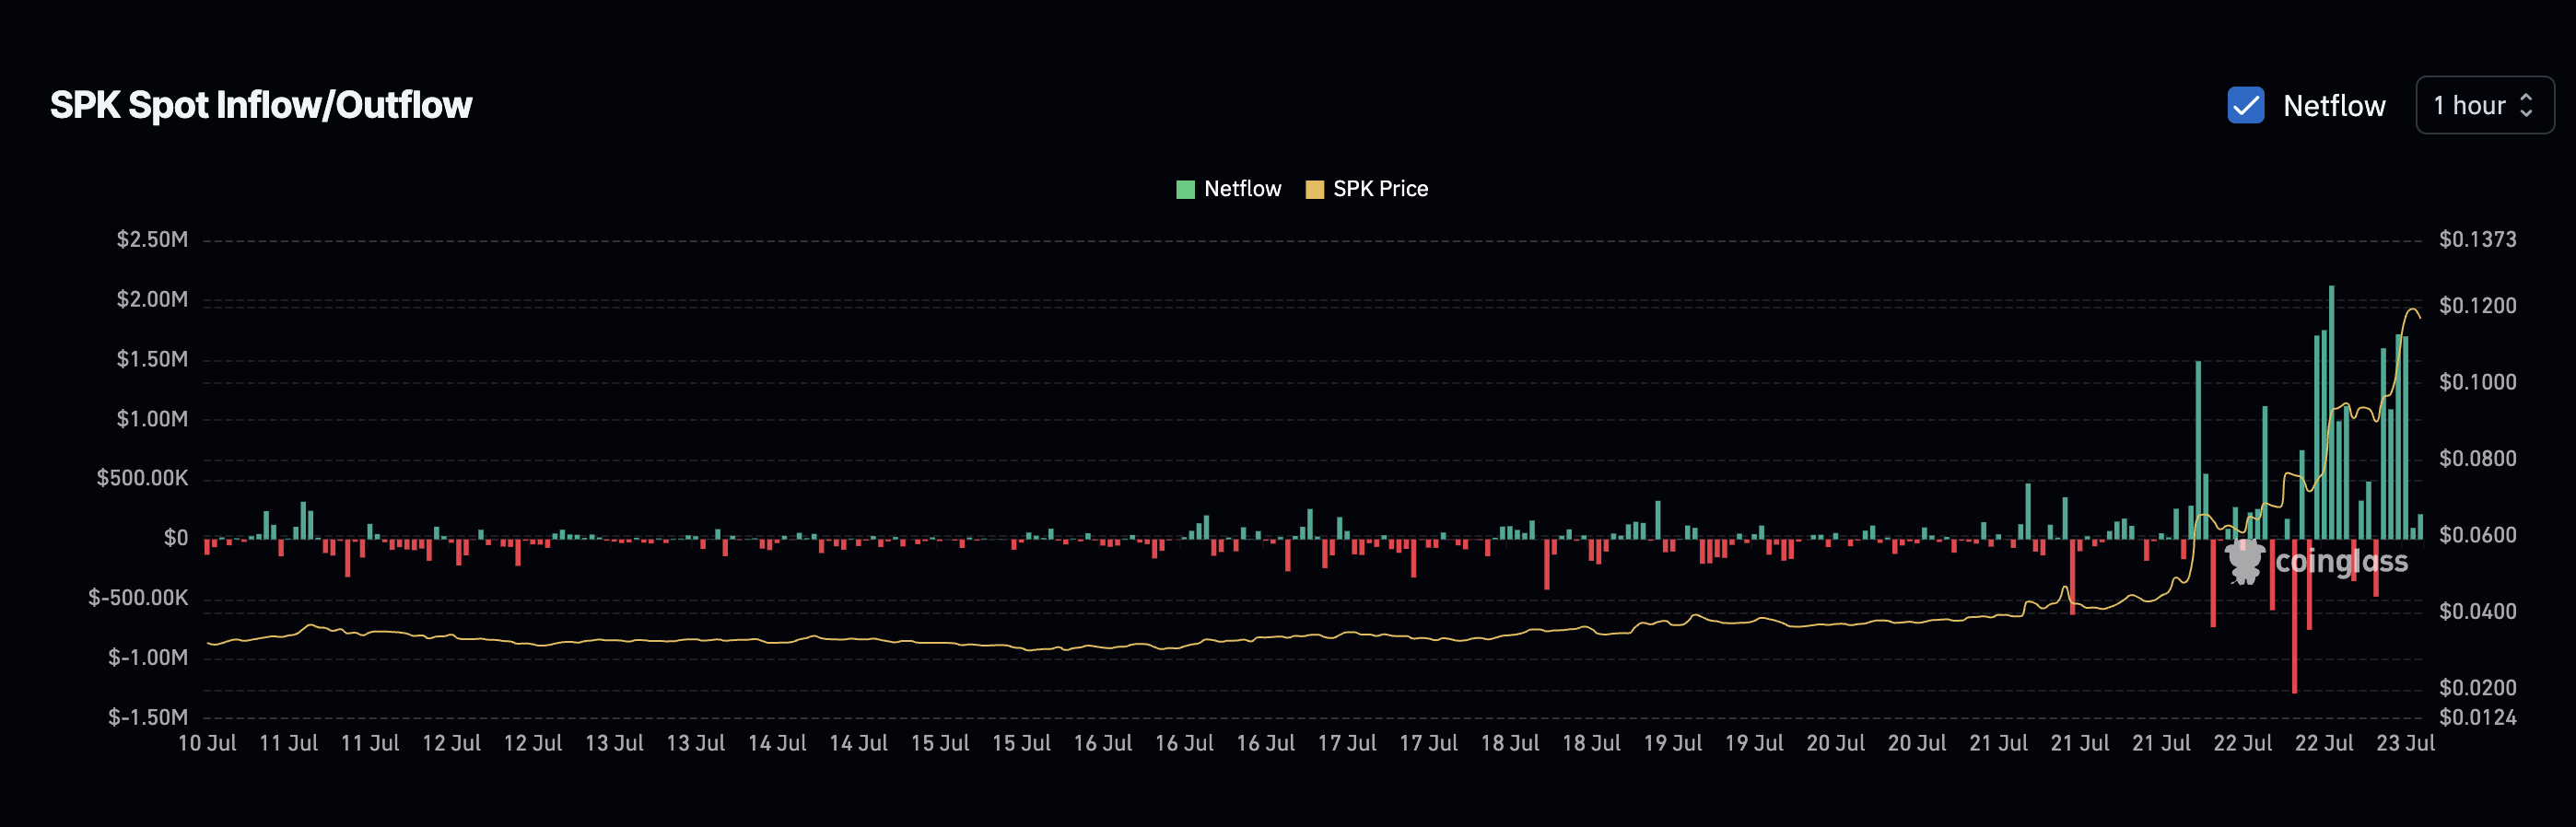
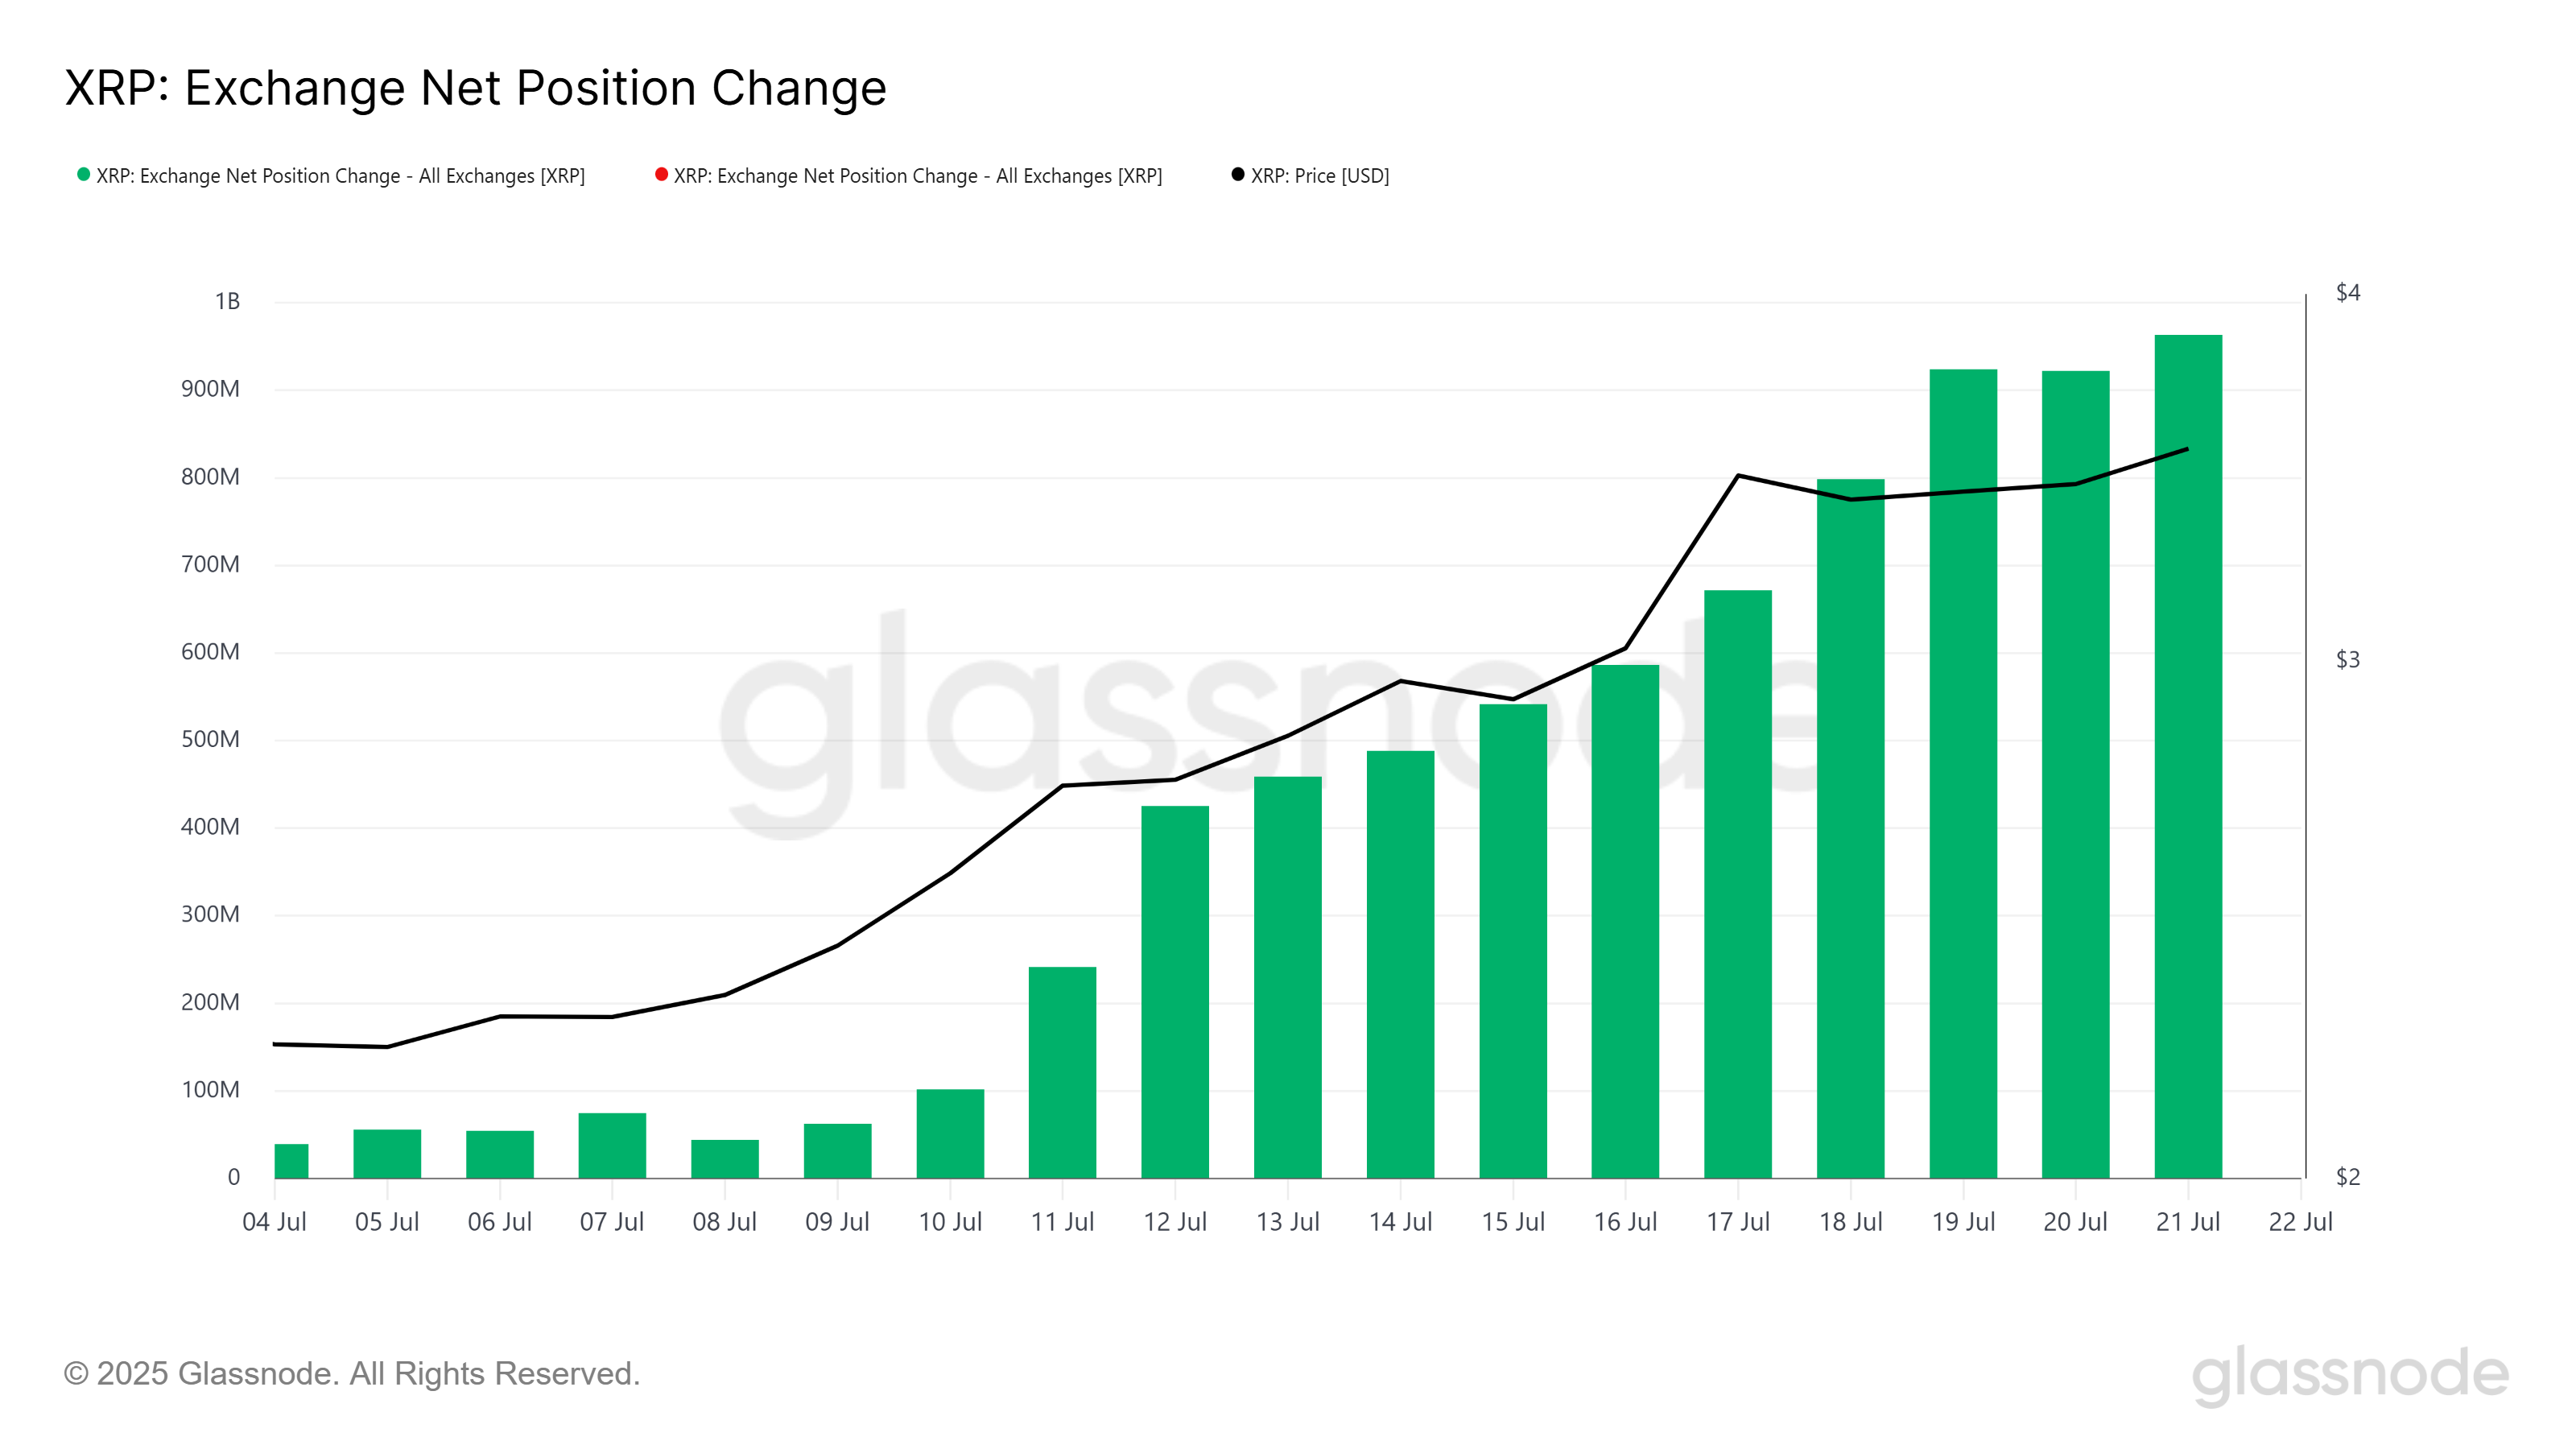
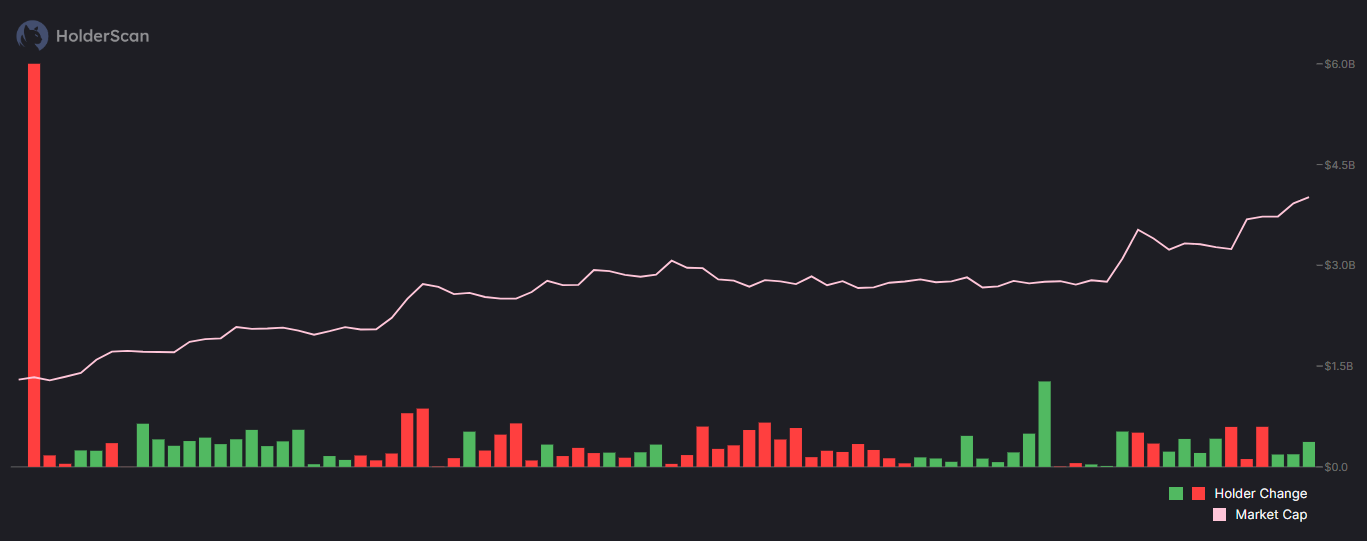
Over the past few days, the holder change for PENGU has been a mix of new investors entering the market and some existing holders exiting. This mixed sentiment shows that there is no clear consensus among investors. While some are confident in PENGU’s potential, others remain cautious, unsure of the sustainability of the recent gains.
The lack of a clear investor pattern indicates skepticism is still widespread. Despite this, the entry of new holders suggests that there is still a strong belief in PENGU’s future, driven by the altcoin’s price momentum and broader market conditions. However, the simultaneous exit of investors could create an underlying challenge for sustaining the uptrend.
PENGU Price Could Continue Rising
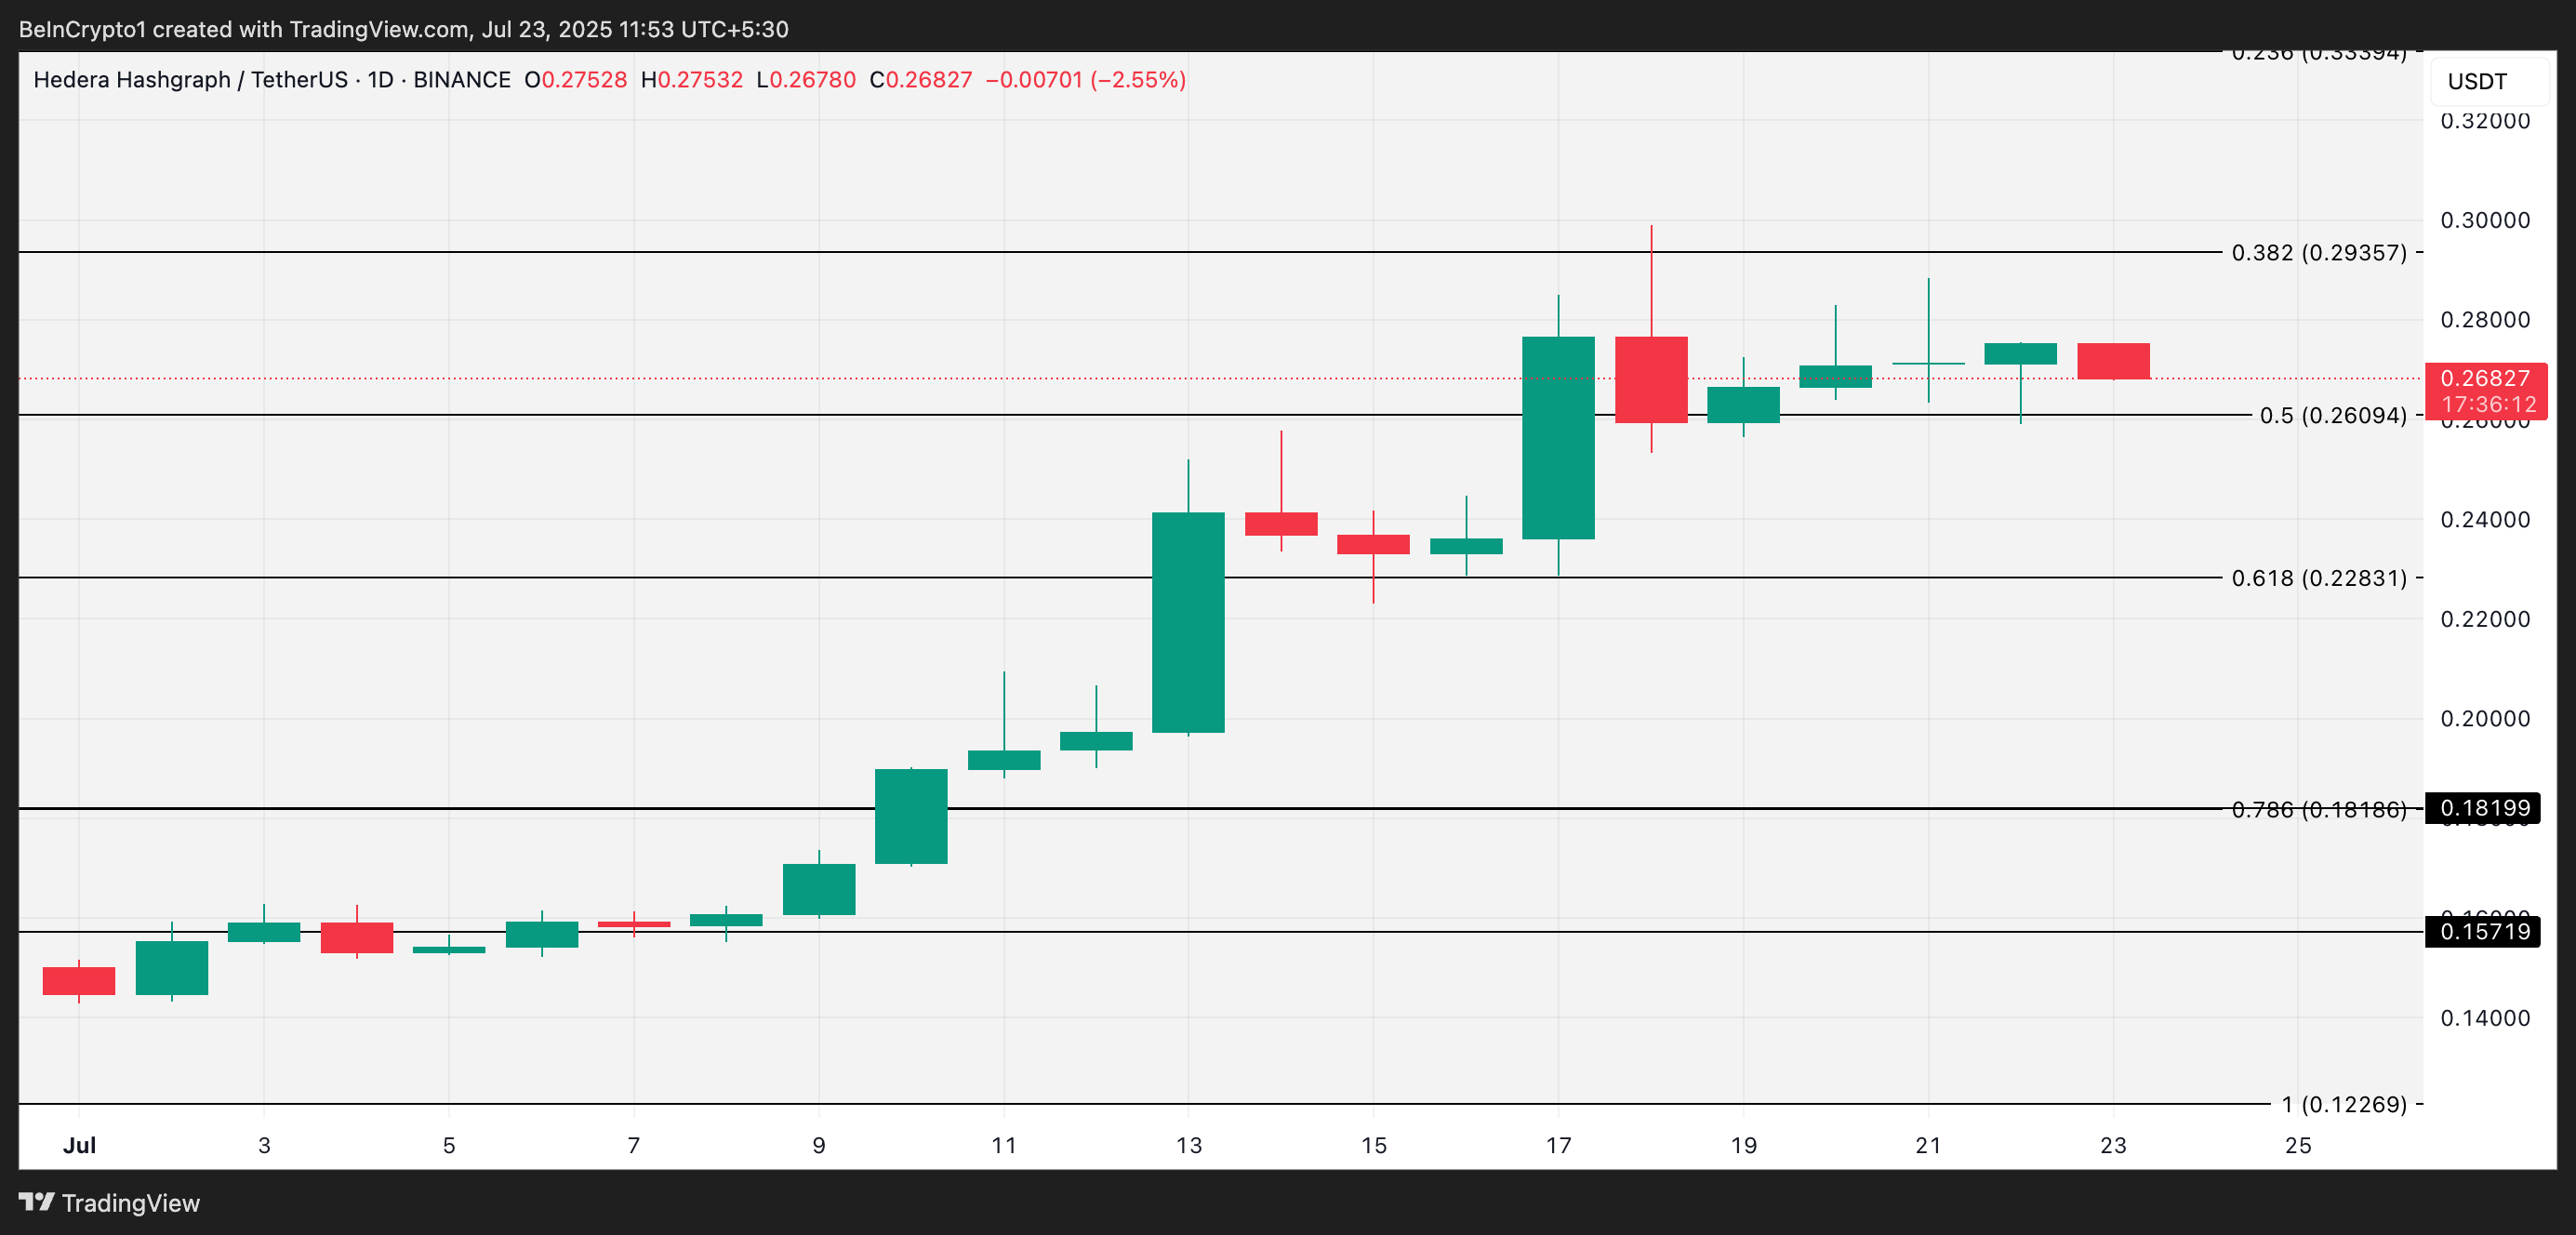
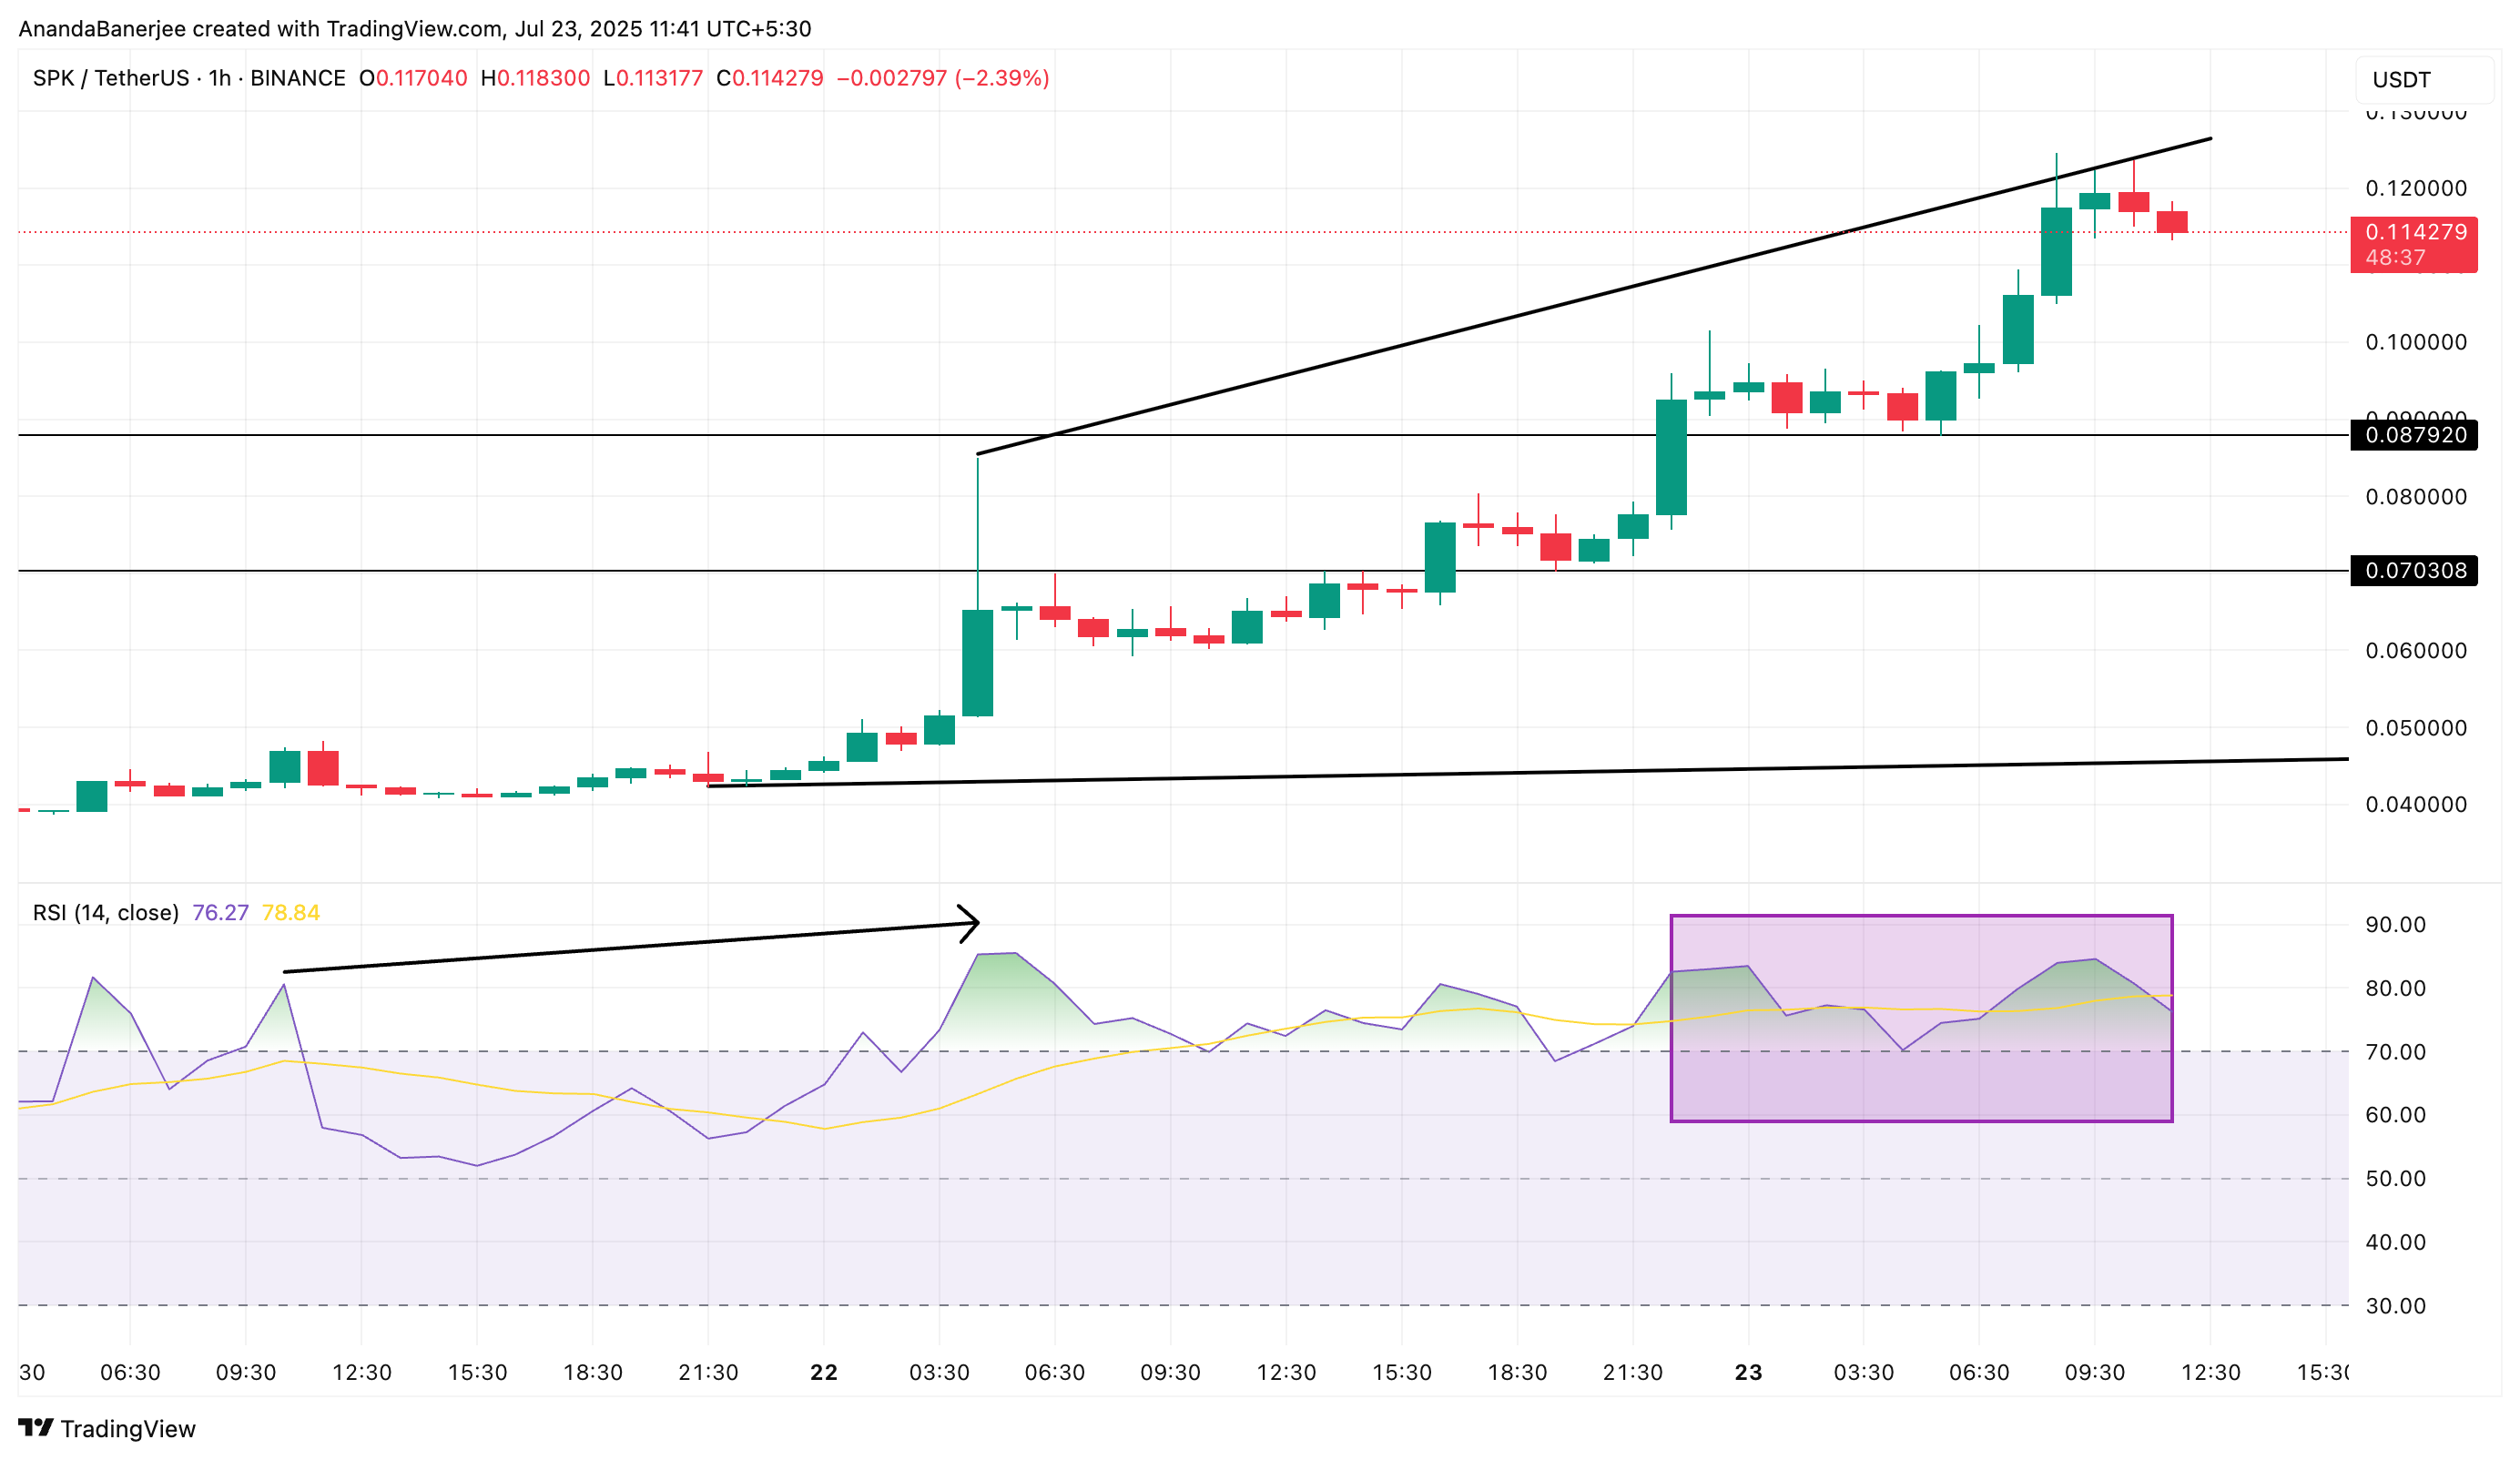
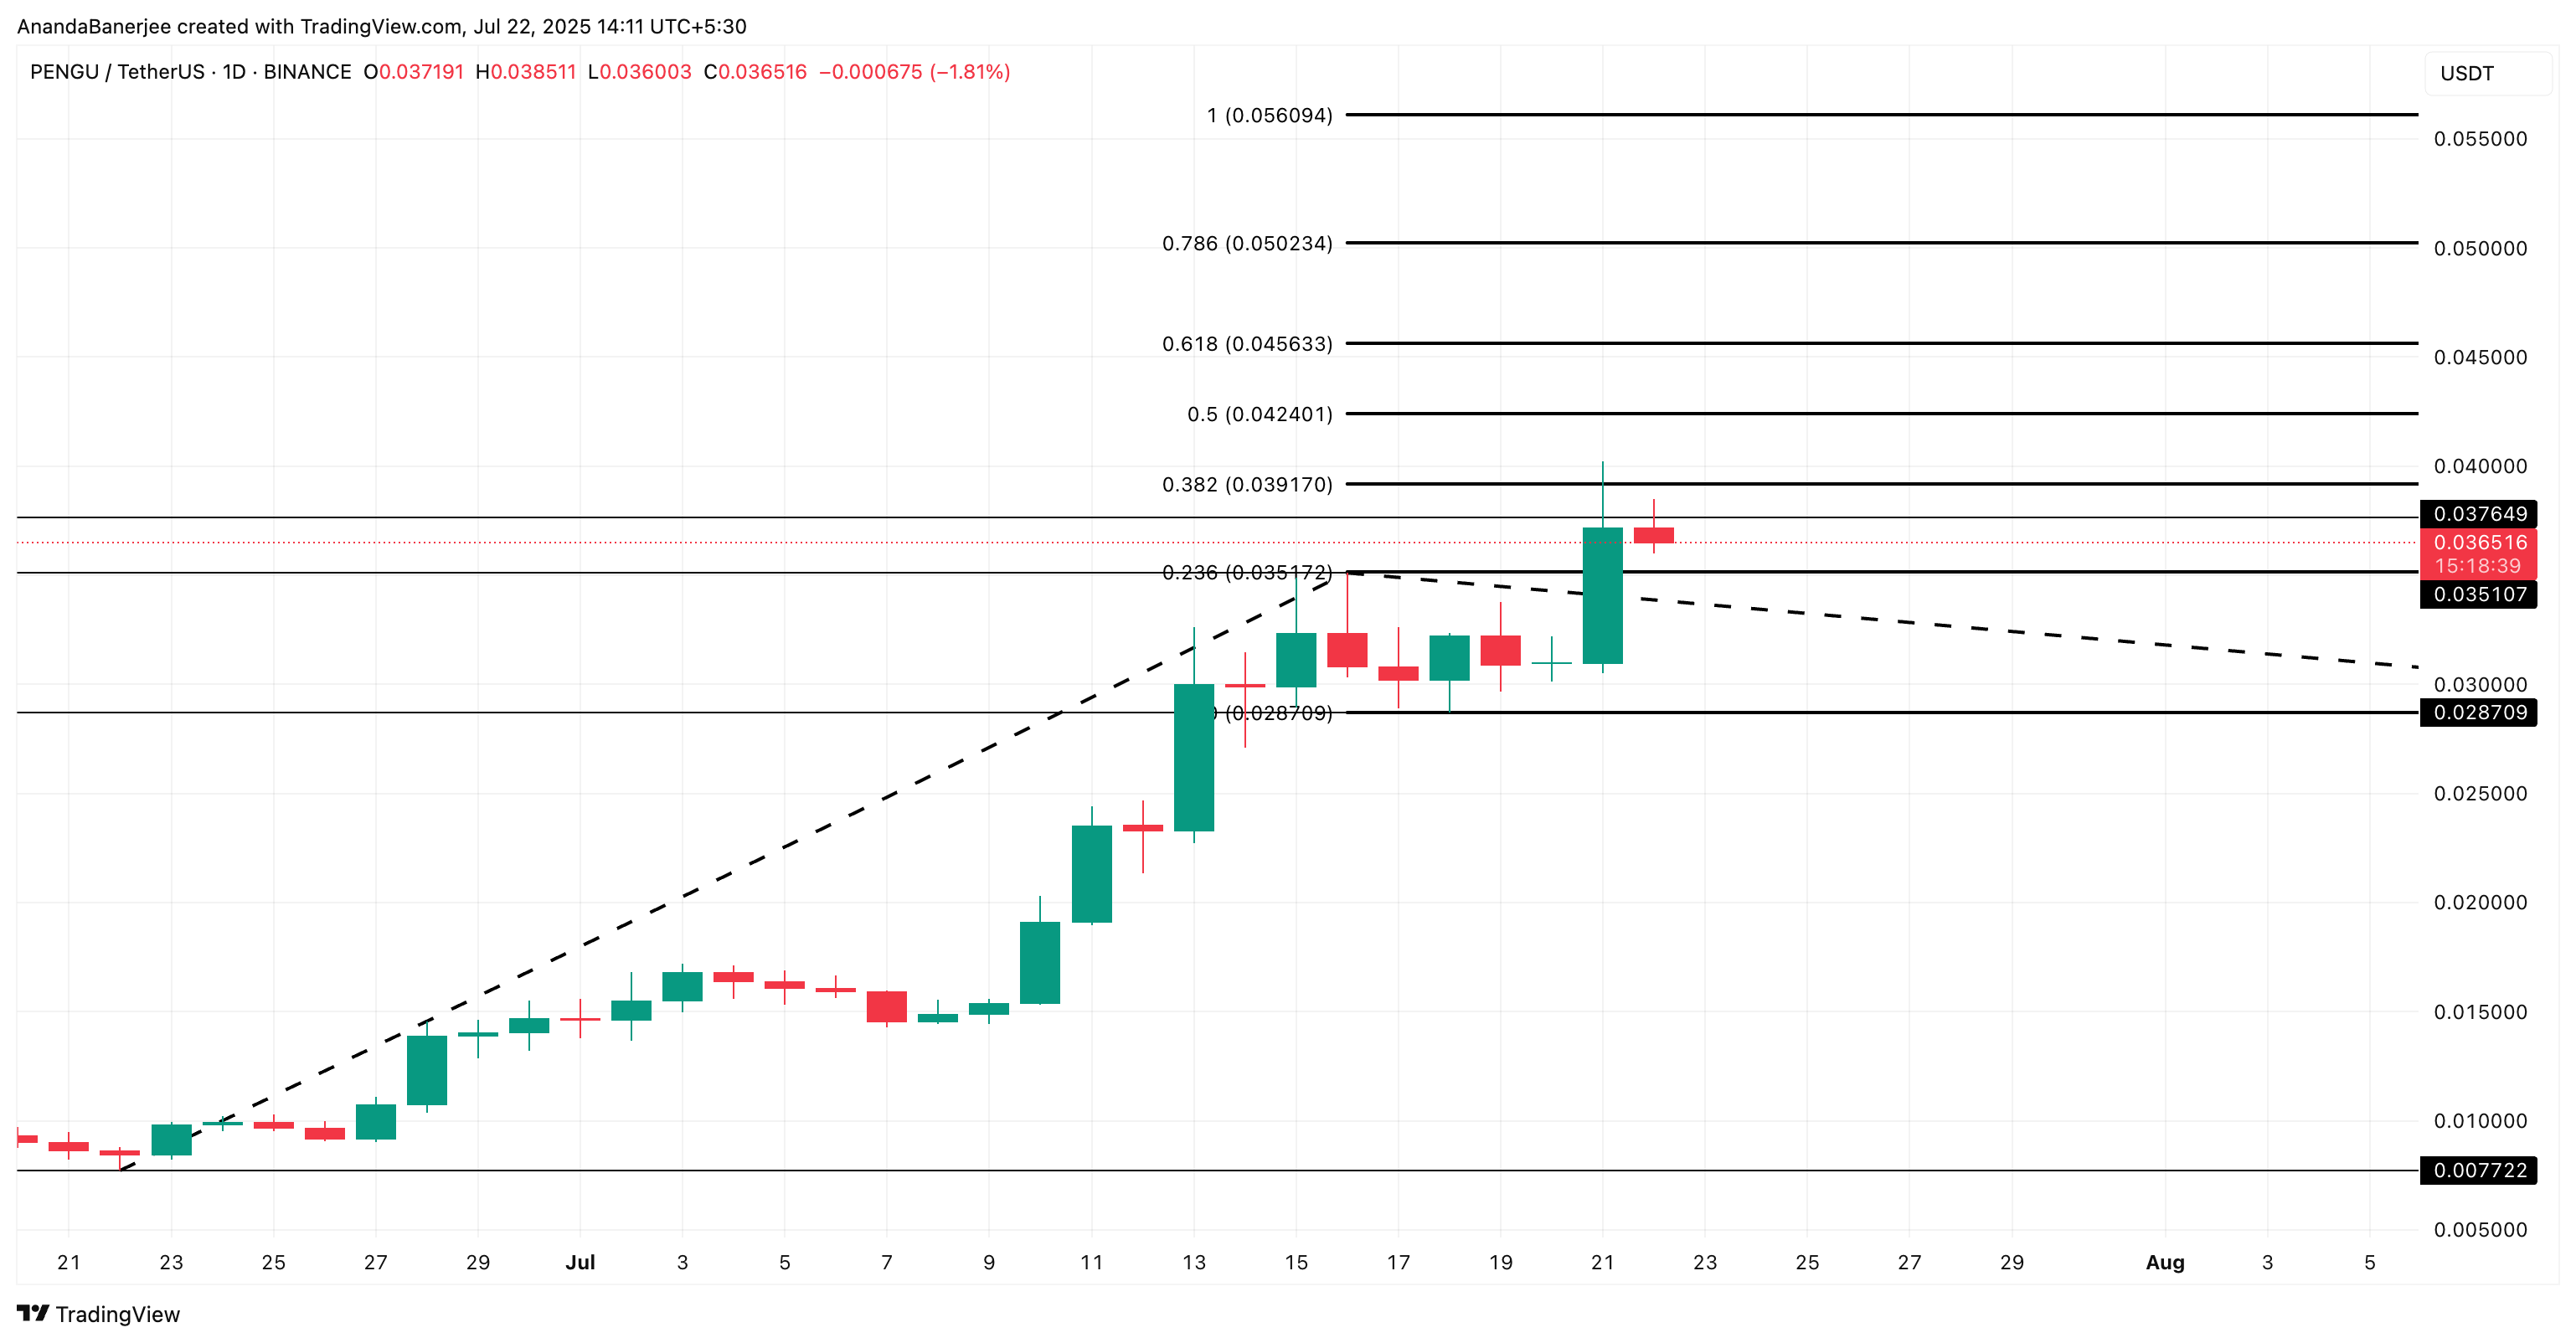
PENGU’s price is currently trading at $0.044, after marking a new ATH of $0.046 earlier today. The altcoin has risen nearly 20% in the last 24 hours, showing strong short-term gains. This price action has led PENGU to a six-month high, highlighting the recent bullish sentiment surrounding the meme coin.
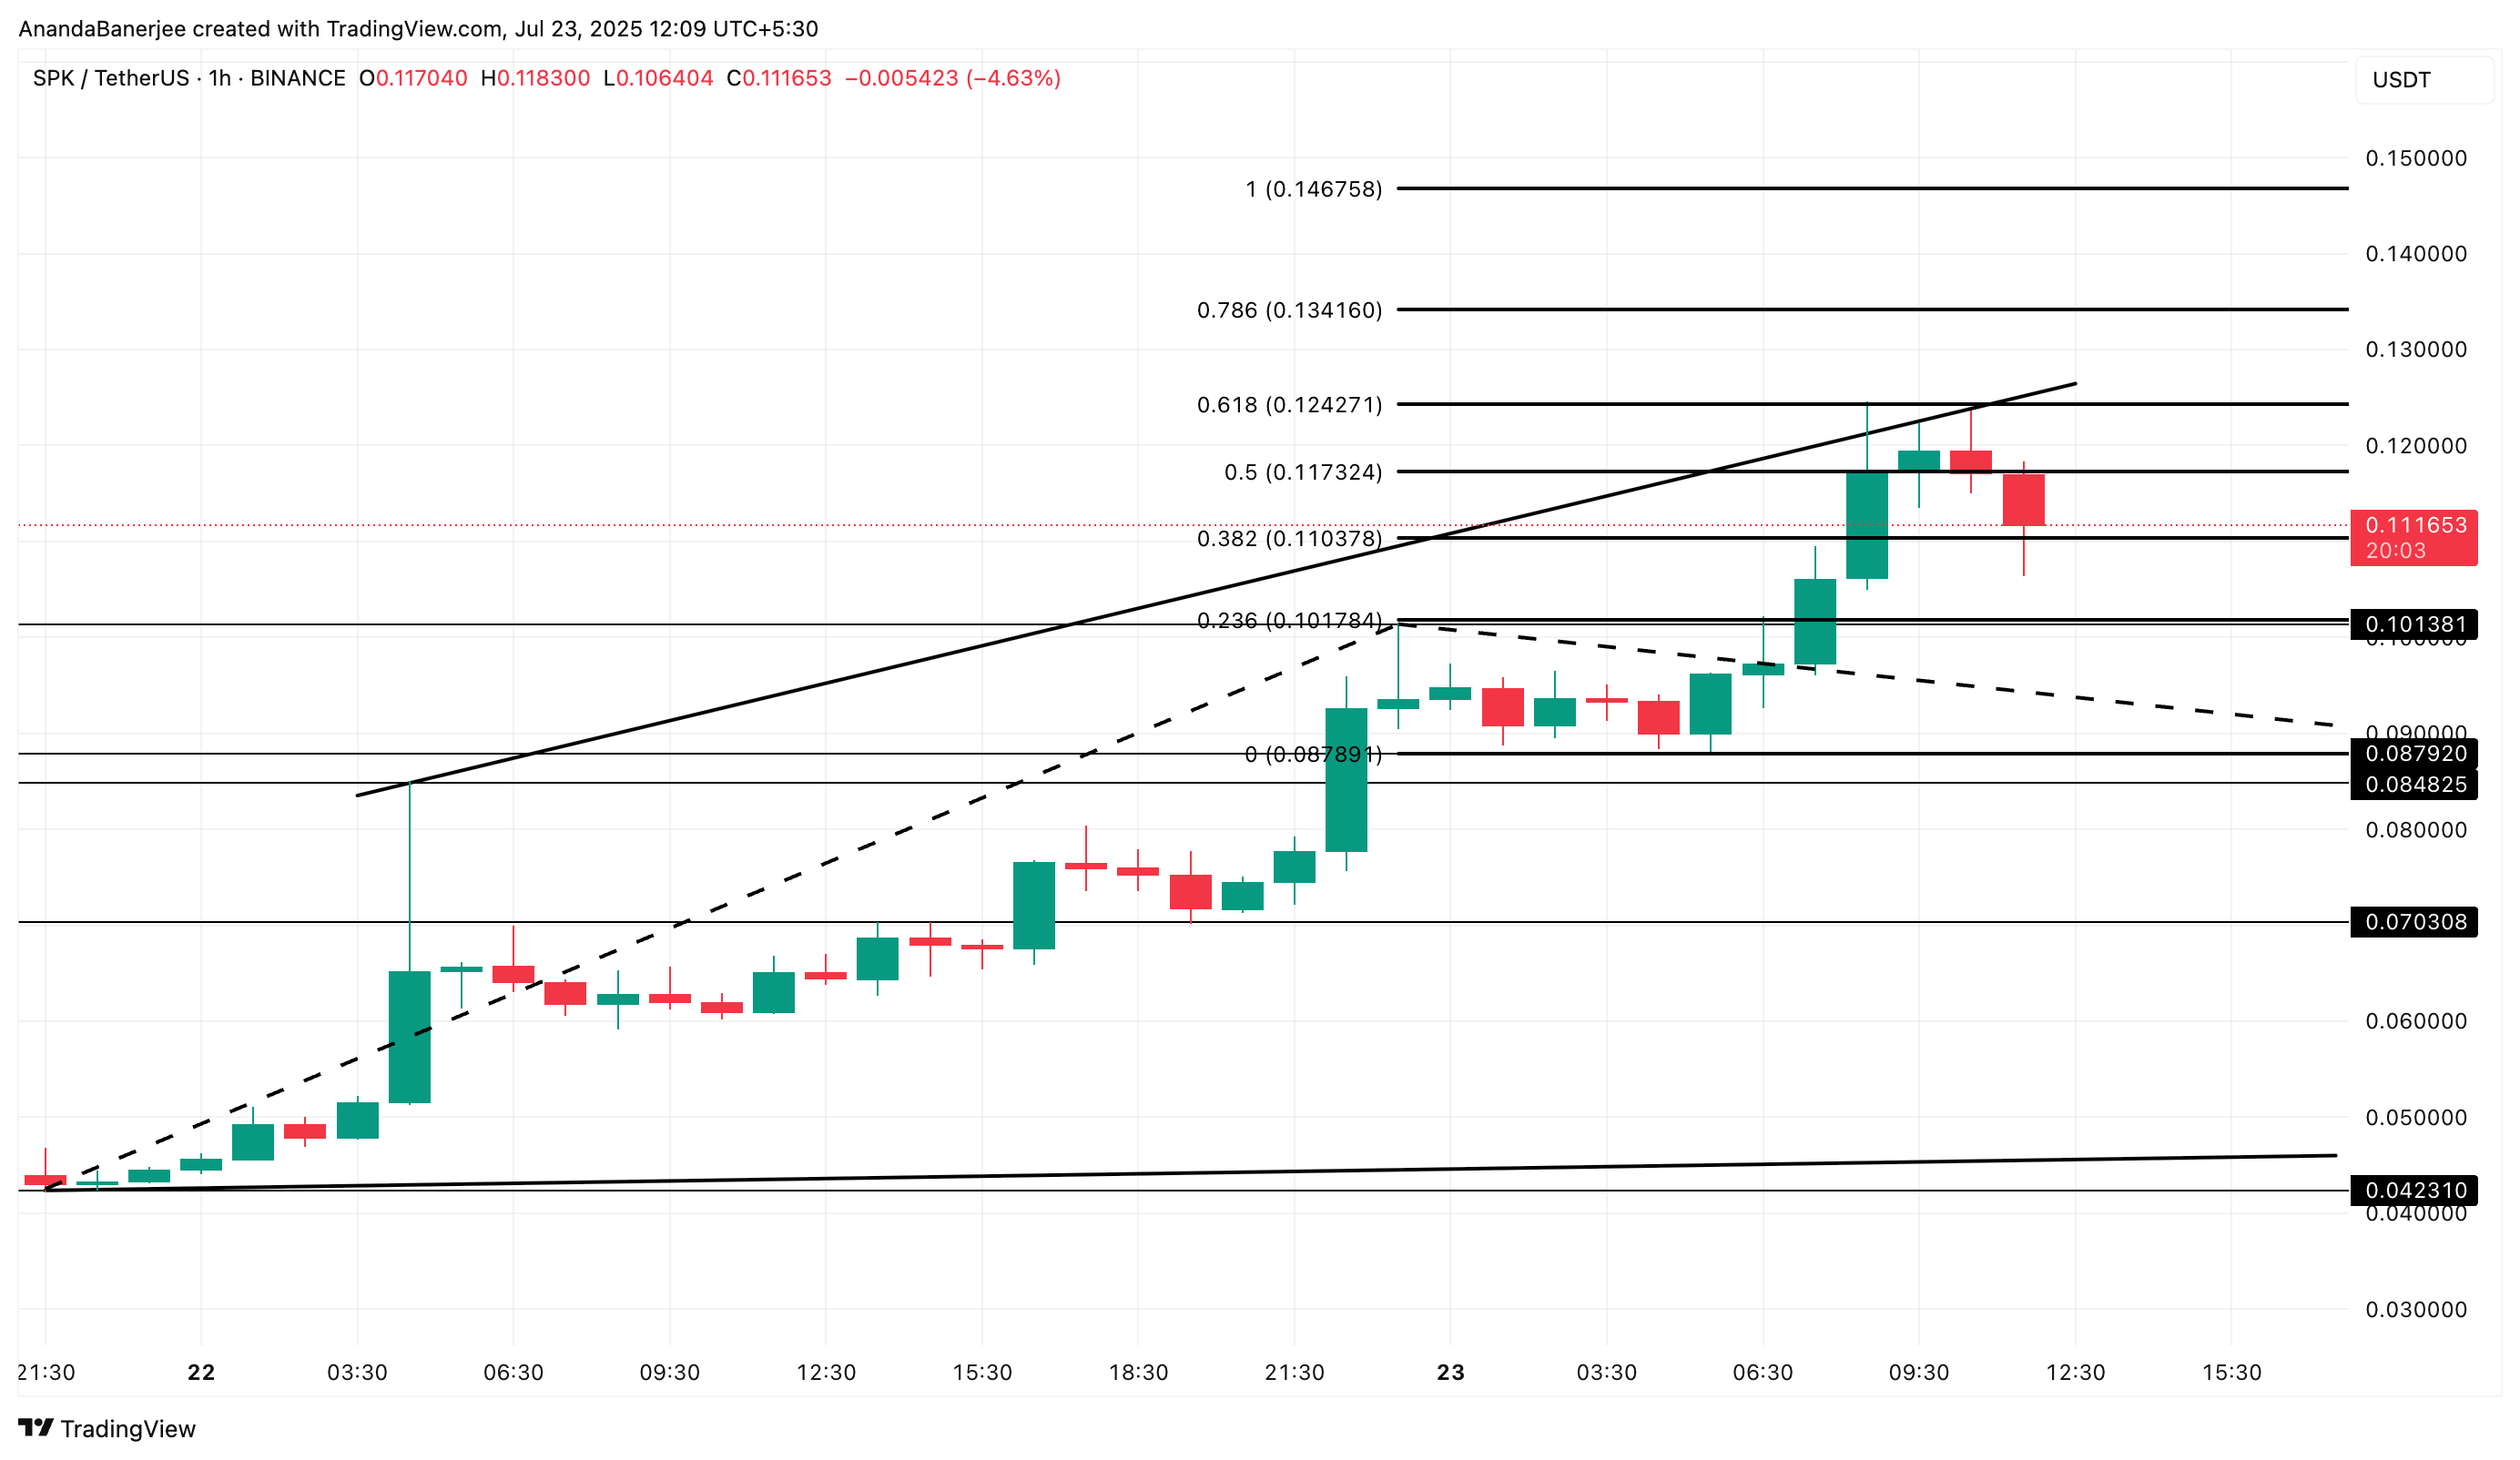
To continue its upward momentum, PENGU needs to secure solid investor support. If the altcoin can maintain this buying pressure, it is likely to break past its ATH of $0.046 and aim for a new high, potentially reaching $0.052 or higher. The key factor for continued growth will be the market’s confidence.
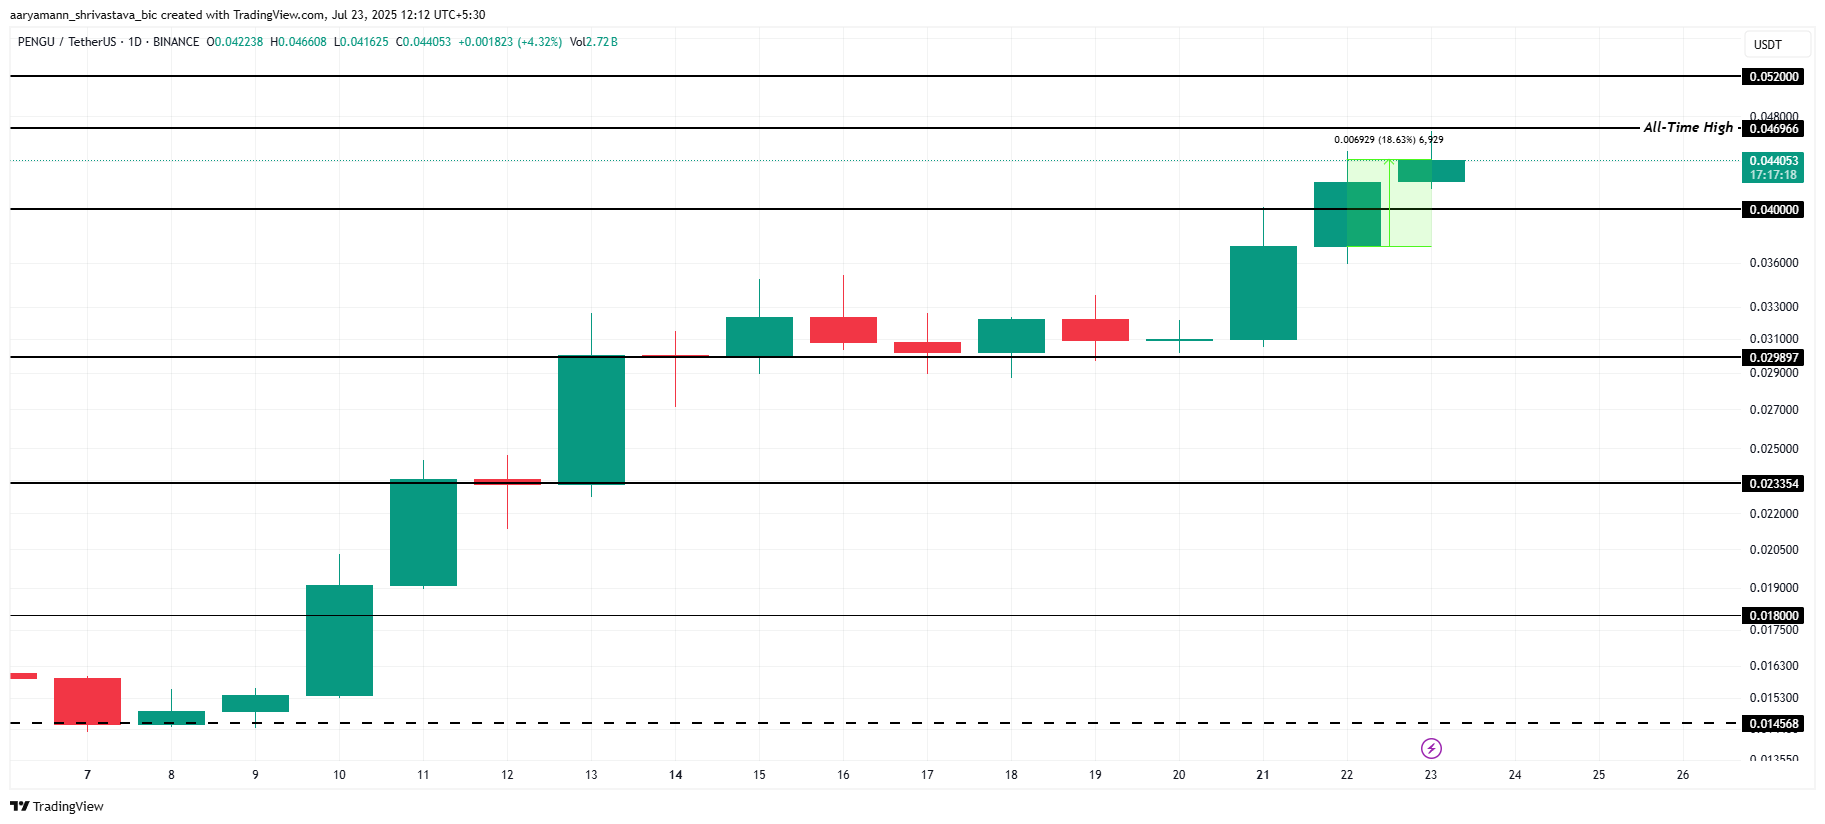
On the other hand, if the growing uncertainty and investor exits turn into a more significant trend, PENGU’s price could experience a sharp decline. A potential fall below the support level of $0.040 could lead to a drop to $0.029, signaling a complete reversal of the recent bullish trend and invalidating the optimistic outlook.
The post PENGU Price Forms New All-Time High After 6 Months Even As Skeptical Investors Exit appeared first on BeInCrypto.


 ETHWarsaw
  (@MarcinRedStone)