A massive $1.7 billion worth of ETH has been pulled from Aave over the past week. Aave community members believe Tron founder Justin Sun withdrew at least $600 million, sparking a cascade of market reactions.
The large exit led to a sharp drop in ETH liquidity on Aave.
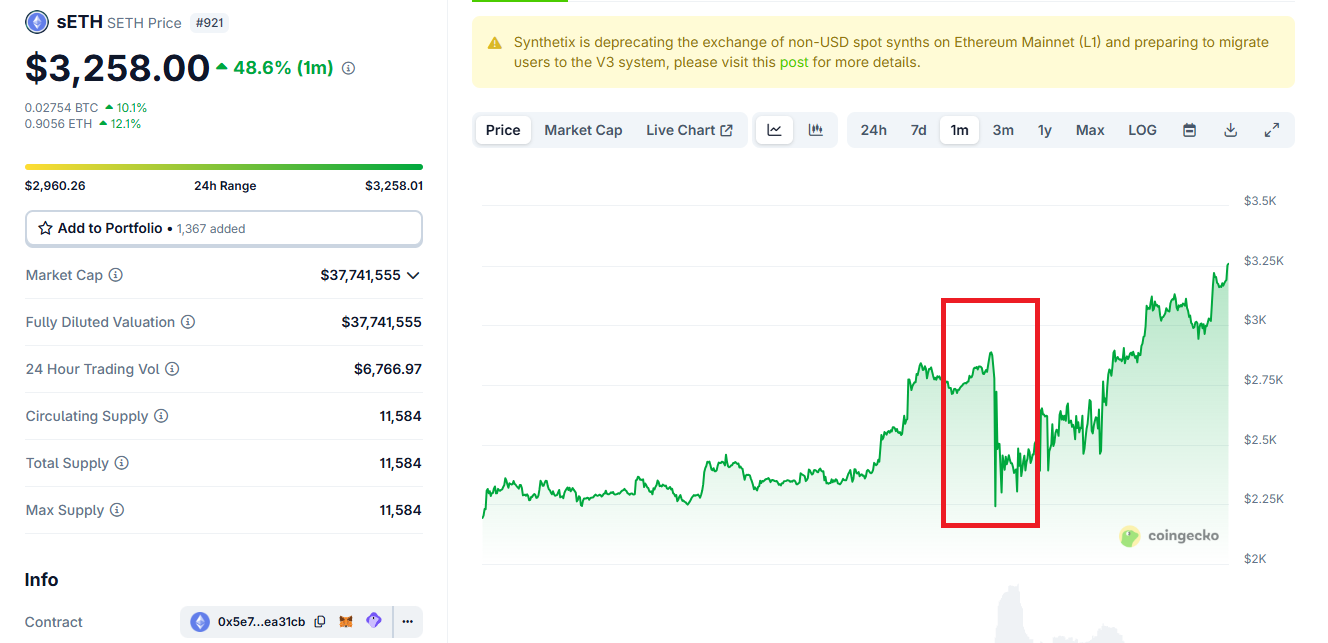
Ethereum Whale Movement Causes Sharp Drop in sETH
Continuous whale exit on Aave pushed utilization rates higher, which in turn caused ETH borrowing rates to spike.
One of the hardest-hit strategies was the popular stETH/ETH leverage loop. Charts show that sETH price dropped from $2,800 to $2,200 in a straight line on July 14.
Users typically deposit ETH, borrow against it, buy stETH, and repeat the cycle to earn staking yields. However, higher borrow rates and a weakening stETH peg made the strategy unprofitable.
As loopers began to exit, many rushed to redeem stETH for ETH. This created congestion in the staking withdrawal queue, which currently takes about 18 days to process.
To avoid the wait, some users offloaded stETH on secondary markets, causing a depeg of approximately 0.3%.
What happens when Justin Sun withdraws 600M of $ETH from Aave?
• ETH Borrow & Lend rates spike • The backbone of DeFi, LST looping, is temporarily unprofitable • The market stETH / ETH rate depegs ~0.3%
— Marcin | RedStone ETHWarsaw (@MarcinRedStone) July 23, 2025
This slight depeg poses major risks for leveraged traders. A 0.3% price gap can mean a 3% loss on 10x leverage, forcing many to take losses or wait through illiquid positions.
The situation may worsen if interest continues to accrue, potentially triggering liquidations.
Price charts reflect the stress. ETH rose over 8% in the past week to $3,593 but has since pulled back from its peak.
Meanwhile, sETH—Synthetic ETH issued by Synthetix—jumped 30.5% over the week, signaling demand for alternatives amid volatility.
Rough timeline of events here: 1. Justin Sun pulls ETH supply from Aave. 2. Utilization spikes ETH borrow rates on Aave. 3. stETH loopers are now unprofitable, so start de-leveraging. 4. A bunch of this de-levered stETH hits the staking withdrawal queue. 5. stETH depegs 30 basis…
The event highlights systemic fragility in DeFi. A single large withdrawal disrupted lending rates, broke popular strategies, and exposed reliance on oracles and delayed redemption mechanisms.
With many stETH oracles still using redemption rates, not market rates, lenders remain stuck as the peg drifts.
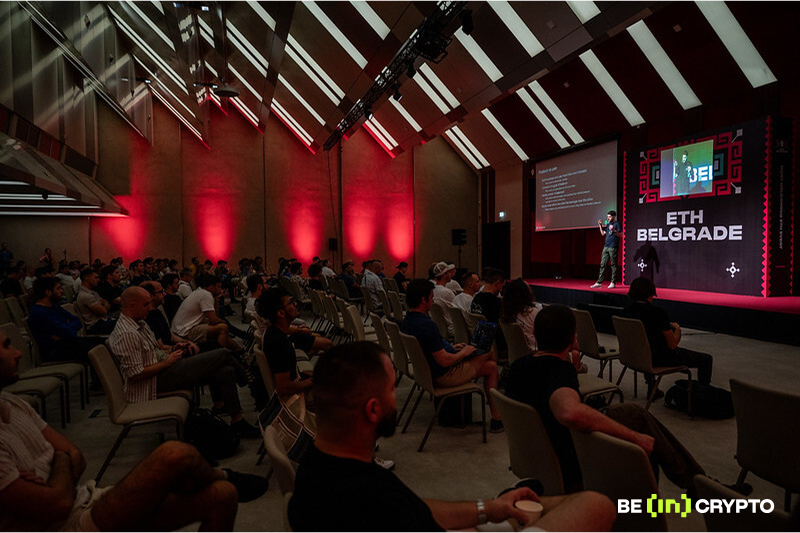
Before anything was official, before there was a venue, a name, or a date, there was just a shared sense of “we need this”. The idea for ETH Belgrade didn’t come from a funding round or a flashy vision deck. It grew out of conversations, often in hallways of other Web3 events, between people who kept running into each other across the globe. Builders from the Balkans were everywhere.
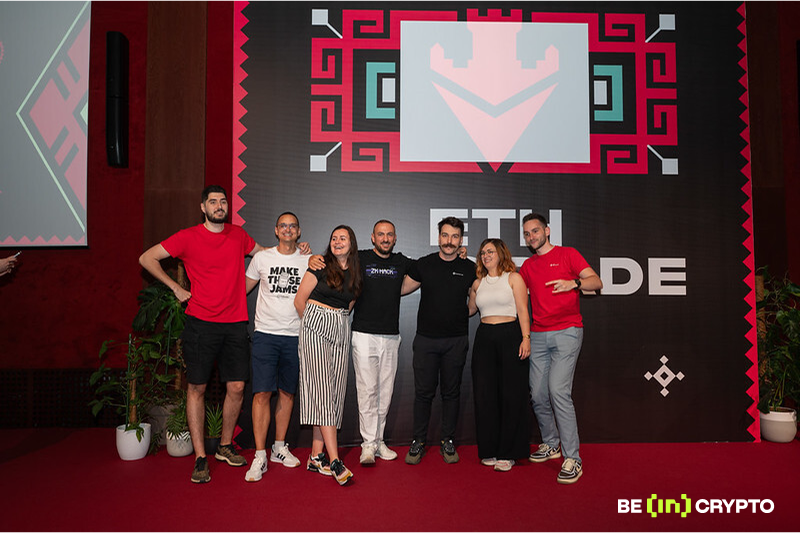
That idea was brought to life by Tanja Mladenovic and Petar Popovic, who went on to co-found ETH Belgrade and build a team around a simple mission: create an Ethereum event grounded in builder needs and community values.
From Lisbon to Belgrade: The Birth of ETH Belgrade
For Petar, the idea took root at LisCon 2021.
“The energy was unforgettable. I imagined bringing that same spark to Belgrade,” he says.
He and Tanja made it happen by June 2023. The vision was backed by data: Balkan builders were everywhere: Lisbon, Dubai, Paris.
“Serbians, Croatians, Macedonians… always present,” Petar adds. “It showed us we needed something of our own.”
Belgrade, with companies like Tenderly and DeFi Saver and over 50 startups, was the natural choice. It wasn’t just a location, but the center of regional innovation.
Builders First: ETH Belgrade’s Mission
ETH Belgrade was never about the flash. It was about utility.
“There’s often a gap between infrastructure and real-world use cases,” says Petar.
The team set out to close it. Talks extended beyond code, covering product design, regulation, and GTM strategies. The ETH Belgrade Ventures track supported founders with pitch sessions and free booths.
And the commitment didn’t stop at the Balkans: the team flew in hackers from ETH Global Prague, launched “Road to Devcon” meetups in Africa and Southeast Asia, and seeded global community hubs.
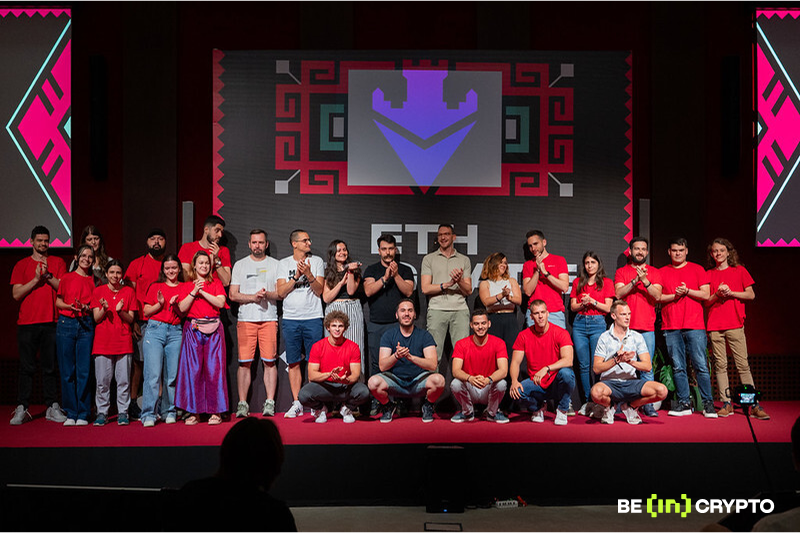
Beyond an Event: A Living Ecosystem
ETH Belgrade has grown into an ecosystem: local at its roots, but global in its reach.
“This isn’t just a conference,” Tanja says. “We do coworking days, bootcamps, meetups. We’ve advised ETH event teams, sponsored ETH Safari and ETH Rwanda. It’s bigger than us.”
Culture vs. Code: Where Ethereum Is Headed
Ethereum’s technical roadmap is well-documented. Its cultural future is less clear.
“There’s no roadmap for culture,” says Petar. “We’re seeing shifts in leadership, tone, and community priorities. That’ll define the next 12–18 months more than code.”
Making It Feel Like Home
ETH Belgrade is known for its hospitality, something deeply intentional.
“It’s not just us – it’s the whole community acting like hosts,” says Tanja.
Locals help guests, share tips, and make connections. Internally, small rituals keep the chaos in check.
“I always have my essentials pouch, and take 15 minutes of quiet each day,” Tanja shares.
Quality First, Always
Applications go through a strict review process led by Nikola Vukovic (DeFi Saver) and Natasa Bujosevic. The focus is quality, not fame.
“No one can buy a speaking slot,” says Petar.
Side events, however, are open-source: anyone can host one. Even logistical setbacks have become learning moments.
“Once we ended up setting hackathon tables at 4 a.m. because of miscommunication,” Tanja laughs. “Now, we overcommunicate and document everything.”
Legal Safeguards: Starting with Structure
Ilija Rilakovic, who oversees legal matters for ETH Belgrade, emphasizes one thing above all: start early.
“Most legal challenges can be avoided with clear contracts and proper planning,” he says.
That includes agreements with venues, sponsors, and service providers, covering everything from payment terms to cancellation policies.
Ilija also monitors regulatory frameworks, particularly in the EU.
“For certain markets, such as the EU, due to MiCA regulation, non-EU projects may face restrictions on promoting their services unless specifically invited; a concept known as reverse solicitation. This means that you, as a non-EU project, may not actively advertise or solicit EU customers if the services you’re offering fall under MiCA and require a license,” he explains.
While Serbia currently allows more flexibility, understanding these distinctions is critical when organizing an international event.
Hackathons add another layer of complexity. Ilija recommends clear terms for both participants and sponsors, especially to mitigate intellectual property risks.
“As an organizer, you want to avoid being liable for anything created during the hackathon, particularly the functionality and transferability of the product,” he notes.
From website policies to partnership contracts, the goal is to reduce ambiguity and protect all parties involved, ultimately creating a secure and professional environment for innovation.
Advice to Future Organizers
The team’s advice is clear:
Start with local energy and a few strong builders
Build a team you trust to stay calm when things go off-script
Focus on what adds value: meaningful content, real connections, and a sustainable community
Conclusion
ETH Belgrade wasn’t built overnight. It grew from shared belief, trust, and relentless community focus. While the team is made up of many contributors, from Nikola’s strategic input to Aljosa’s operational coordination, it’s the synergy between them and the broader Balkan Web3 scene that powers ETH Belgrade.
It’s not just an event. It’s a reflection of what Ethereum can become when people, not hype, are at the core.
Hedera Hashgraph is set to implement a mainnet upgrade later today. However, despite the anticipated network improvement, its native token HBAR is already showing signs of fatigue.
HBAR’s price action has cooled off over the past three days, indicating a period of stagnation. With buying pressure starting to drop, the altcoin eyes a pullback over the next few trading sessions.
HBAR Rally Falters as Traders Lose Confidence
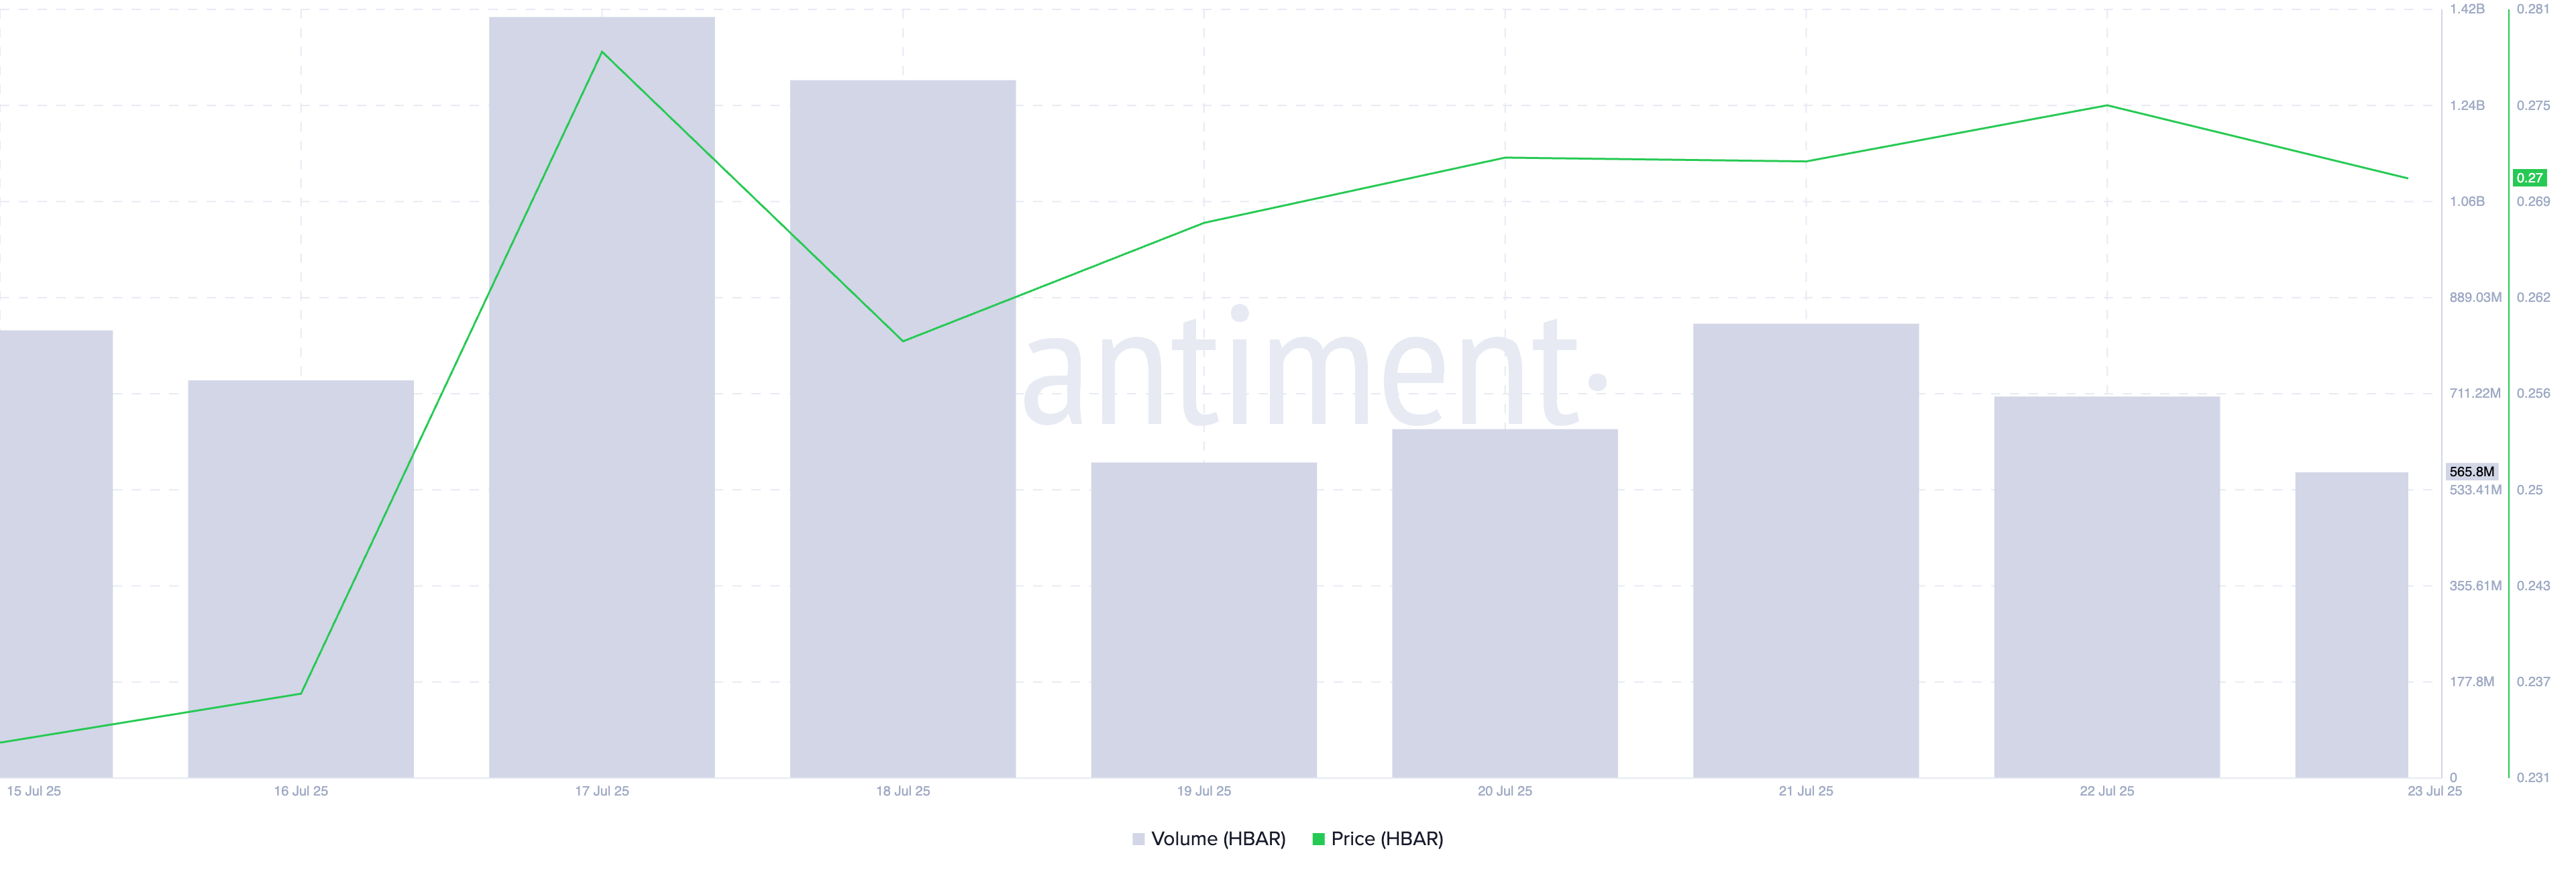
Readings from the HBAR/USD one-day chart show that the altcoin posted significant gains between July 9 and July 20. During that period, HBAR’s value rocketed by 59%.
However, over the past three days, this bullish momentum has stalled. While the token has recorded a modest 2% spike in price over the past 24 hours, it is accompanied by a 34% decline in trading volume.
For token TA and market updates: Want more token insights like this? Sign up for Editor Harsh Notariya’s Daily Crypto Newsletter here.
HBAR Price and Trading Volume. Source: TradingView
When an asset’s price climbs while trading volume falls, it suggests weakening conviction behind the move, as fewer participants are driving the price higher. This negative divergence signals that HBAR’s rally over the past day merely mirrors the broader market growth and may not be sustainable in the short term.
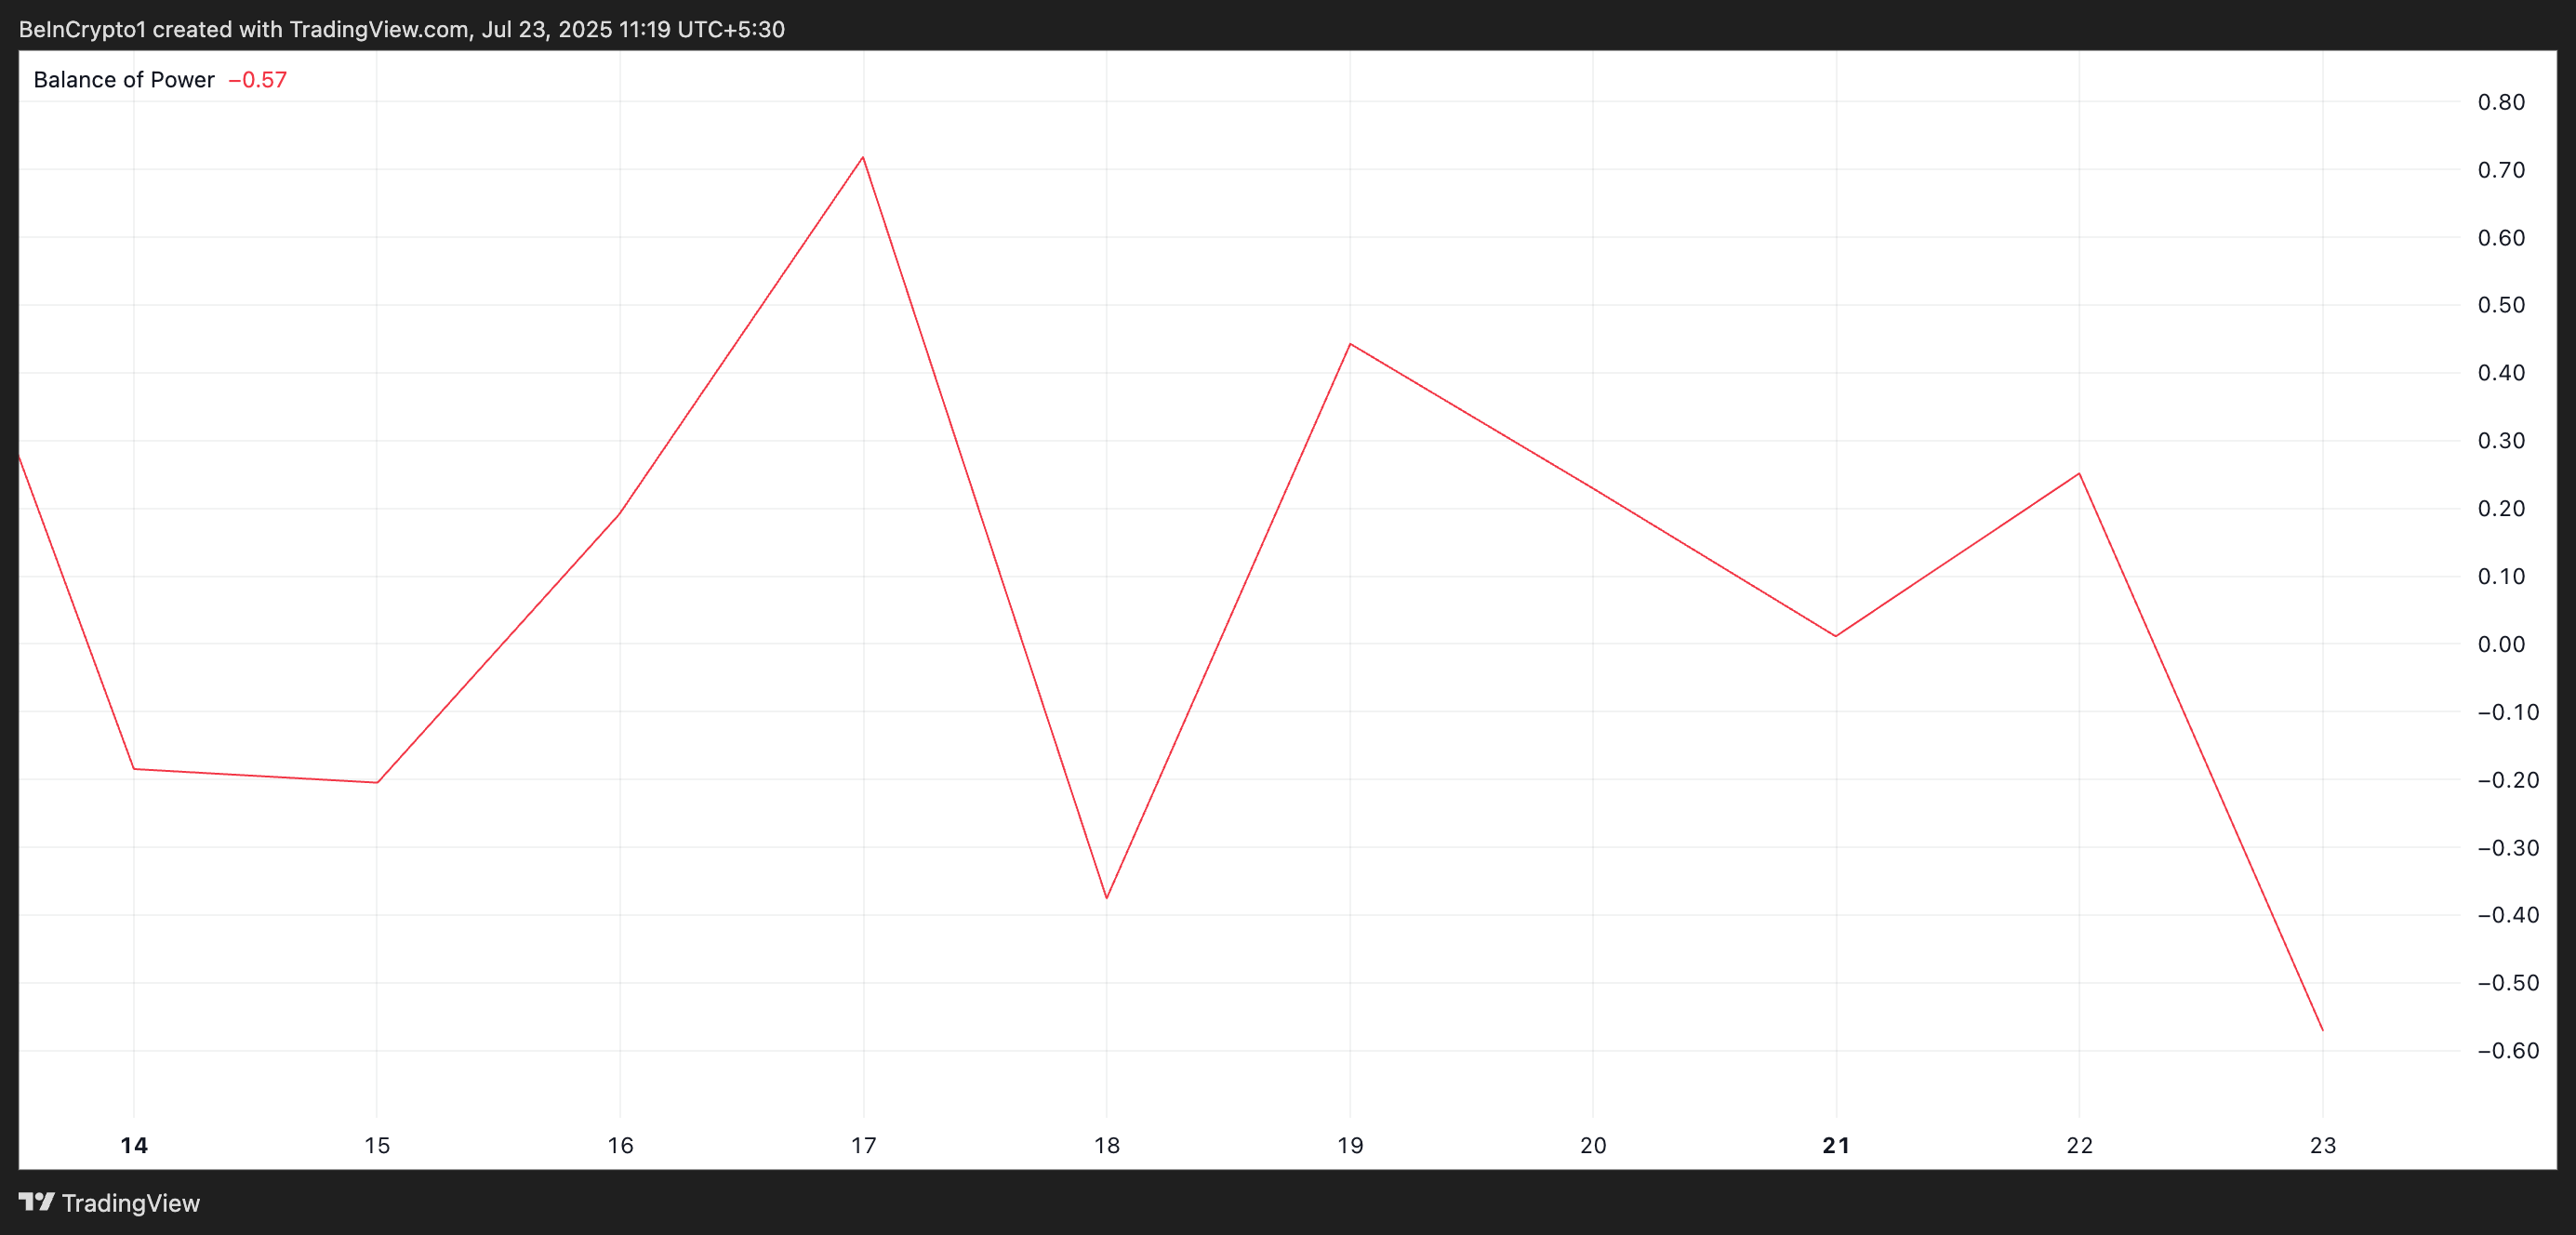
Moreover, HBAR’s Balance of Power (BoP) indicator has flipped negative, confirming the waning demand and negative shift in trader sentiment. As of this writing, this momentum indicator stands at -0.57.
The BoP indicator measures the strength of buyers versus sellers in the market, helping to identify momentum shifts. When its value is negative, sellers dominate the market over buyers and put downward pressure on the price.
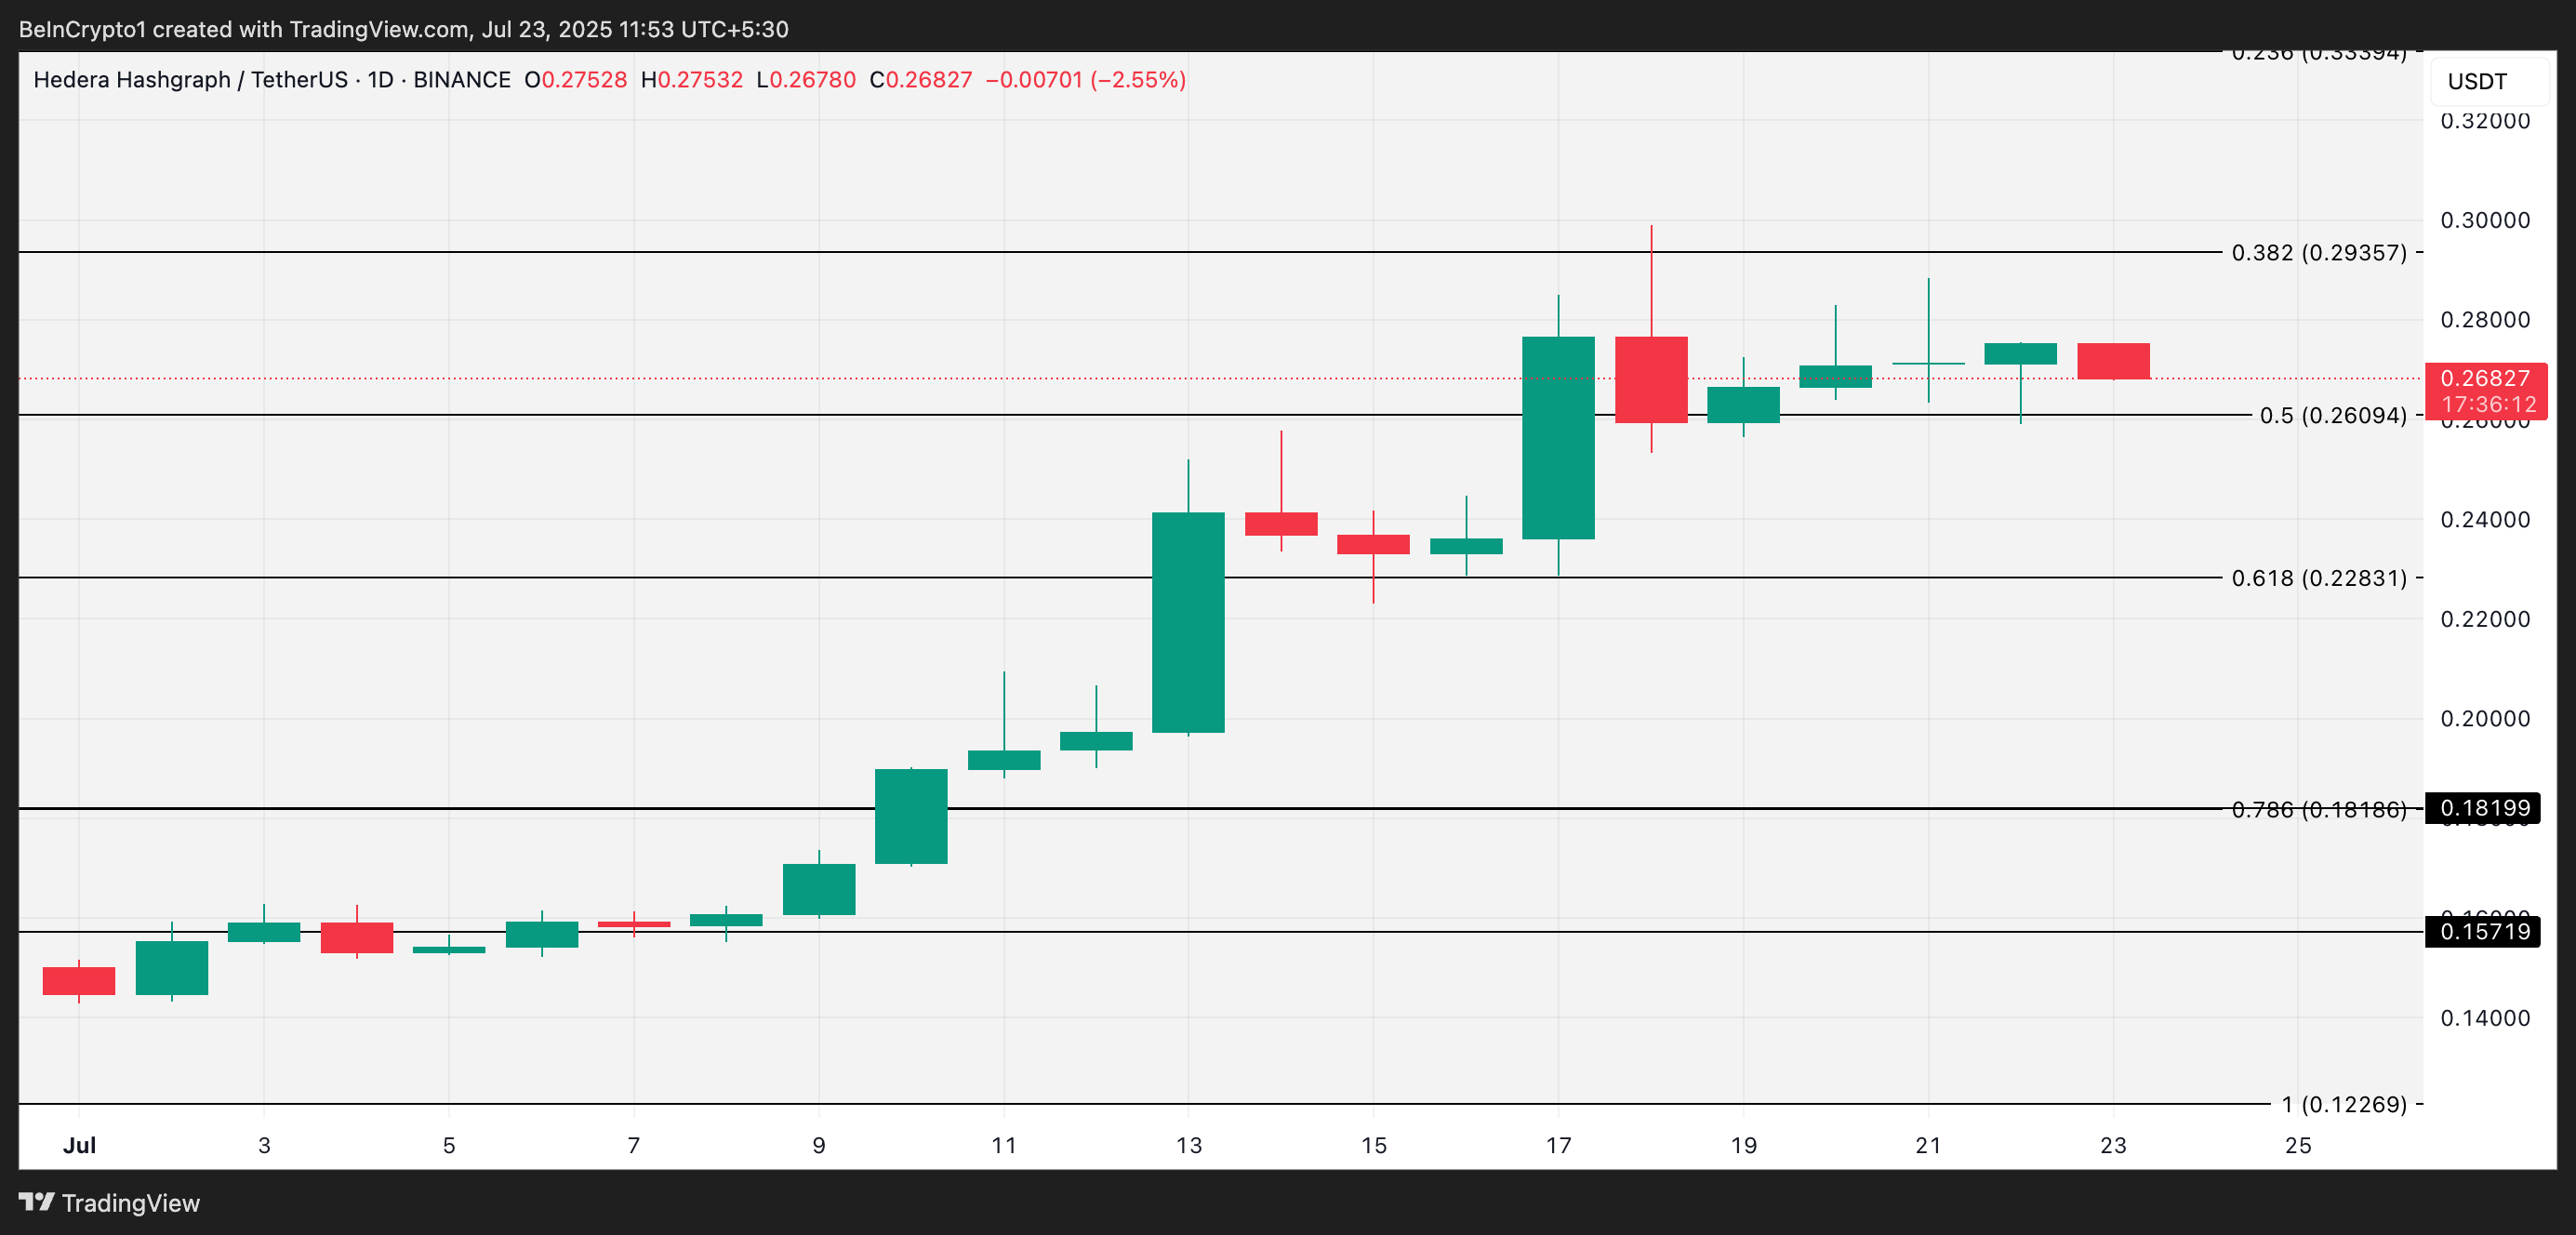
Can the Upgrade Save HBAR From Sliding Below $0.26?
As the market prepares for the mainnet upgrade, attention will turn to whether the network improvements can boost HBAR’s price action or if the market has already priced in the news. If this is the case and demand remains muted post-upgrade, HBAR’s price could break below $0.26 and fall to $0.22.
With over 861 million users globally, the crypto industry is entering a new phase: adoption at scale. In this context, MERGE Madrid 2025, held at the iconic Palacio de Cibeles from October 7–9, positions itself as a must-attend event to understand, anticipate, and lead the future of digital finance and blockchain technology.
In its third edition, MERGE will welcome over 3,000 attendees, 500 international organizations, and more than 200 high-profile speakers, ranging from central banks and financial institutions to leading blockchain protocols, emerging startups, and global corporations already leveraging Web3 as a strategic innovation driver.
Will Spanish Banks Launch Their Own Stablecoins?
Stablecoins are emerging as blockchain’s true killer app, creating real utility even for non-crypto-native users. In France and Germany, Société Générale and Deutsche Bank have already launched corporate stablecoin projects. In the U.S., banking consortia are discussing joint stablecoin initiatives to enhance efficiency and scalability.
MERGE Madrid 2025 will be the ideal stage to analyze and debate these developments, bringing together traditional finance and native Web3 ecosystems. Confirmed participants include Santander, BBVA, BNP Paribas, TowerBank, Wenia (Bancolombia) and many others.
A Full Week of Vision, Tech, and Web3 Culture
This year, MERGE Madrid expands into a multi-layered experience, built around a weeklong program connecting every part of the ecosystem.
October 7: Private roundtables with regulators at MERGE Institutional, followed by a VIP Cocktail.
October 8–9: The main conference, the heart of the event, will explore business strategies, global regulation, digital finance, immersive art, cultural experiences, and Web3 adoption frameworks.
October 10: MERGE Tech Summit, a full day of developer bootcamps, workshops, and technical sessions.
October 11–12: The weekend Hackathon, where innovation comes to life.
This structure ensures representation from decision-makers and regulators to the developers building the future from code. MERGE transforms Madrid into a real bridge between institutional, technical, and creative worlds, shaping the future of the token economy.
The Bridge Between Latin America and Europe
MERGE Madrid strengthens its role as a strategic connection point between Europe and Latin America, uniting institutions, governments, and businesses from both regions around Web3 innovation.
Previous editions have welcomed institutions like the Central Bank of Brazil, Argentina’s Central Bank, Argentina’s National Securities Commission, El Salvador’s Digital Assets Commission, the European Banking Authority, and governments from Madrid and Buenos Aires, many of whom are returning in 2025.
This transatlantic connection takes on special significance as MERGE coincides with Hispanic Heritage Week, positioning Madrid as a capital of Ibero-American collaboration in decentralized economics.
A World-Class Speaker Lineup
MERGE is growing in every direction – and its speaker agenda is no exception. The 2025 edition features over 200 top experts and international C-level leaders, curated to provide a 360° view of the Web3 ecosystem:
Traditional financial institutions: Key figures include Coty de Monteverde (Banco Santander), Francisco Maroto (BBVA), David Cunningham (Citi), Gabriel Campa (TowerBank), and Pablo Arboleda Niño (Bancolombia) — all leaders in institutional investment and crypto asset adoption.
Native Web3 projects: Influential voices such as Staci Warden (CEO at Algorand Foundation), Cassie Craddock (Managing Director UK & Europe at Ripple), Robby Yung (CEO at Animoca Brands), Eric Piscini (CEO at Hashgraph), Charles d’Haussy (CEO at dYdX Foundation), and Robert Drost (CEO at Eigen Foundation) will be present, driving infrastructure, DeFi, and the convergence of AI and Web3.
Major corporations and fintech: The program includes executives such as Damu Winston (Global Head of Web3 Innovation at Amazon), Esteban Sadurni (Director of Digital Assets and Blockchain at Checkout.com), Michael Higgins (International CEO at Hidden Road), Dotun Rominiyi (Technology Leader at London Stock Exchange Group), and Jaime de Mora (CTO for Startups & Unicorns at Microsoft EMEA), showcasing the strategic and technical role of digital transformation.
Top-Tier Industry Support
Great events attract great partners. This year, MERGE is backed by leading organizations such as: BingX, Bit2Me, Ripple, ATH21, Boerse Stuttgart Digital, ikigii by Towerbank, Arbitrum, Asensi Abogados, Avenia, BSV Blockchain, Chainlink, CryptoMKT, EigenLayer, Finreg360, Lace, Notabene, Parfin, Stakely, Taurus, TRM Labs, and WOW!?
Welcome to the US Crypto News Morning Briefing—your essential rundown of the most important developments in crypto for the day ahead.
Grab a coffee to read how corporate players are rewriting the Bitcoin (BTC) playbook in real time. As traditional finance (TradFi) norms unravel, bold strategies are emerging to reshape corporate balance sheets and redefine what it means to go all in on digital assets, regardless of risk or reward.
Crypto News of the Day: Strategy Rips Up Rulebook on Path to 1 Million Bitcoin, Says Max Keiser
Strategy, now MicroStrategy, recently revealed a new offering called STRC, or “Stretch.” Marketed as a perpetual preferred stock with an initial 9% dividend, the product is explicitly designed to support the company’s goal of accumulating more Bitcoin.
Michael Saylor, executive chairman of Strategy, announced the IPO via X (Twitter), calling it a new lever for Bitcoin accumulation.
Strategy’s post echoed the same language, reaffirming that net proceeds will go toward general corporate purposes, including acquiring Bitcoin.
That mission, however, was punctuated more dramatically in an exclusive comment to BeInCrypto by Bitcoin evangelist Max Keiser.
“Strategy is committed to 1 million Bitcoin by any means necessary. They’re tearing up the corporate finance rule book and charging hell-bent for leather to the 1 million Bitcoin promised land,” Keiser told BeInCrypto.
Morgan Stanley, Barclays, Moelis & Co., and TD Securities are joint bookrunners, signaling strong institutional coordination.
However, Keiser’s comment cuts through the finance speak, articulating that MicroStrategy does not want more Bitcoin. Rather, it wants all the Bitcoin.
This aggressive tone is consistent with Strategy’s decade-long shift from an enterprise software firm to a Bitcoin holding company.
Meanwhile, even as the firm progressively pivots to BTC, analysts say the firm could trigger a Bitcoin cascade worse than Mt. Gox or Three Arrows Capital.
MARA Raises $850 Million to Double Down on Bitcoin
MARA Holdings, the world’s largest public Bitcoin miner, is joining the Bitcoin accumulation wave. The firm revealed a $850 million private offering of convertible senior notes due in 2032.
MARA Holdings, the world’s largest public bitcoin miner, raises $850 million to continue buying bitcoin. MARA Holdings currently holds more than 50k BTC. pic.twitter.com/ZxeujEwGFk
The move signals continued strategic conviction in Bitcoin as a treasury reserve and a core asset in the company’s business model. The offering consists of 0.00% convertible senior notes, with an option for initial purchasers to buy an additional $150 million.
Redemption terms kick in from January 2030, and the company has embedded multiple mechanisms to manage dilution.
MARA intends to use the bulk of the proceeds to buy additional Bitcoin and fund general corporate purposes. This raise highlights MARA’s role as a miner and digital asset treasury operator.
Like Strategy, MARA is positioning itself to amass more Bitcoin while fortifying its balance sheet against future market disruptions.
$BTC is up by $11.4K since Q3 started which means that $MARA is already sitting on over $573 Million Quarterly Net Profit
Bitcoin increased by $24.6K in Q2 which will result in nearly $1.2 Billion in FASB GAAP Net Profit when MARA reports earnings on July 29 @ 5pm
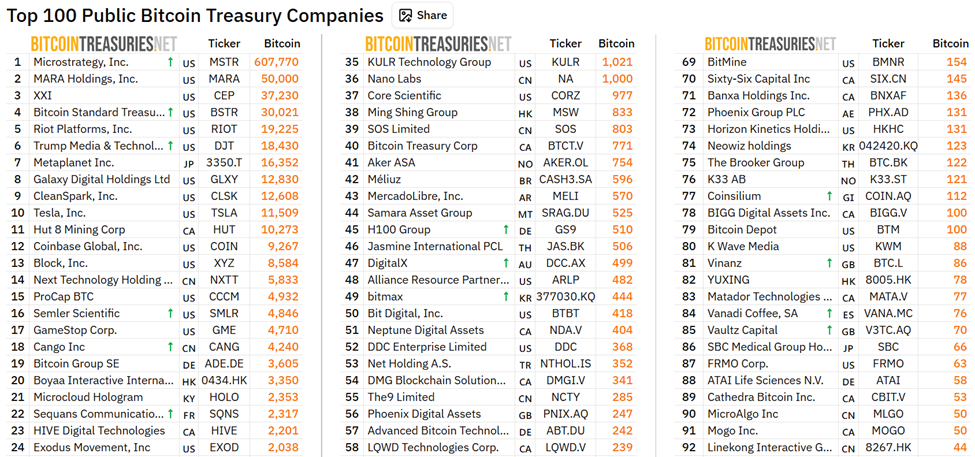
Spark (SPK) price just ripped over 90% in a day and printed a new all‑time high at $0.121 on July 23. The Ignition airdrop buzz is still lifting sentiment, but the short‑term charts are asking for one more clean push before price can extend.
The focus now is on whether supply is coming back to exchanges, whether momentum can actually beat its last peak, and where the next support will be. This matters for anyone tracking Spark Price action or the broader Spark Token narrative.
Exchange Inflows Say Profit‑Taking Risk Is Real
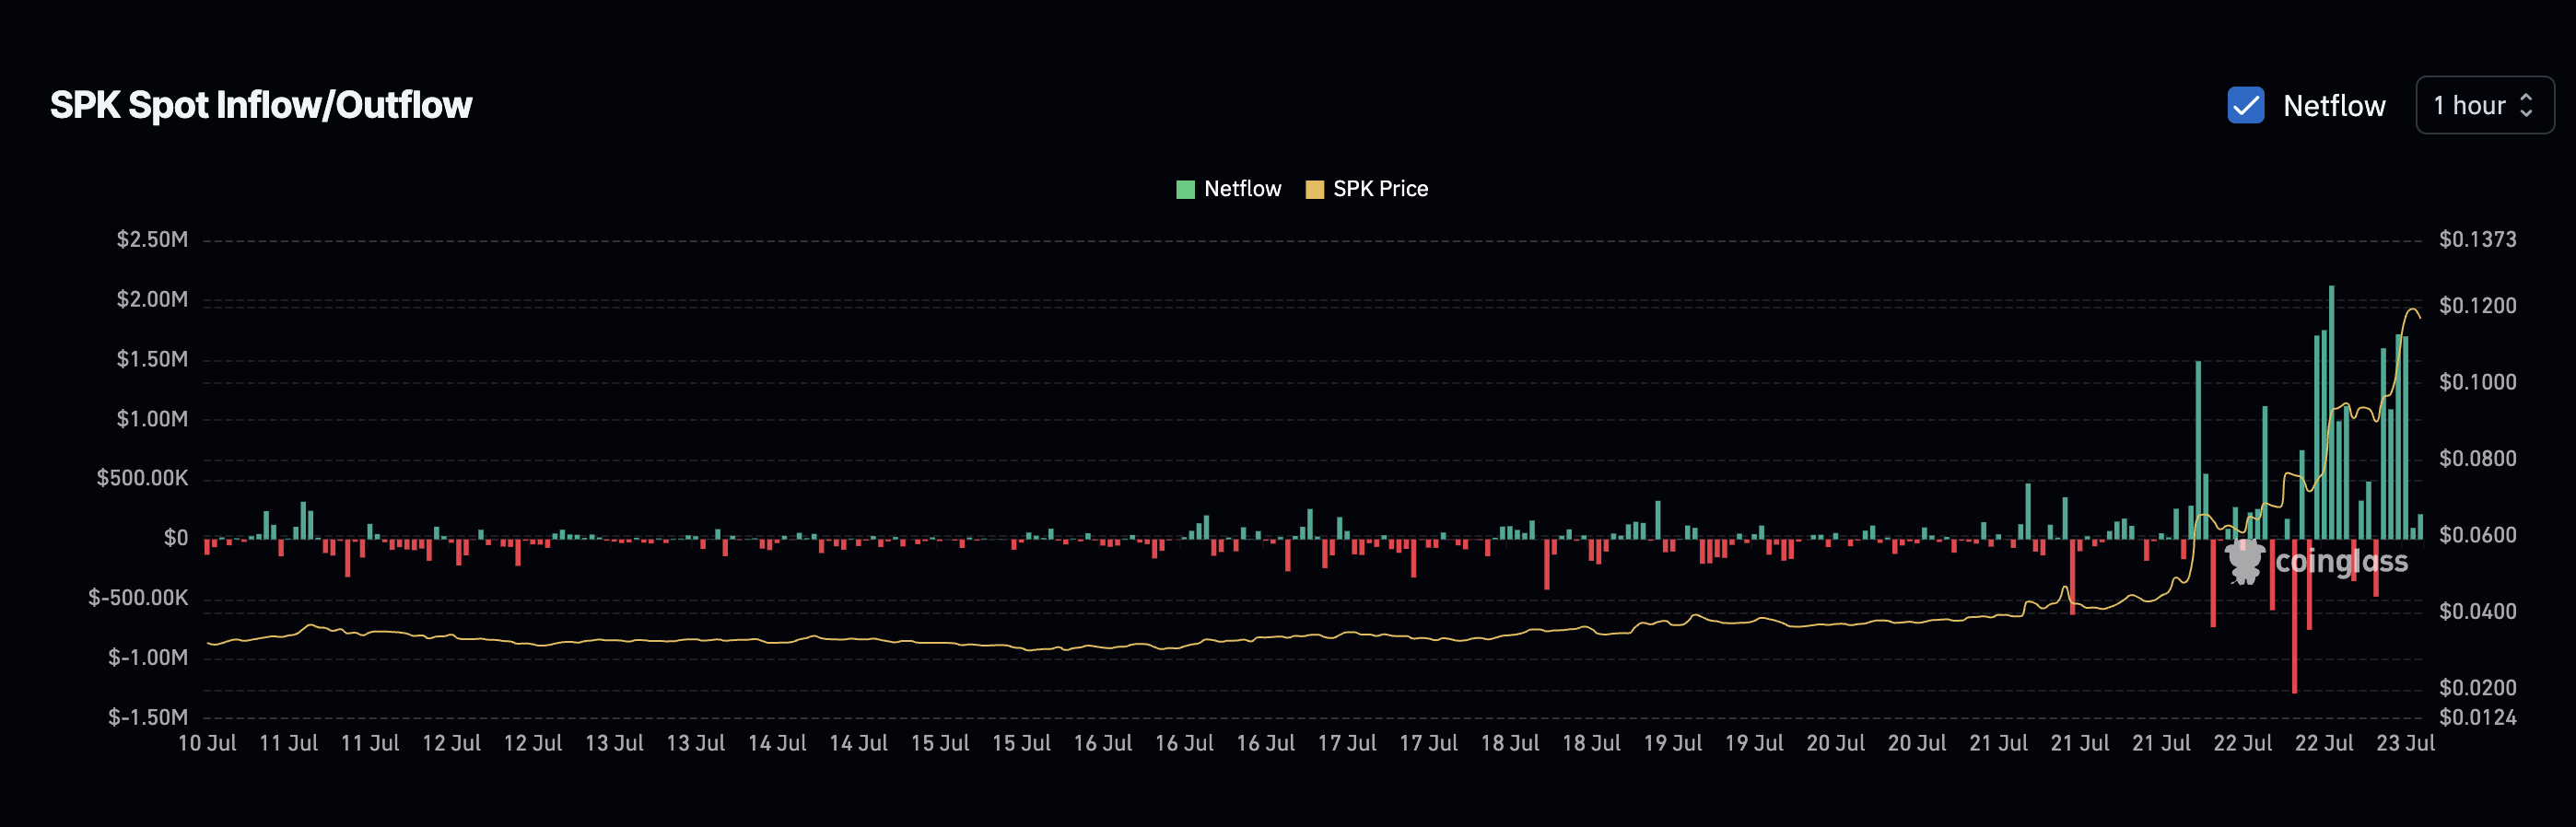
When a token nearly doubles in 24 hours, the first question is: Are holders starting to send coins to exchanges to sell? That is why the hourly netflow chart matters here.
SPK netflows have stayed positive through the run, which means deposits are still outpacing withdrawals while price is elevated.
Prices have already slipped a bit, so if inflows keep building, those extra coins on exchanges can become sell orders fast.
Netflow simply tracks tokens moving in or out; persistent inflows while price stalls usually hint that a pullback is on deck, even inside a bullish trend.
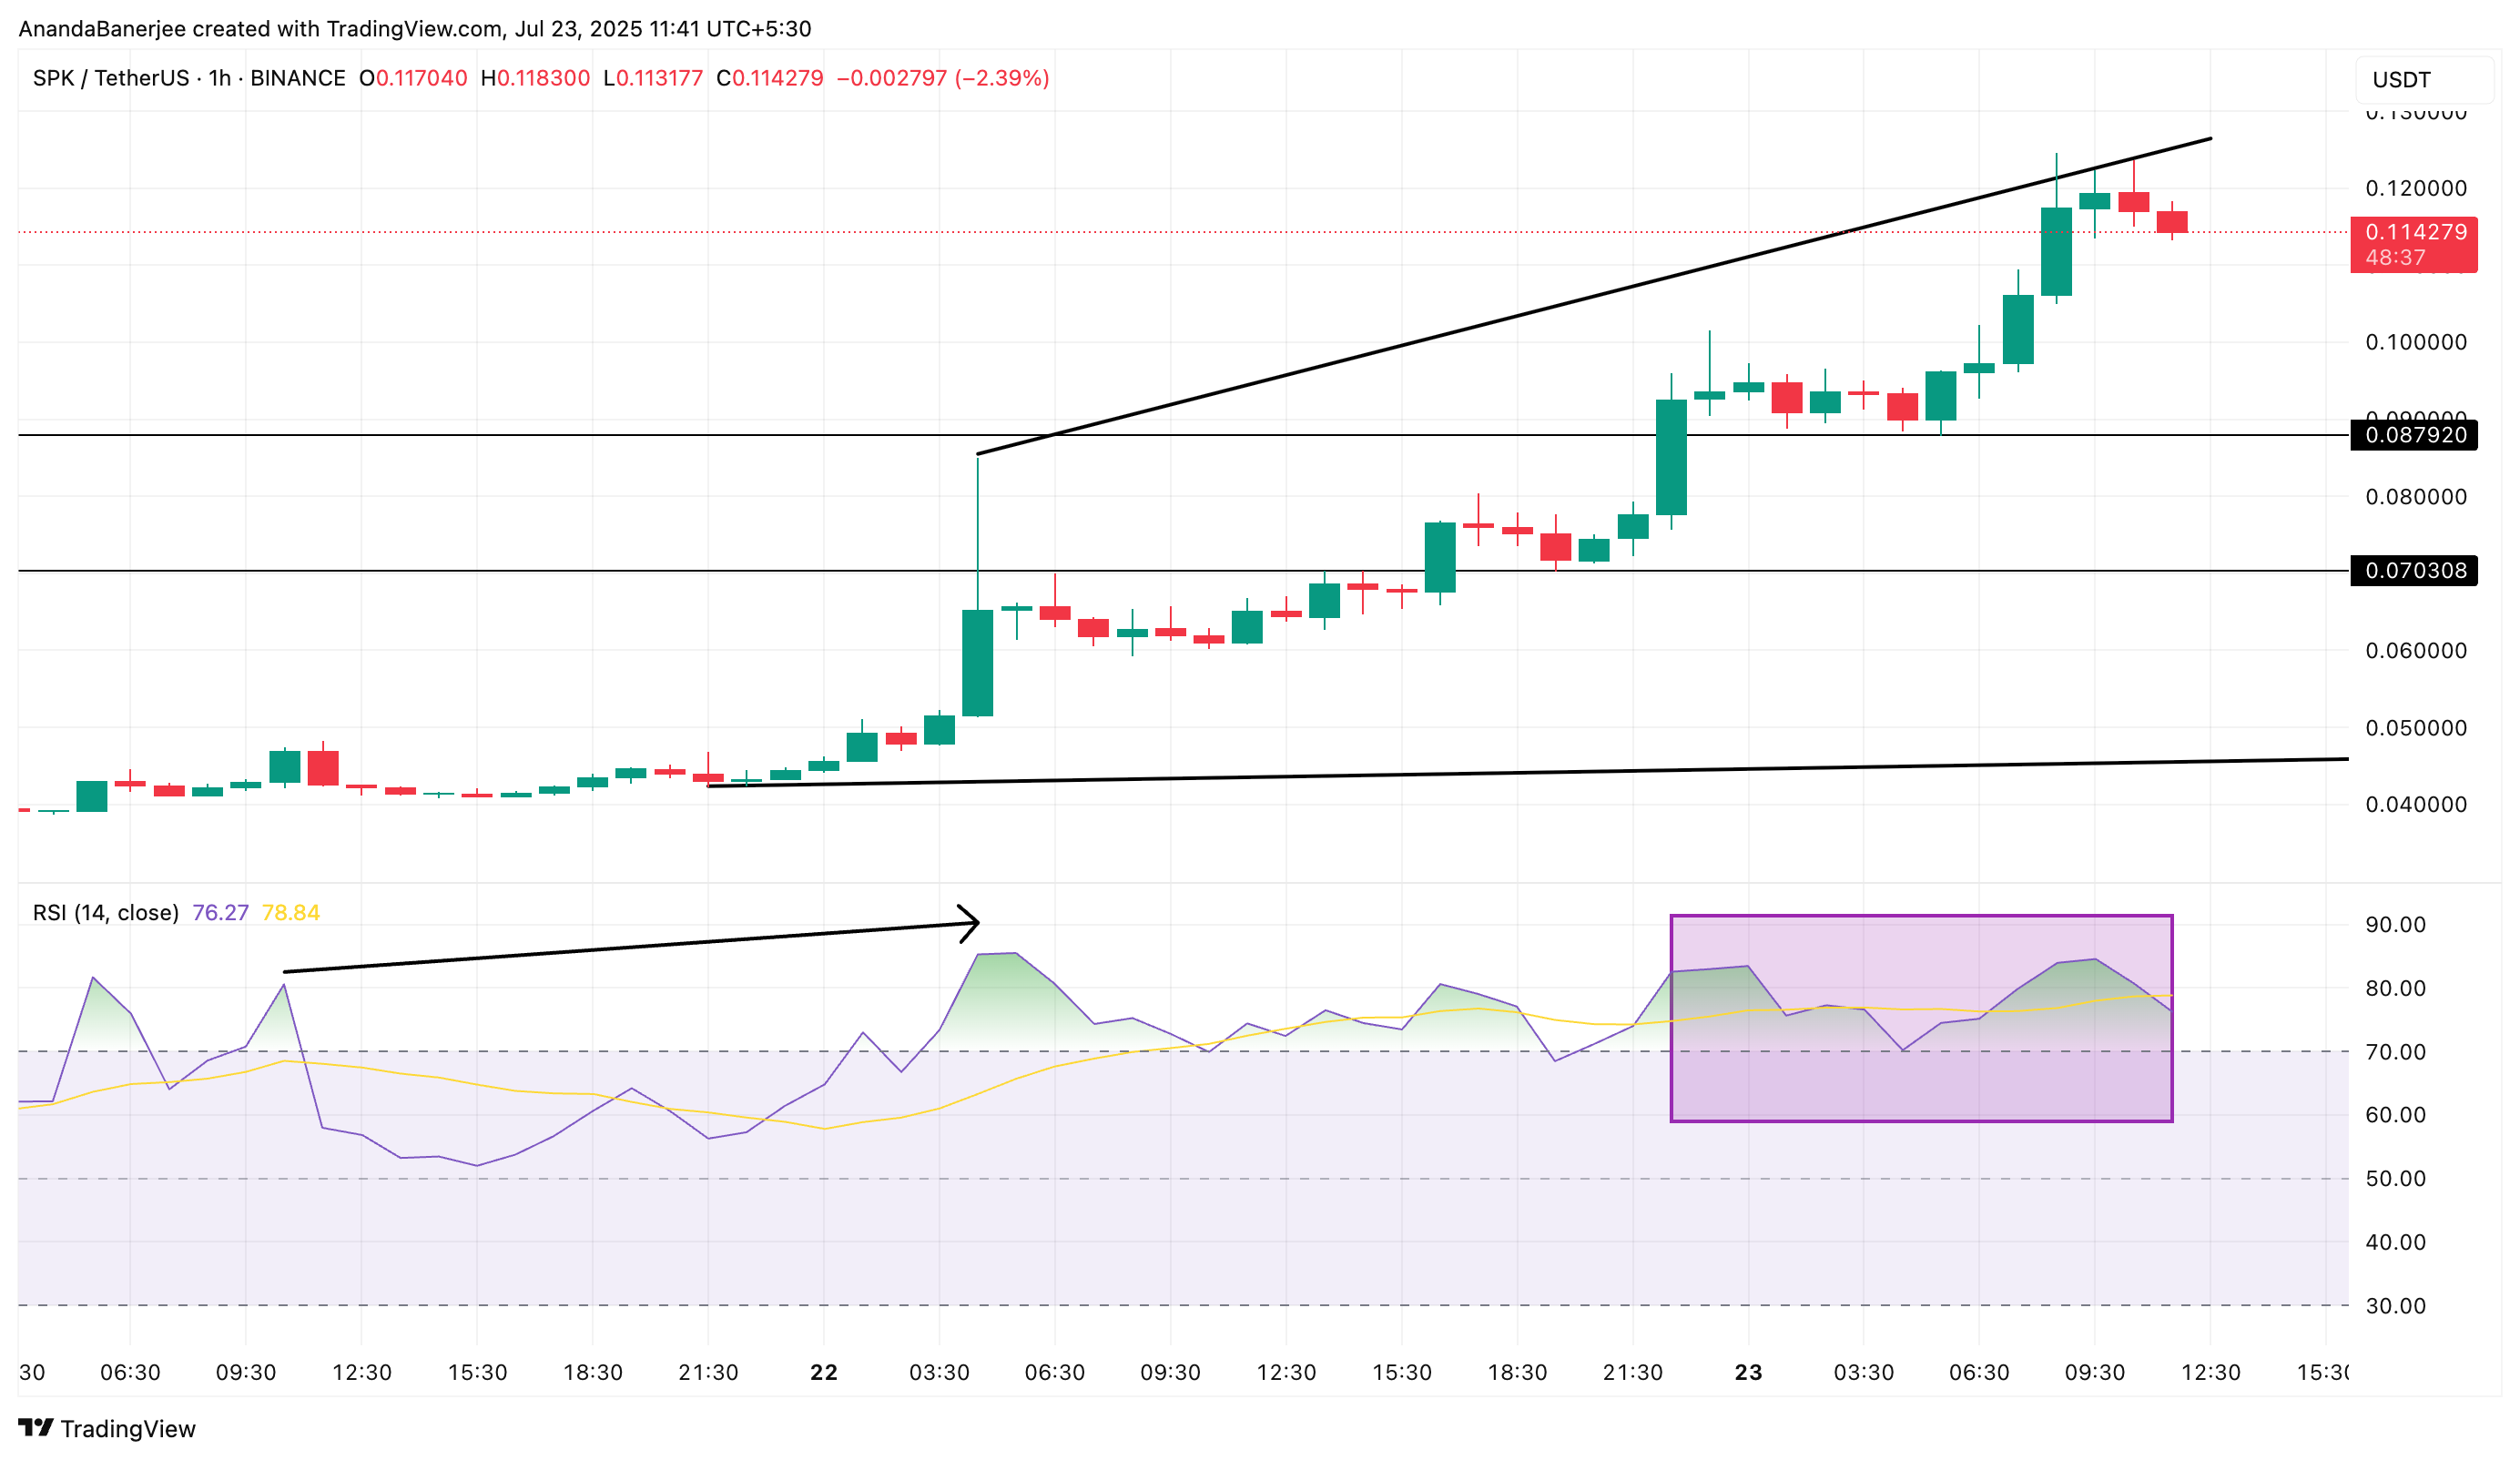
RSI Has to Lead for the Breakout to Stick
We analyse the 1‑hour Relative Strength Index (RSI) because this move is news‑driven and momentum shifts quickly at that scale. Plus, the hourly view can help foresee any trend before it moves to the daily or even the 4-hour timeline.
Last time, between July 21 and 22, RSI made a higher high right as price nudged up, and that alignment kicked off the bigger rally.
Right now, Spark Price is hugging the top of an ascending wedge, but RSI is stuck around 80 without taking out its last peak. Price zone is the same, but the momentum is weaker.
For token TA and market updates: Want more token insights like this? Sign up for Editor Harsh Notariya’s Daily Crypto Newsletter here.
If RSI cannot print a higher high with price, a dip is more likely to occur.
RSI (Relative Strength Index) scores the strength of recent moves from 0 to 100; when price is flat or rising but RSI fades, momentum is not backing the push.
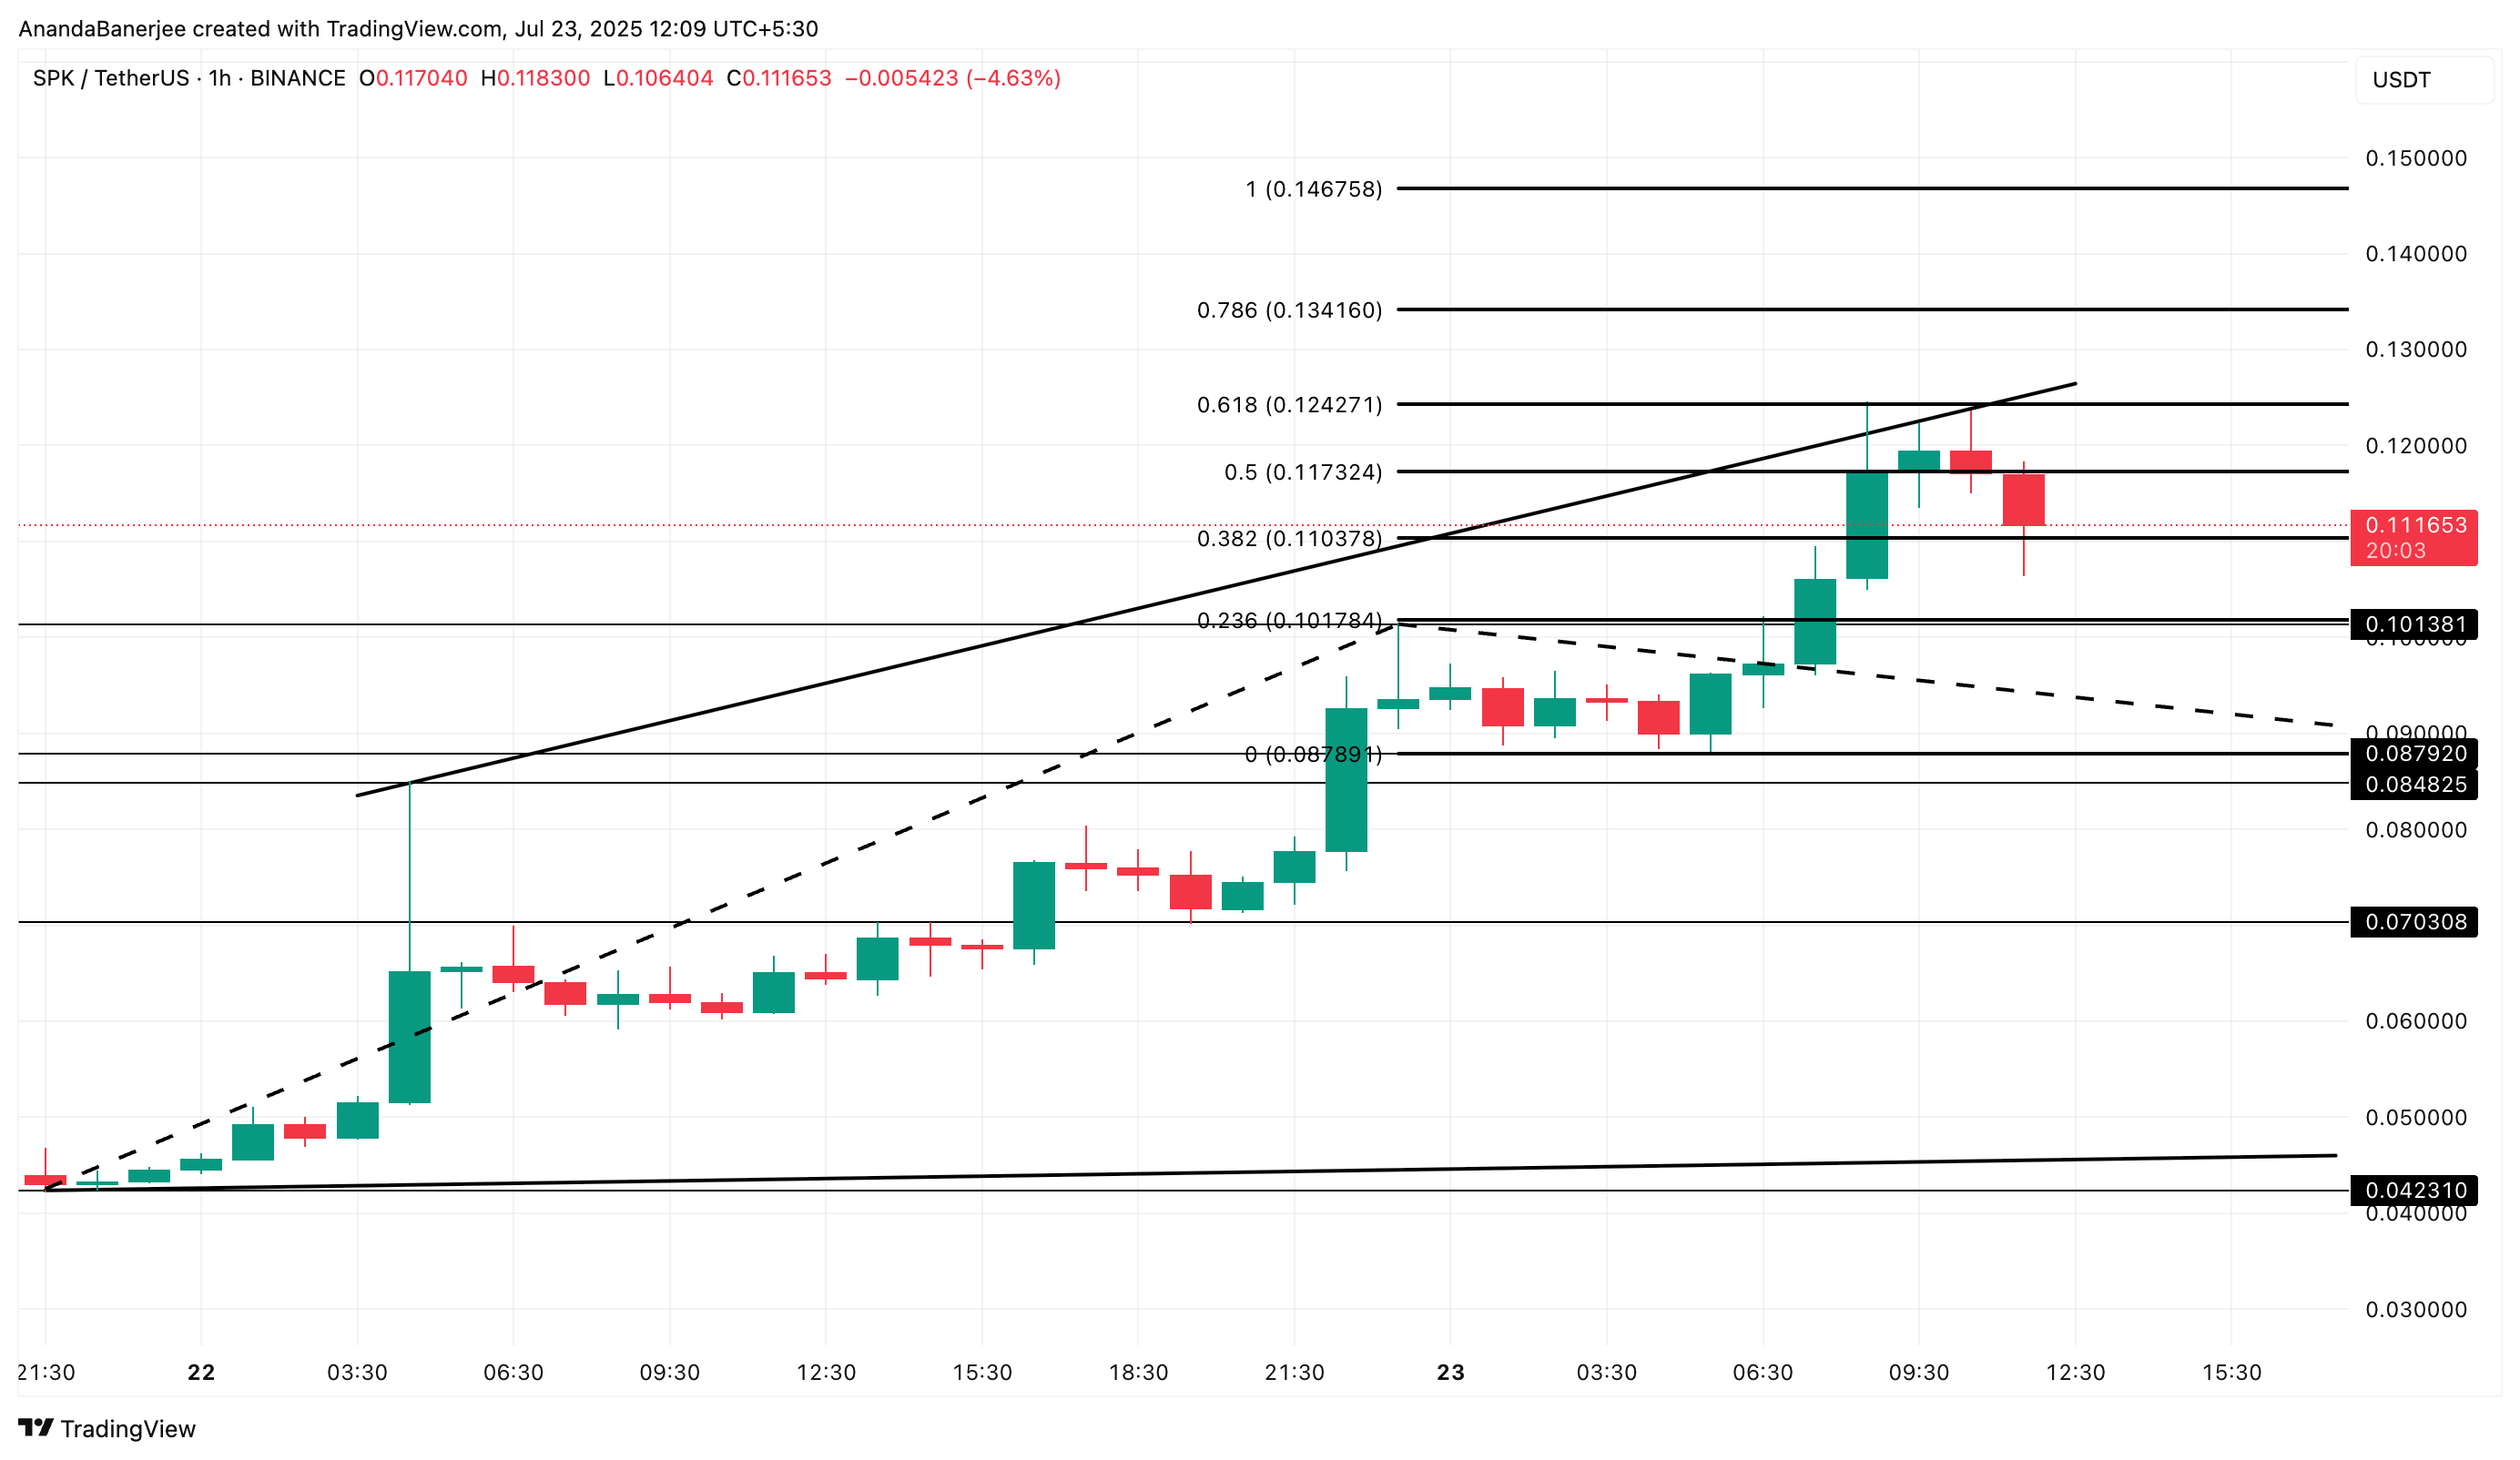
SPK Price Action: $0.124 Is the Trigger
The upper edge of that wedge lines up almost perfectly with the 0.618 mark of a trend‑based Fibonacci extension near $0.124, giving a clean validation level for Spark Token traders.
SPK has failed there twice. It has already slipped from $0.117 to about $0.111, so $0.110 is the first level bulls need to defend.
Lose it, and price might gravitate to $0.101, the earlier swing high used to anchor the Fib.
Below that sits $0.087 (the 0 Fib line). The broader bullish structure survives above that zone, but if SPK breaks under it, $0.070 comes into play and the uptrend weakens.
Flip side: a clean hourly close above $0.124, with RSI breaking higher and hourly inflows cooling, would clear the path for continuation and another all‑time high in SPK Price.
After a strong 26% gain over the past week, Pudgy Penguins (PENGU) is now hovering just below a crucial resistance level.
While much of the altcoin market cools down, PENGU price looks poised to break out. Only if it can push past one key wall. A deeper look at bullish strength, liquidations, and price charts shows the token might still have room to run.
PENGU Bulls Are In Complete Control
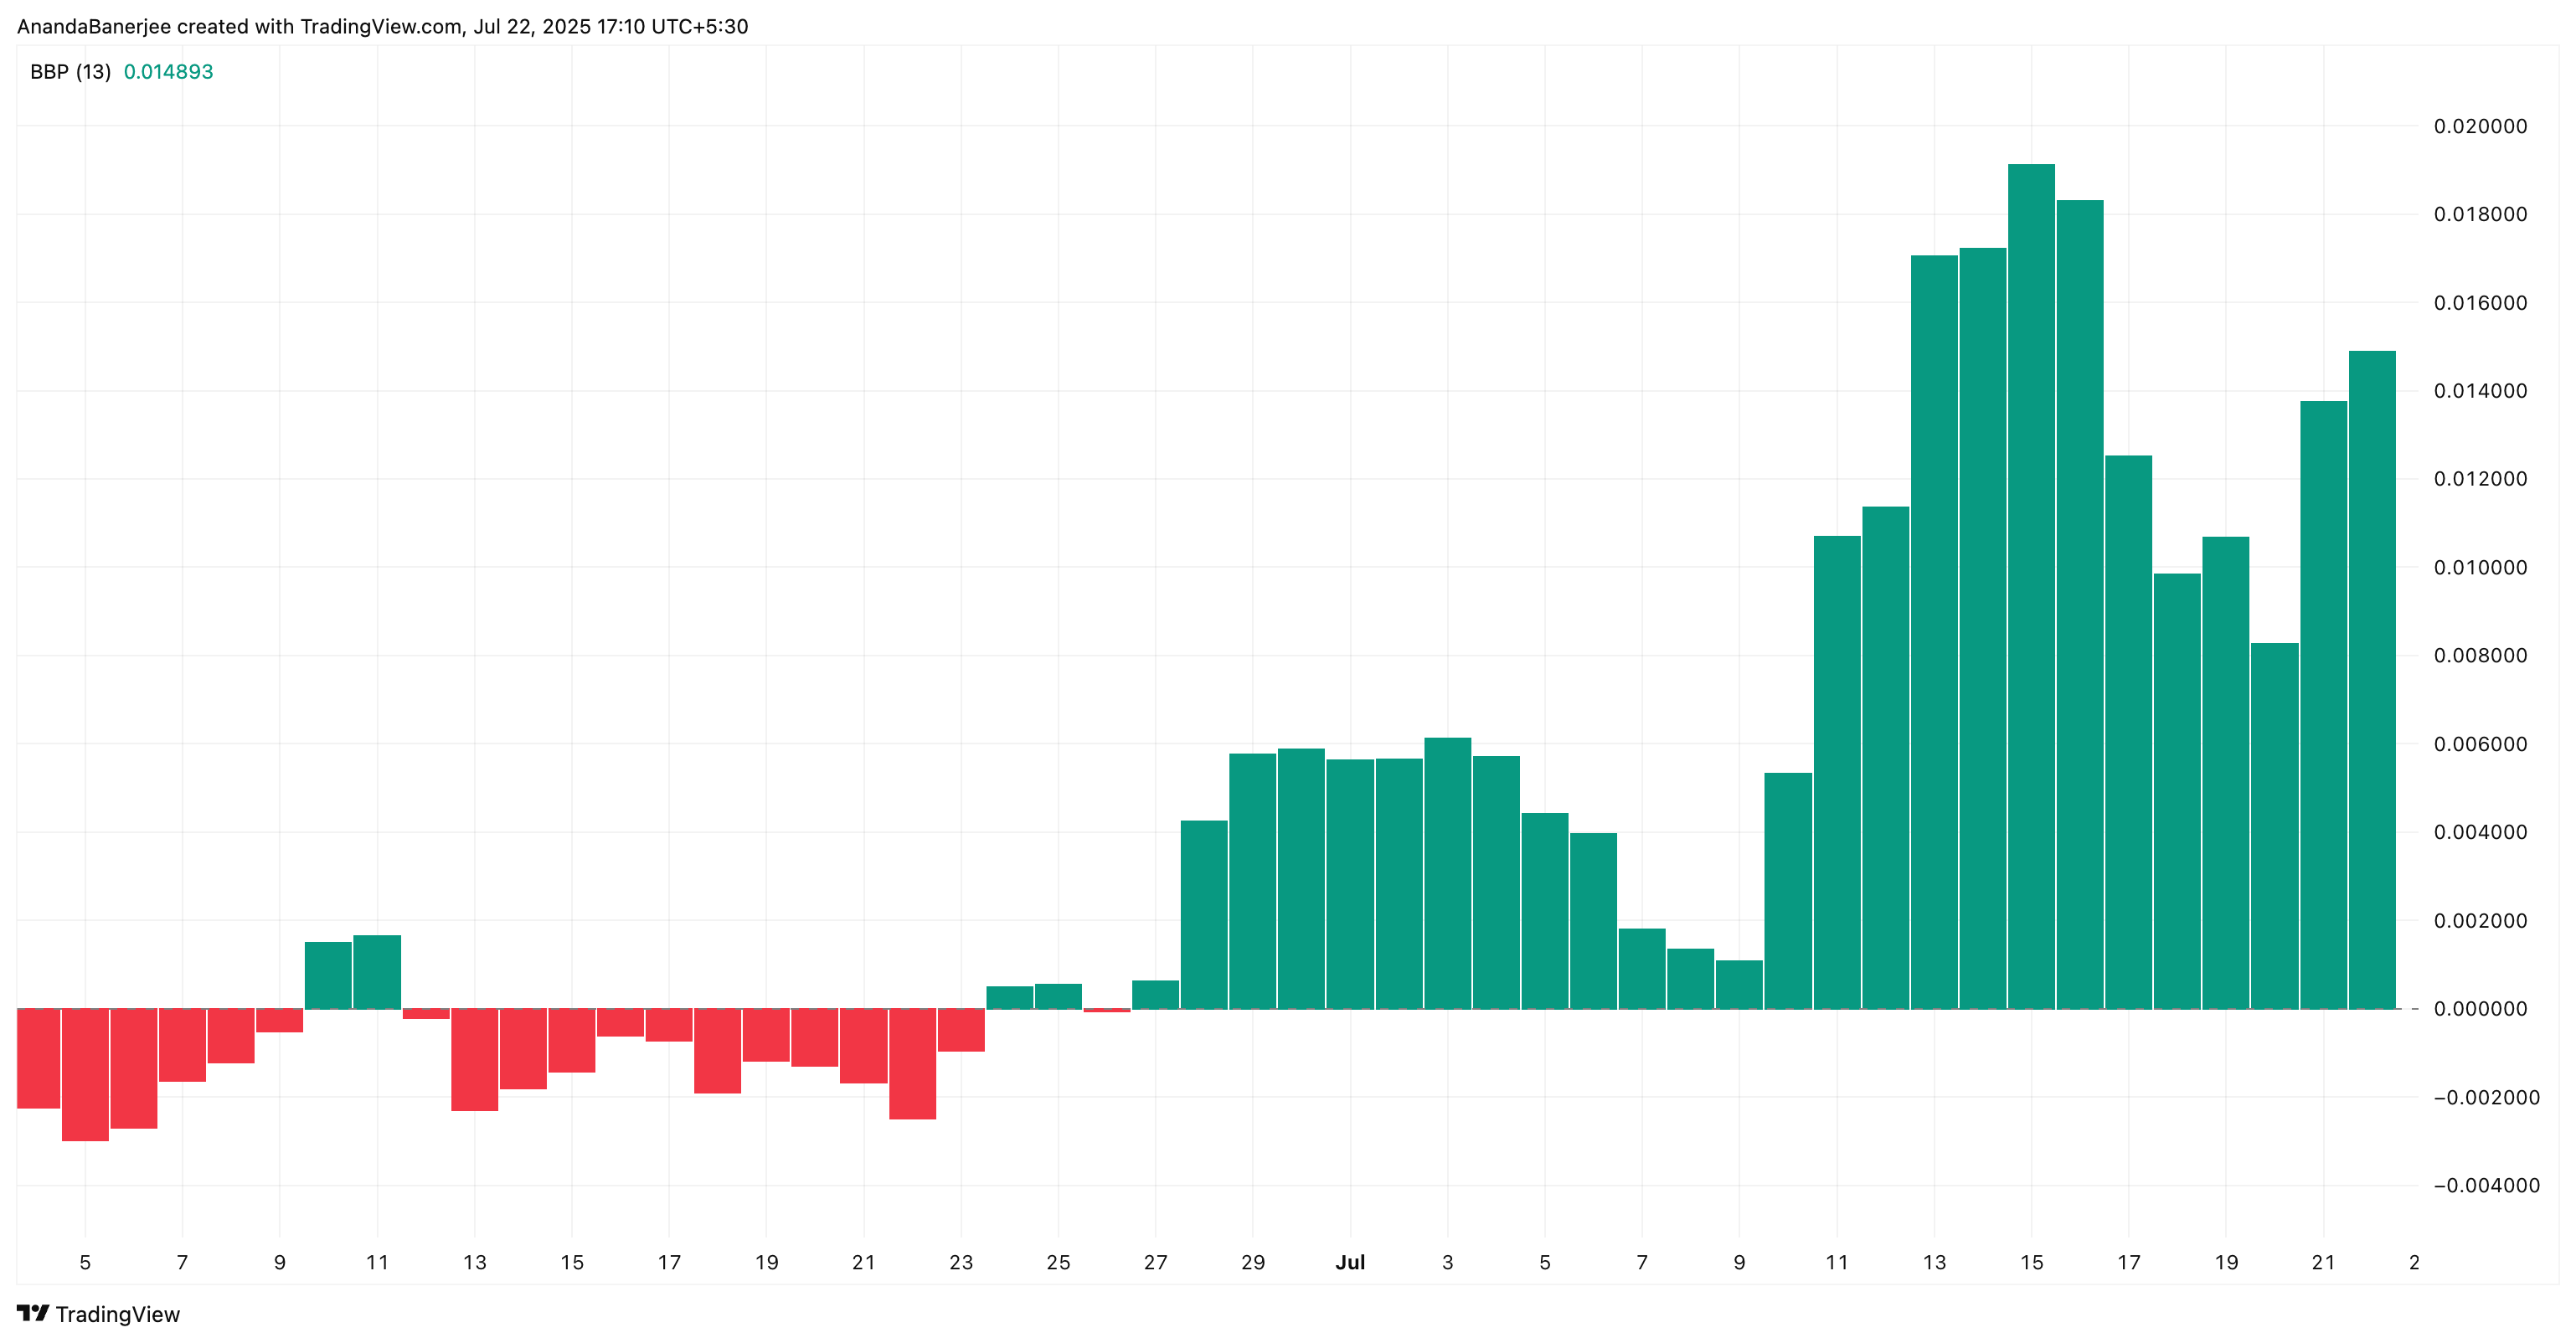
Even though PENGU dropped around 2% in the past 24 hours, the bulls still seem to be holding the reins. The Bull-Bear Power (BBP) index, which compares recent highs and lows to measure market strength, is currently flashing green, at around 0.0148. This level suggests buyers still have the upper hand, despite a short-term dip.
For token TA and market updates: Want more token insights like this? Sign up for Editor Harsh Notariya’s Daily Crypto Newsletter here.
In simple terms, when BBP is positive, bulls are stronger than bears. And Pengu’s BBP has remained above zero since late June, even as prices hovered below key resistance. That steady strength could be a sign that any dip is just part of a cooldown before another leg up.
If BBP stays positive while price climbs past resistance, it might confirm that PENGU still has momentum. But if BBP flips negative, it could warn of a deeper pullback ahead.
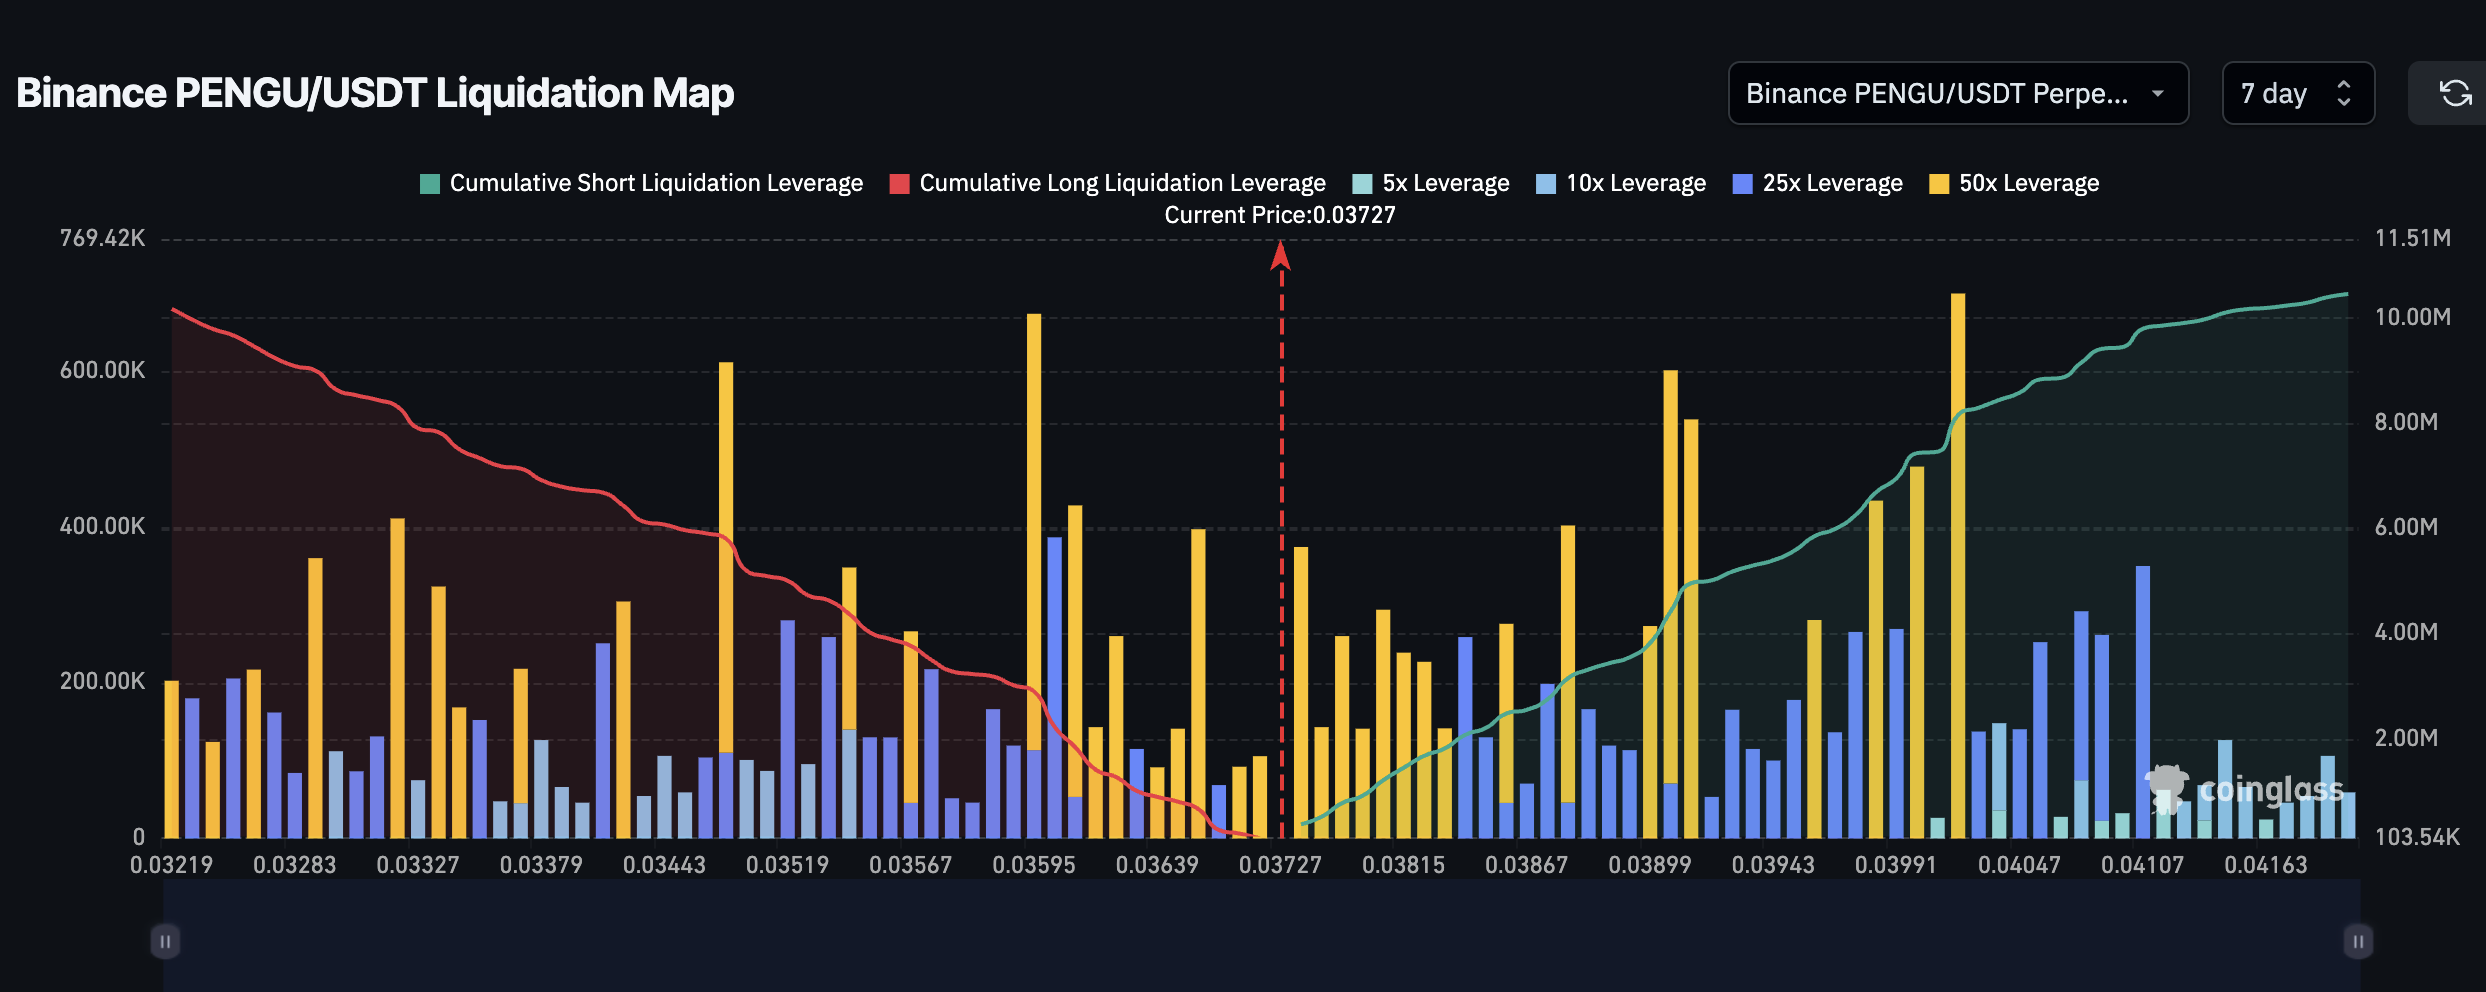
7-Day Liquidation Map Shows Short-Biased Setup
PENGU is currently trading around $0.036. The 7-day liquidation map shows cumulative short liquidation leverage building up to $10.46 million versus $10.18 million for longs; a slight bias toward short positions. Do note that there isn’t much to choose between Longs and Shorts, and a price push in either direction can decide the next leg for PENGU.
However, as bulls are in power and that too by a sizable margin, as established by the BBP index, the price action could impact the short positions more than the long.
If the price crosses $0.039, led by bulls breaking key resistance level, and even nears $0.042, a major liquidation cluster of shorts gets triggered. That would reduce downward pressure and potentially propel the PENGU price to the next key price level.
The liquidation map shows a build-up of short positions; if PENGU’s price moves up fast, those betting against it may be forced to buy back, pushing the price even higher.
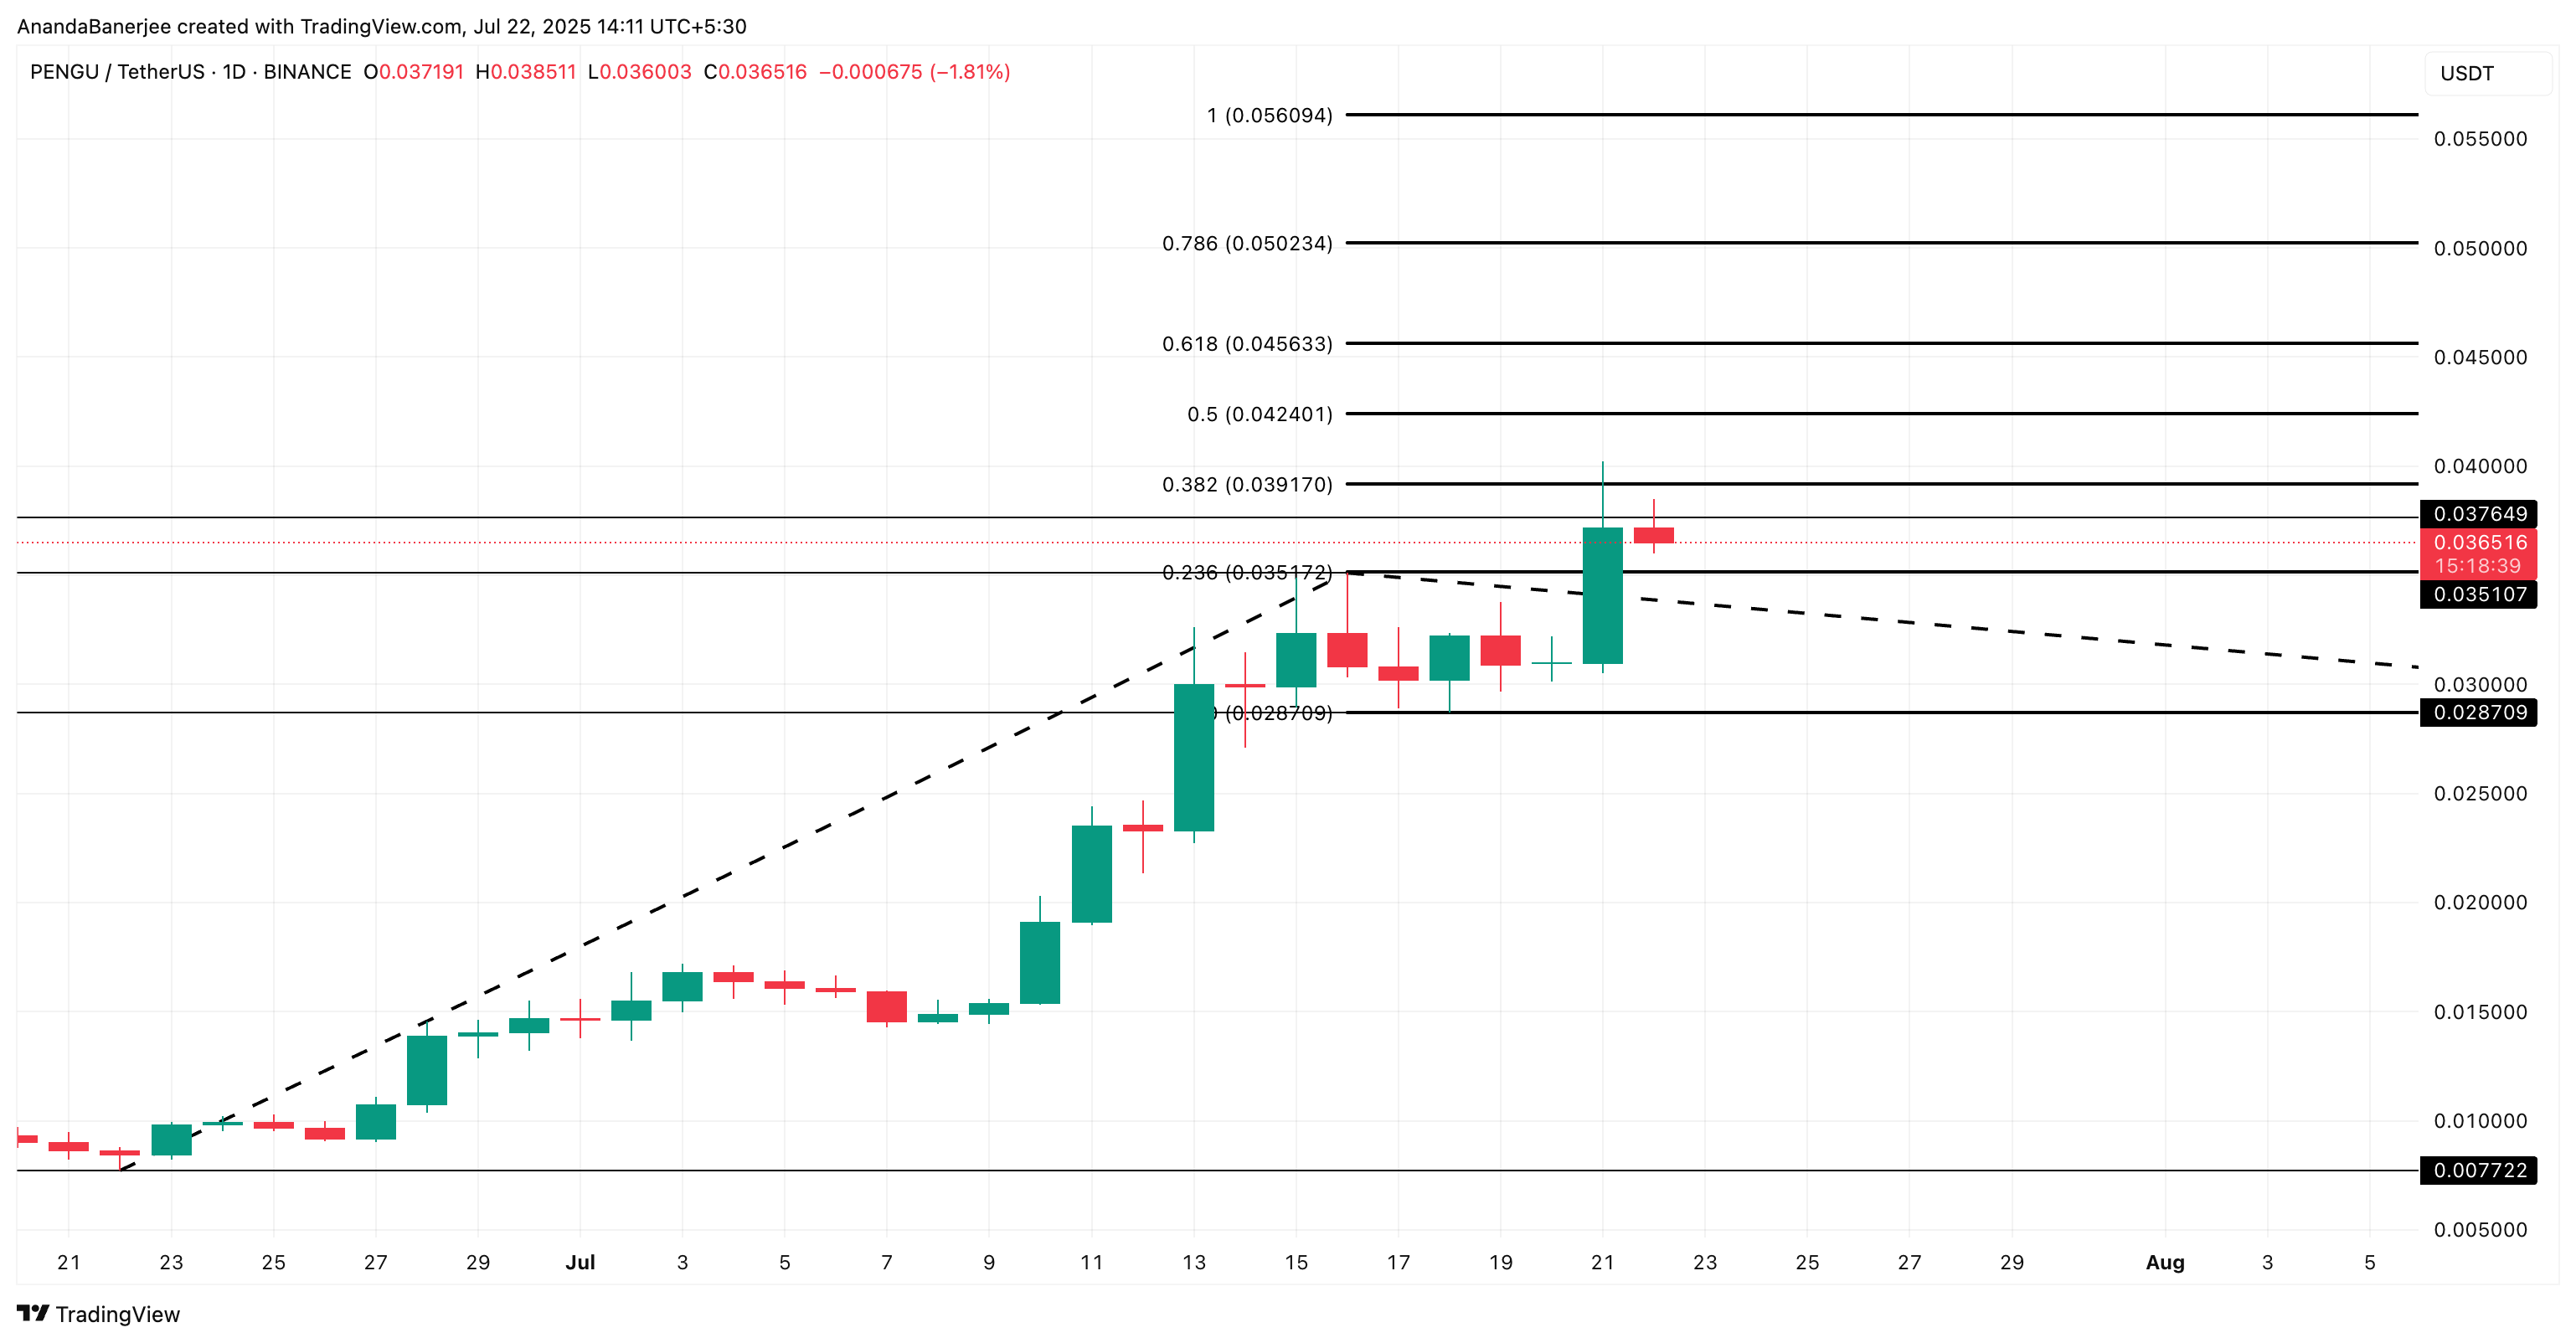
PENGU Price Action Hints at a 38% Upside
Technically, the PENGU price has tested the 0.382 Fibonacci level near $0.039 twice and failed to break above cleanly. It now trades just under that resistance. Do note that besides the Fib extension resistance, a key resistance of $0.037 also exists.
The chart uses the Trend-based Fibonacci extension tool. It connects the swing low of $0.0077 to the last swing high of $0.035 and then to the immediately retraced price level of $0.028. This tool helps chart the next price targets for a coin/token in an uptrend.
If PENGU price manages a clean breakout above $0.037, $0.039, and then $0.042 (the 0.5 Fib zone), it opens the path to $0.045 first, a 25% surge. If that breaks, the next key resistance point, or rather target, would be $0.050, the 0.786 Fibonacci level. That would be a 38% rally from current prices around $0.036.
Validation for this move comes from declining bear power, building short positions, and strong chart structure. The bullish trend would get invalidated if PENGU breaks the $0.035 resistance-turned-support. Or if it continues to drop to touch the retracement zone of the Fibonacci extension: the $0.028 mark.
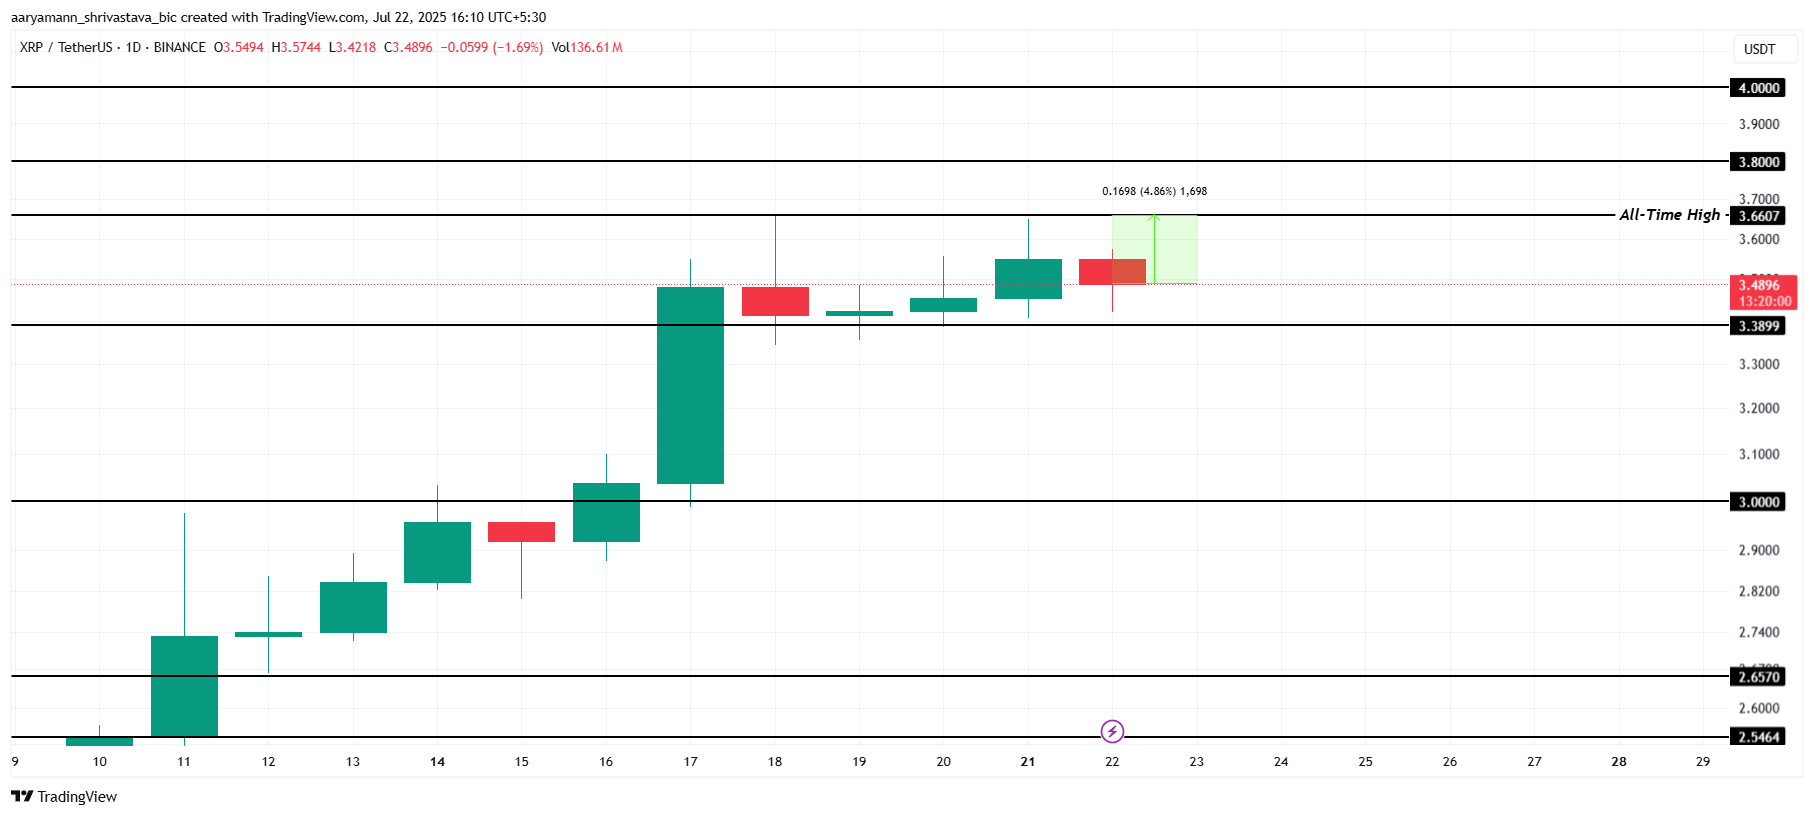
XRP recently hit a new all-time high before entering a period of sideways consolidation. The cryptocurrency has struggled to break past resistance but has also managed to avoid a major correction.
This equilibrium, however, may not last much longer as investor behavior signals a shift in momentum.
XRP Investors Are Not Confident
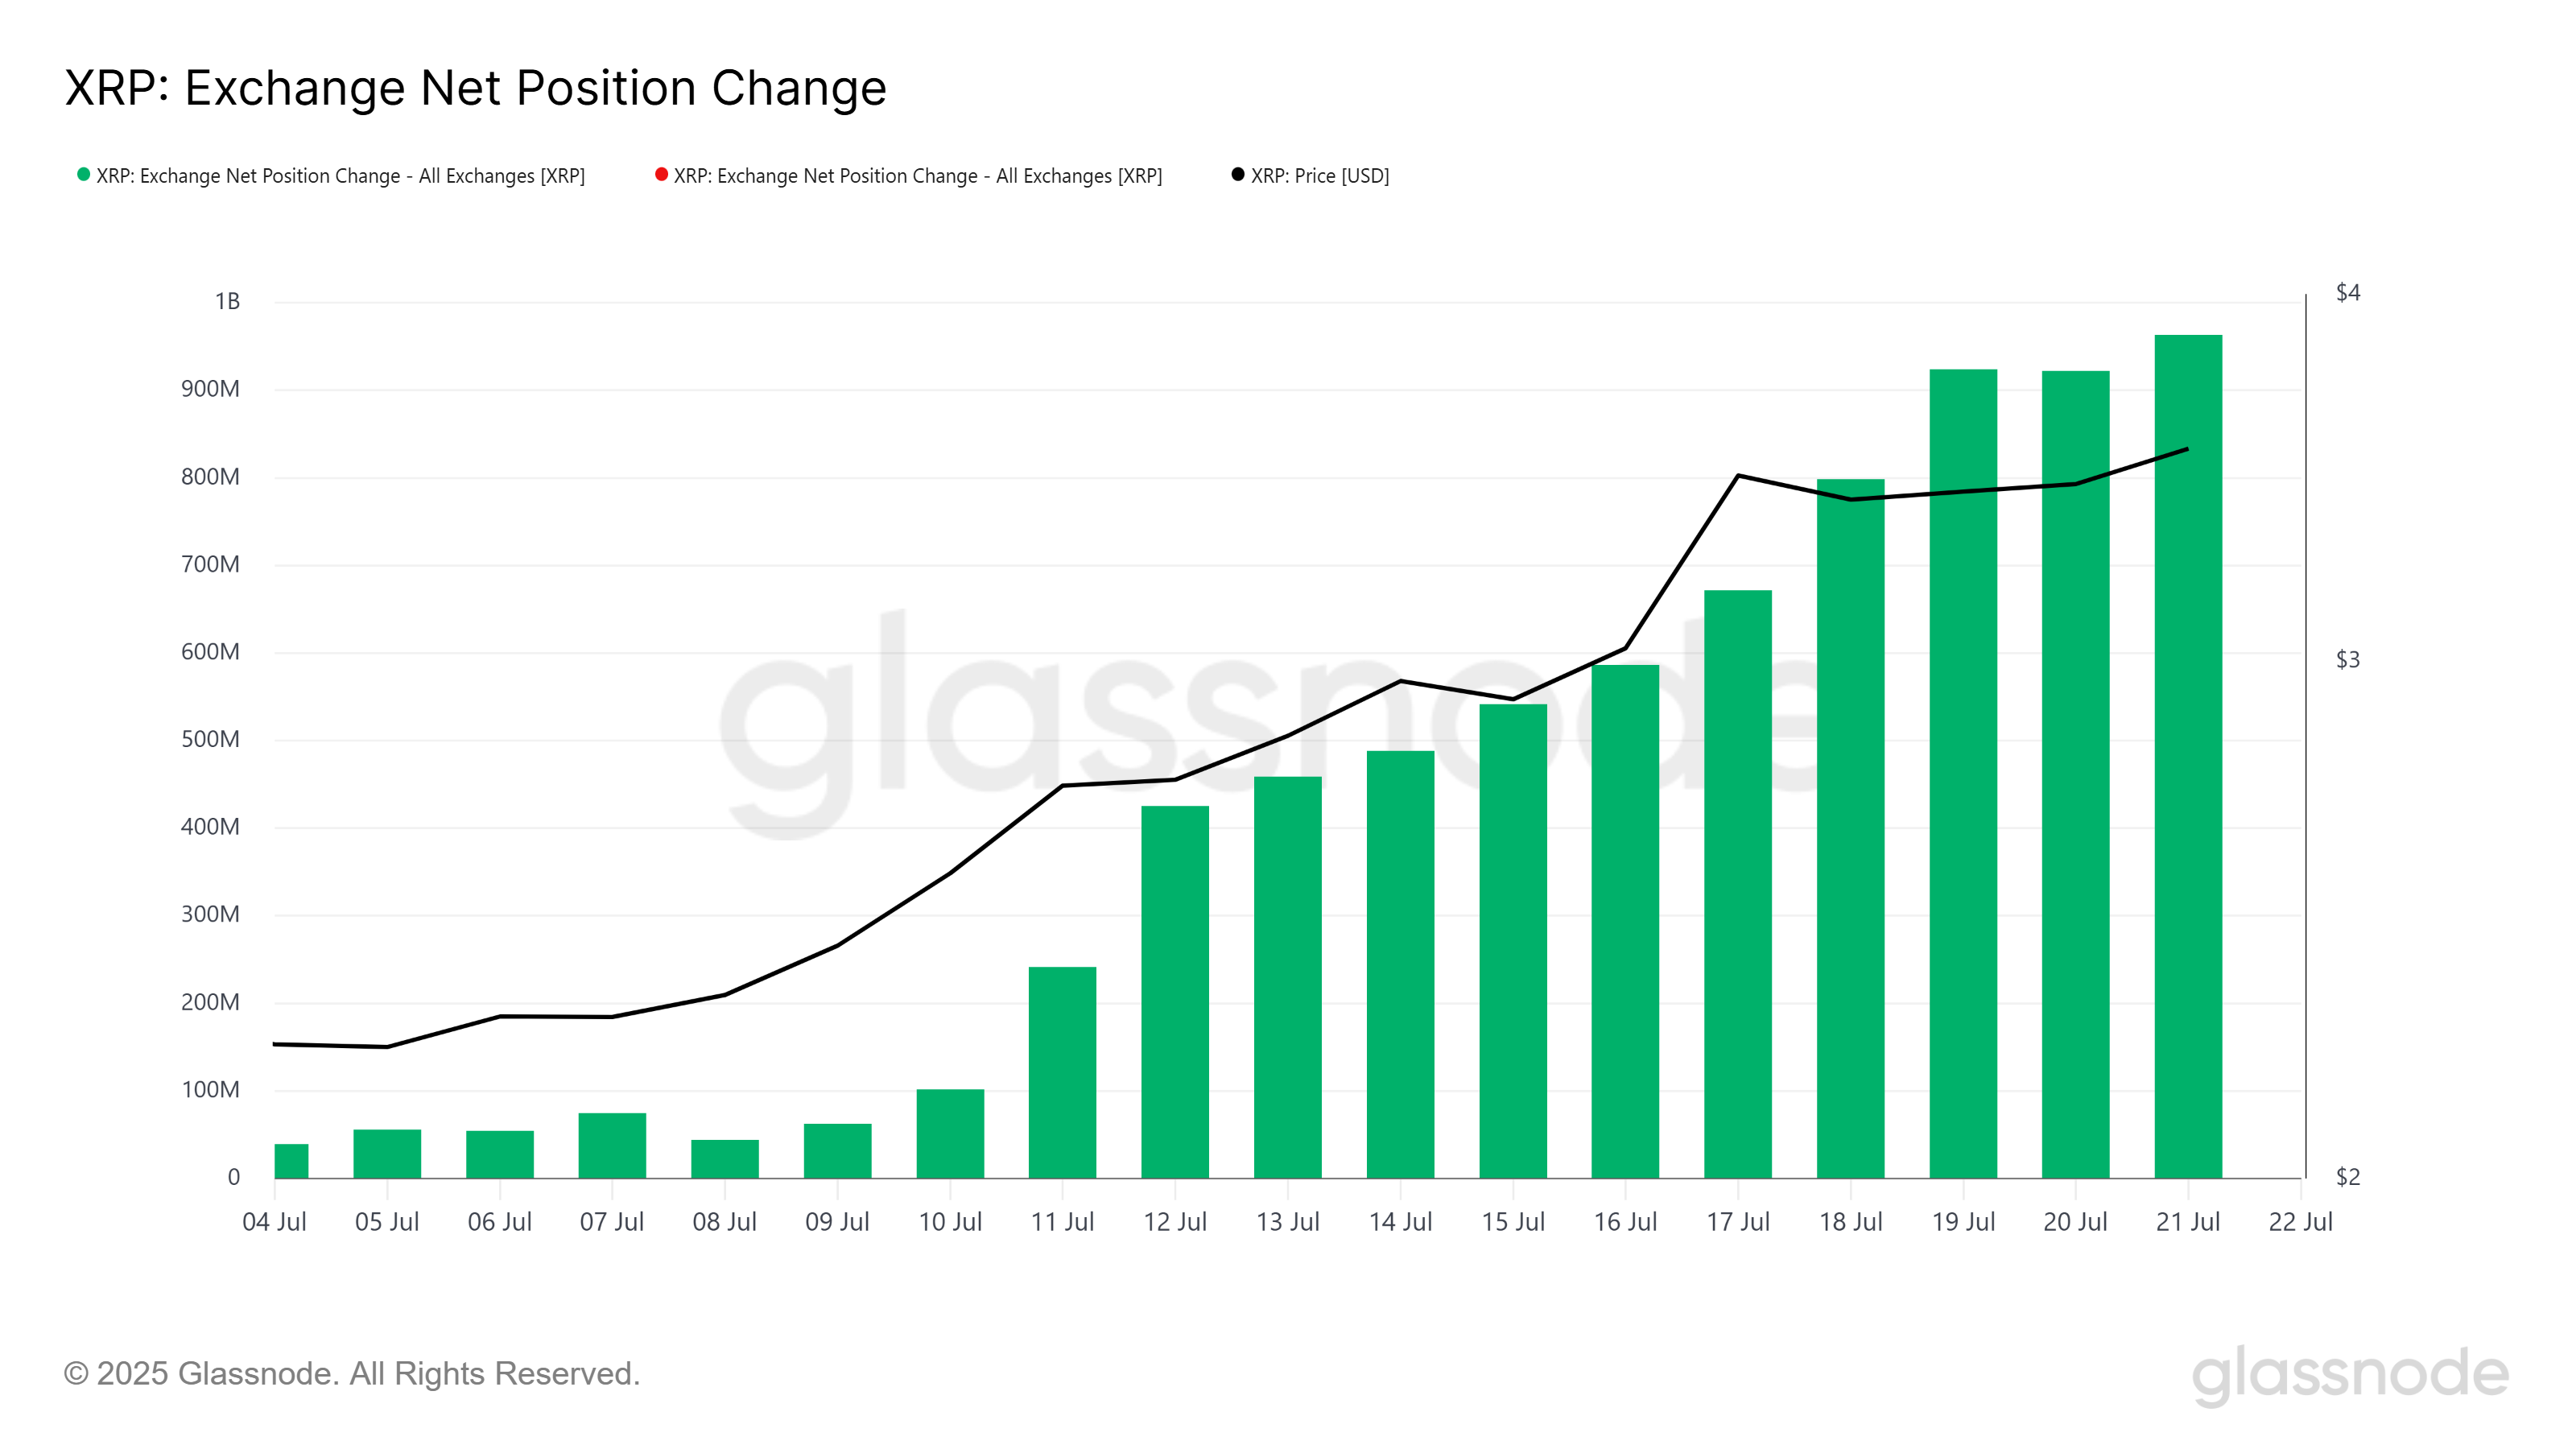
Investors have started selling off large amounts of XRP, suggesting declining confidence in further upside. Over the past week, exchange wallets saw an influx of nearly 450 million XRP, valued at more than $2.81 billion. This spike in supply indicates that holders are moving their assets to sell, usually a bearish indicator in market cycles.
The rapid profit booking appears to be fueled by concerns that XRP has peaked in the short term. As investors move to secure their gains, the pressure on XRP’s price increases. A continued rise in selling could result in a drop below the immediate support levels, making recovery more difficult.
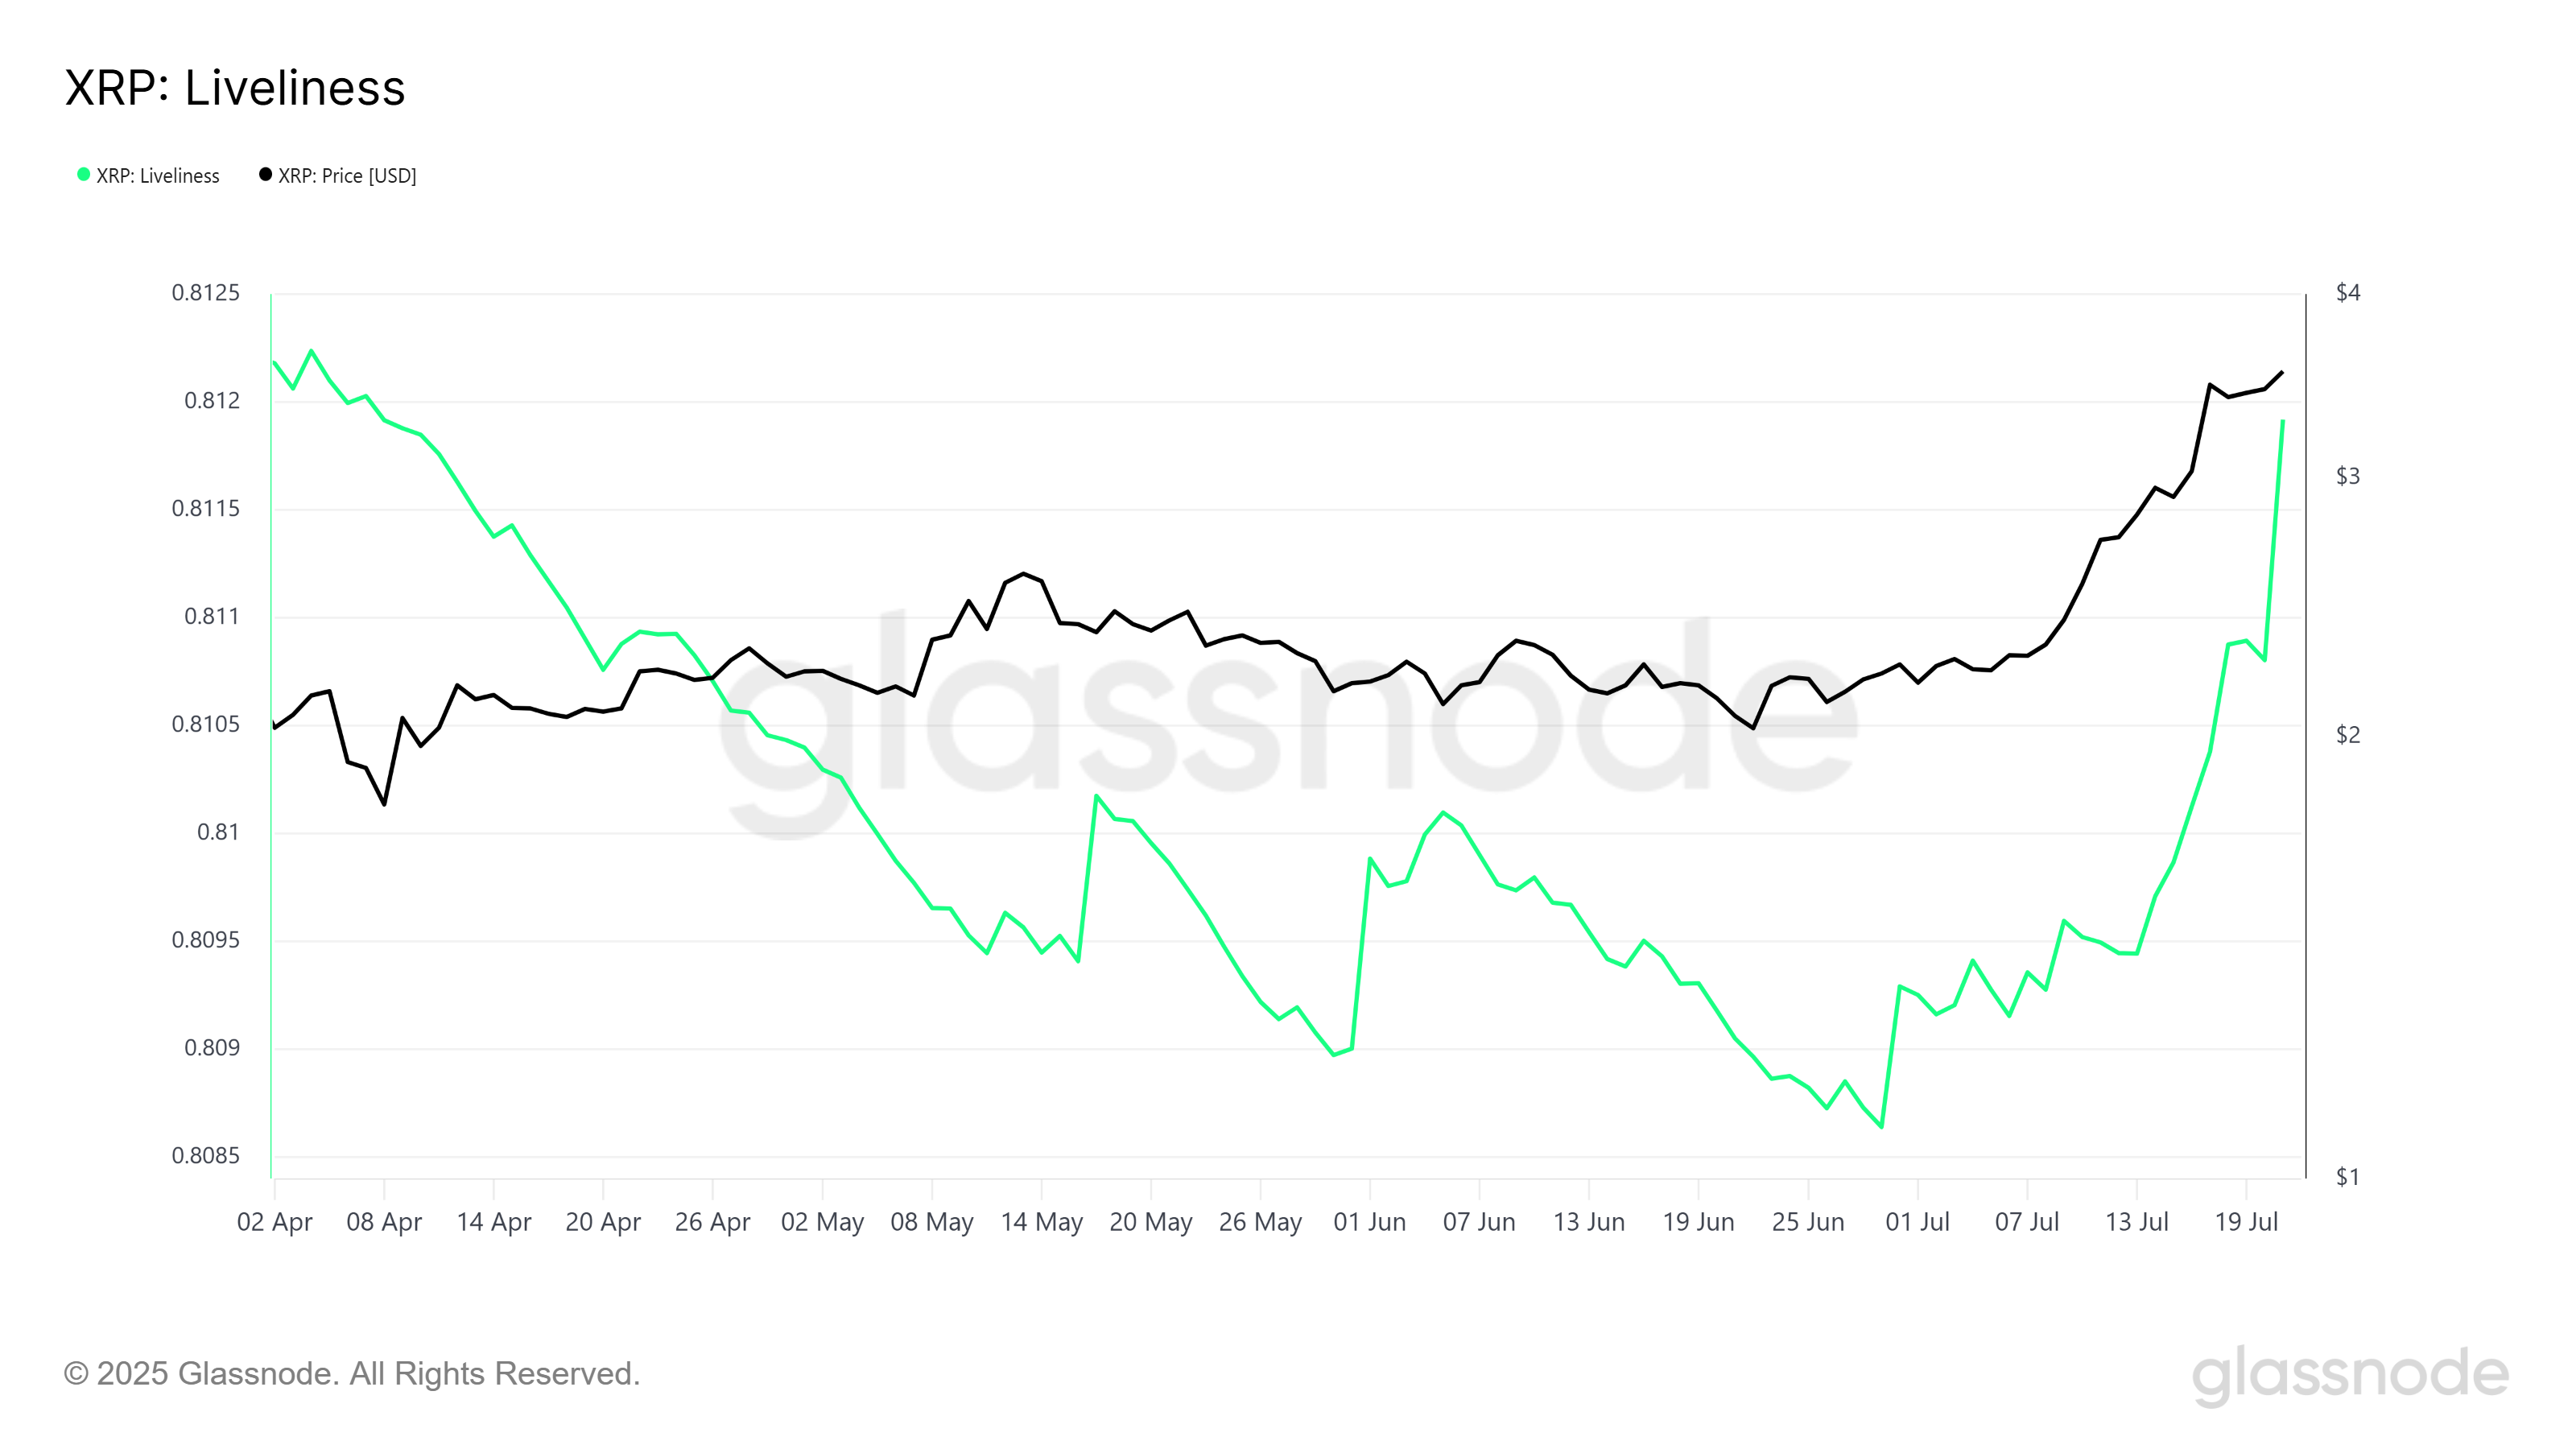
On-chain data further confirms the bearish sentiment. Liveliness, a metric used to track long-term holder (LTH) behavior, is currently at a three-month high. This suggests that LTHs, typically known for their conviction and market influence, are now selling XRP.
Their shift in behavior is a strong indicator of potential downward pressure.
Historically, an uptick in Liveliness precedes market corrections. Since LTHs hold a large portion of the supply, their decisions significantly impact price trends. The increase in Liveliness reflects a broader change in market outlook, aligning with the recent surge in exchange supply and overall decline in bullish sentiment.
XRP is currently trading at $3.48, only 4.8% away from its all-time high. Despite the proximity, the altcoin is showing signs of weakness and is clinging to the $3.38 support level. Without renewed buying interest, this support may not hold much longer.
If investor selling continues, XRP could fall through $3.38 and test the $3.00 support. A drop to this level would erase the recent gains and confirm a near-term bearish reversal. The loss of $3.00 could signal a longer consolidation phase or deeper correction.
However, if market participants absorb the sold supply and restore demand, XRP could rebound quickly. In this scenario, the altcoin might surpass $3.66, breach $3.80, and aim for $4.00. Such a move would invalidate the bearish outlook, and XRP Price could form a new ATH.
Polymarket, the crypto-powered prediction platform, is considering the launch of a custom stablecoin to capture yield from reserve assets.
The move would shift the platform’s reliance away from Circle’s USDC and give Polymarket direct control over the interest-bearing collateral backing user bets.
Polymarket To Enter the US Stablecoin Market?
According to several reports, the firm is still deciding between issuing its own stablecoin or accepting a revenue-sharing arrangement with Circle. No final decision has been made.
The motivation is reportedly financial. Polymarket holds a large volume of USDC, but currently, Circle collects the yield from those backing reserves.
By issuing its own dollar-pegged token, Polymarket could monetize this flow internally.
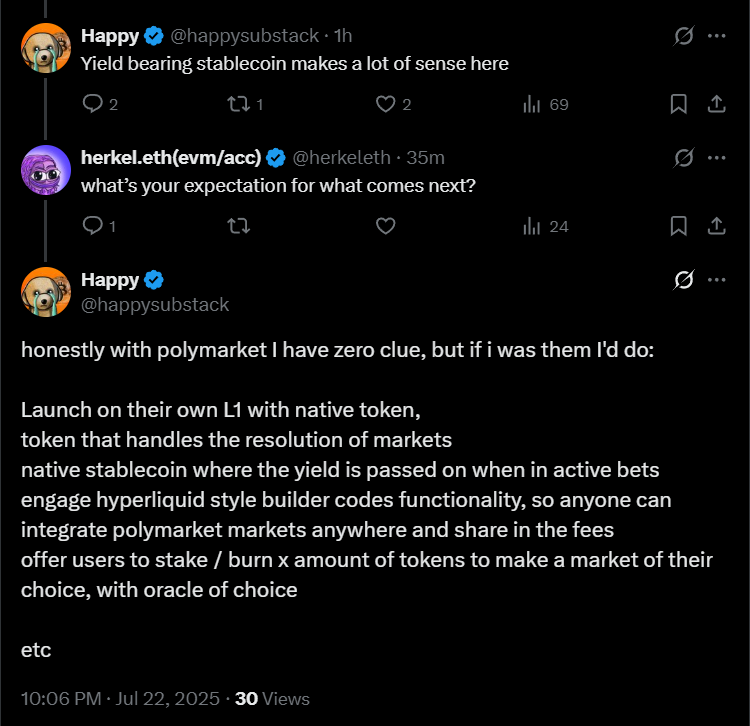
Community Comments on Polymarket’s Stablecoin Rumors. Source: X (Formerly Twitter)
The news follows Polymarket’s efforts to reenter the US market through the acquisition of crypto exchange QCEX. This comes after the DOJ dropped its investigation into the company related to unlicensed access by American users.
These bank-issued stablecoins aim to compete with Circle’s USDC and Tether’s USDT in both consumer and institutional settings.
By launching a platform-native stablecoin, Polymarket could join a growing list of fintech and financial players seeking to vertically integrate token issuance, reserve management, and platform economics.
Still, regulatory risk remains high. Any new issuance would likely require compliance with US stablecoin regulations and potential oversight under the GENIUS Act framework.
For now, Polymarket is still exploring its options. But the decision could have major implications for the prediction market’s revenue model—and for the broader stablecoin ecosystem.
President Trump announced a massive trade agreement with Japan, calling it “perhaps the largest Deal ever made.”
“We just completed a massive Deal with Japan, perhaps the largest Deal ever made,” Trump wrote in a post on Truth Social.
Japan will invest $550 billion in the US and face 15% tariffs on imports while opening its markets to American automobiles and agricultural products. The yen initially rose on the news.
The agreement requires Japan to expand market access for American cars and farm products, though Trump provided no additional specifics. Full details of the tentative Japanese deal remain unclear. Trump has a pattern of announcing broad trade frameworks first, with the White House typically releasing comprehensive terms in the following days or weeks as negotiations are finalized.
President Trump also announced a trade agreement with Philippine President Ferdinand Marcos Jr. following their Tuesday White House meeting. The deal sets U.S. tariffs on Philippine goods at 19%, down from a previously threatened 20% rate starting August 1. In exchange, the Philippines will maintain open markets with zero tariffs on U.S. imports.
Trump praised the agreement on Truth Social, calling Marcos’ visit “beautiful” and describing him as a “very good, and tough, negotiator.” The framework also includes military cooperation between the treaty allies.
Marcos, the first Southeast Asian leader to meet with Trump in his second term, emphasized the relationship’s importance amid rising tensions with China in the South China Sea. However, specific economic impact details of the preliminary agreement remain unclear.
The agreement with Philippines marks Trump’s fourth such deal following the UK, Vietnam, and Indonesia.


pic.twitter.com/G1GesdZdEc
ETHWarsaw
(@MarcinRedStone) July 23, 2025