Cardano’s price has surged by almost 10% over the past week amid the current broader market recovery. This surge is fueled by Cardano’s increasing network activity and long-term holding trends, indicating growing investor confidence.
With the broader market in recovery mode and on-chain fundamentals strengthening, ADA’s current setup suggests the potential for a sustained upside.
ADA Accumulation Grows as Traders Show Strong Conviction
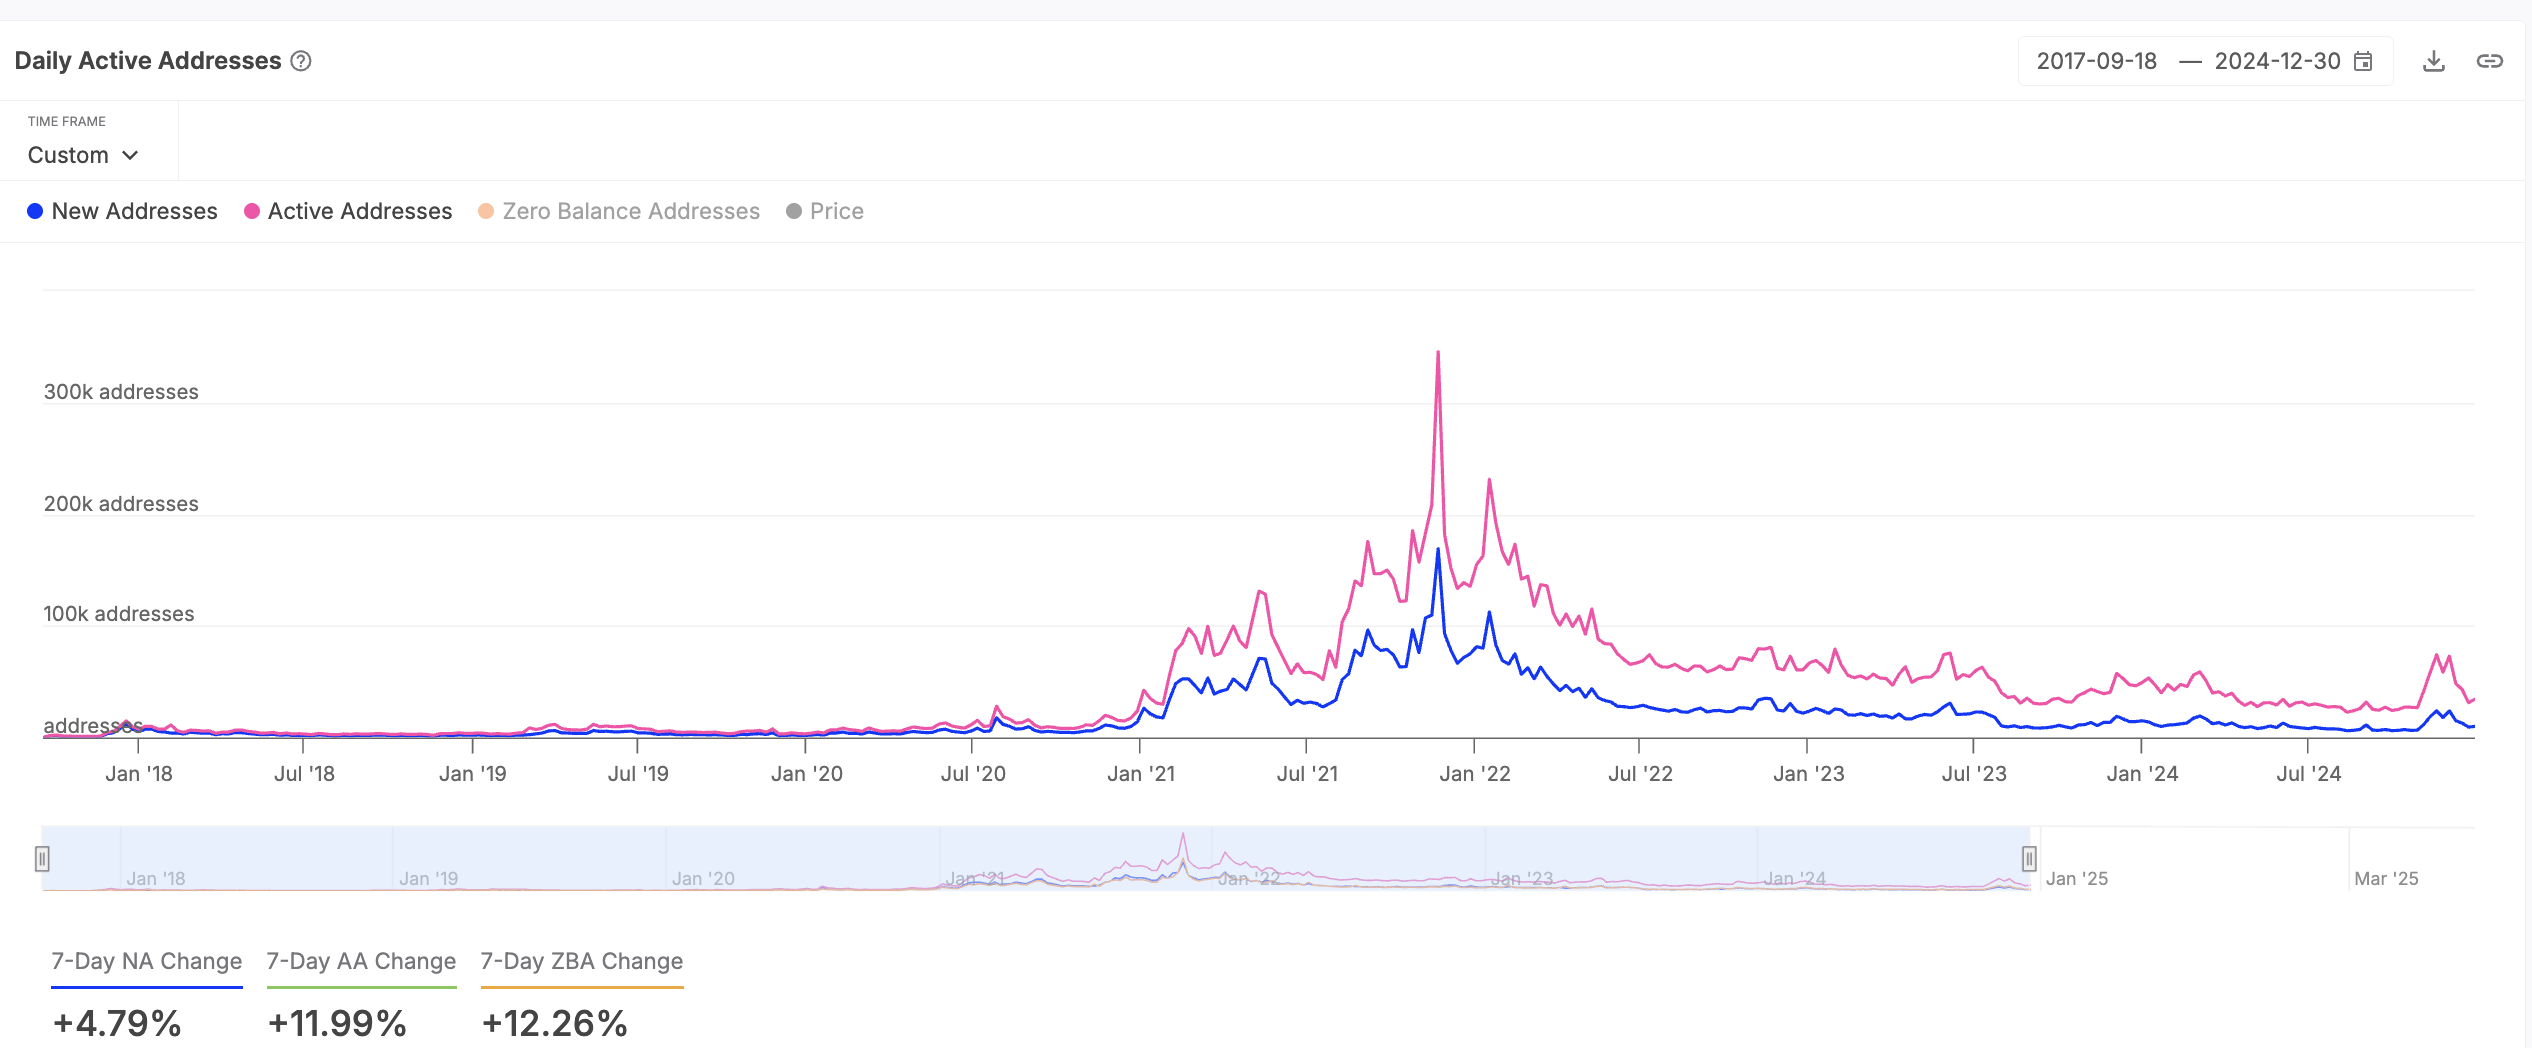
ADA’s demand has soared over the past week, as reflected by the steady surge in the daily count of active addresses on the Cardano network. According to IntoTheBlock, this has risen by 12% over the past seven days, indicating a gradual uptick in the demand for the Layer-1 coin.
This trend is a bullish signal, as it highlights growing investor interest in ADA and could drive its sustained price rally.
Moreover, new demand for the altcoin has also climbed. According to IntoTheBlock, the number of new addresses on the Cardano network has increased by 5% during the review period.
When ADA sees a gradual increase in new demand like this, it indicates the entry of new investors or traders into the market. This leads to higher trading volumes and liquidity, which in turn drives up the coin’s price.
Further, ADA investors have increased their holding time, signaling that the bullish momentum toward the altcoin is growing. According to IntoTheBlock, it has increased by 78% over the past week.
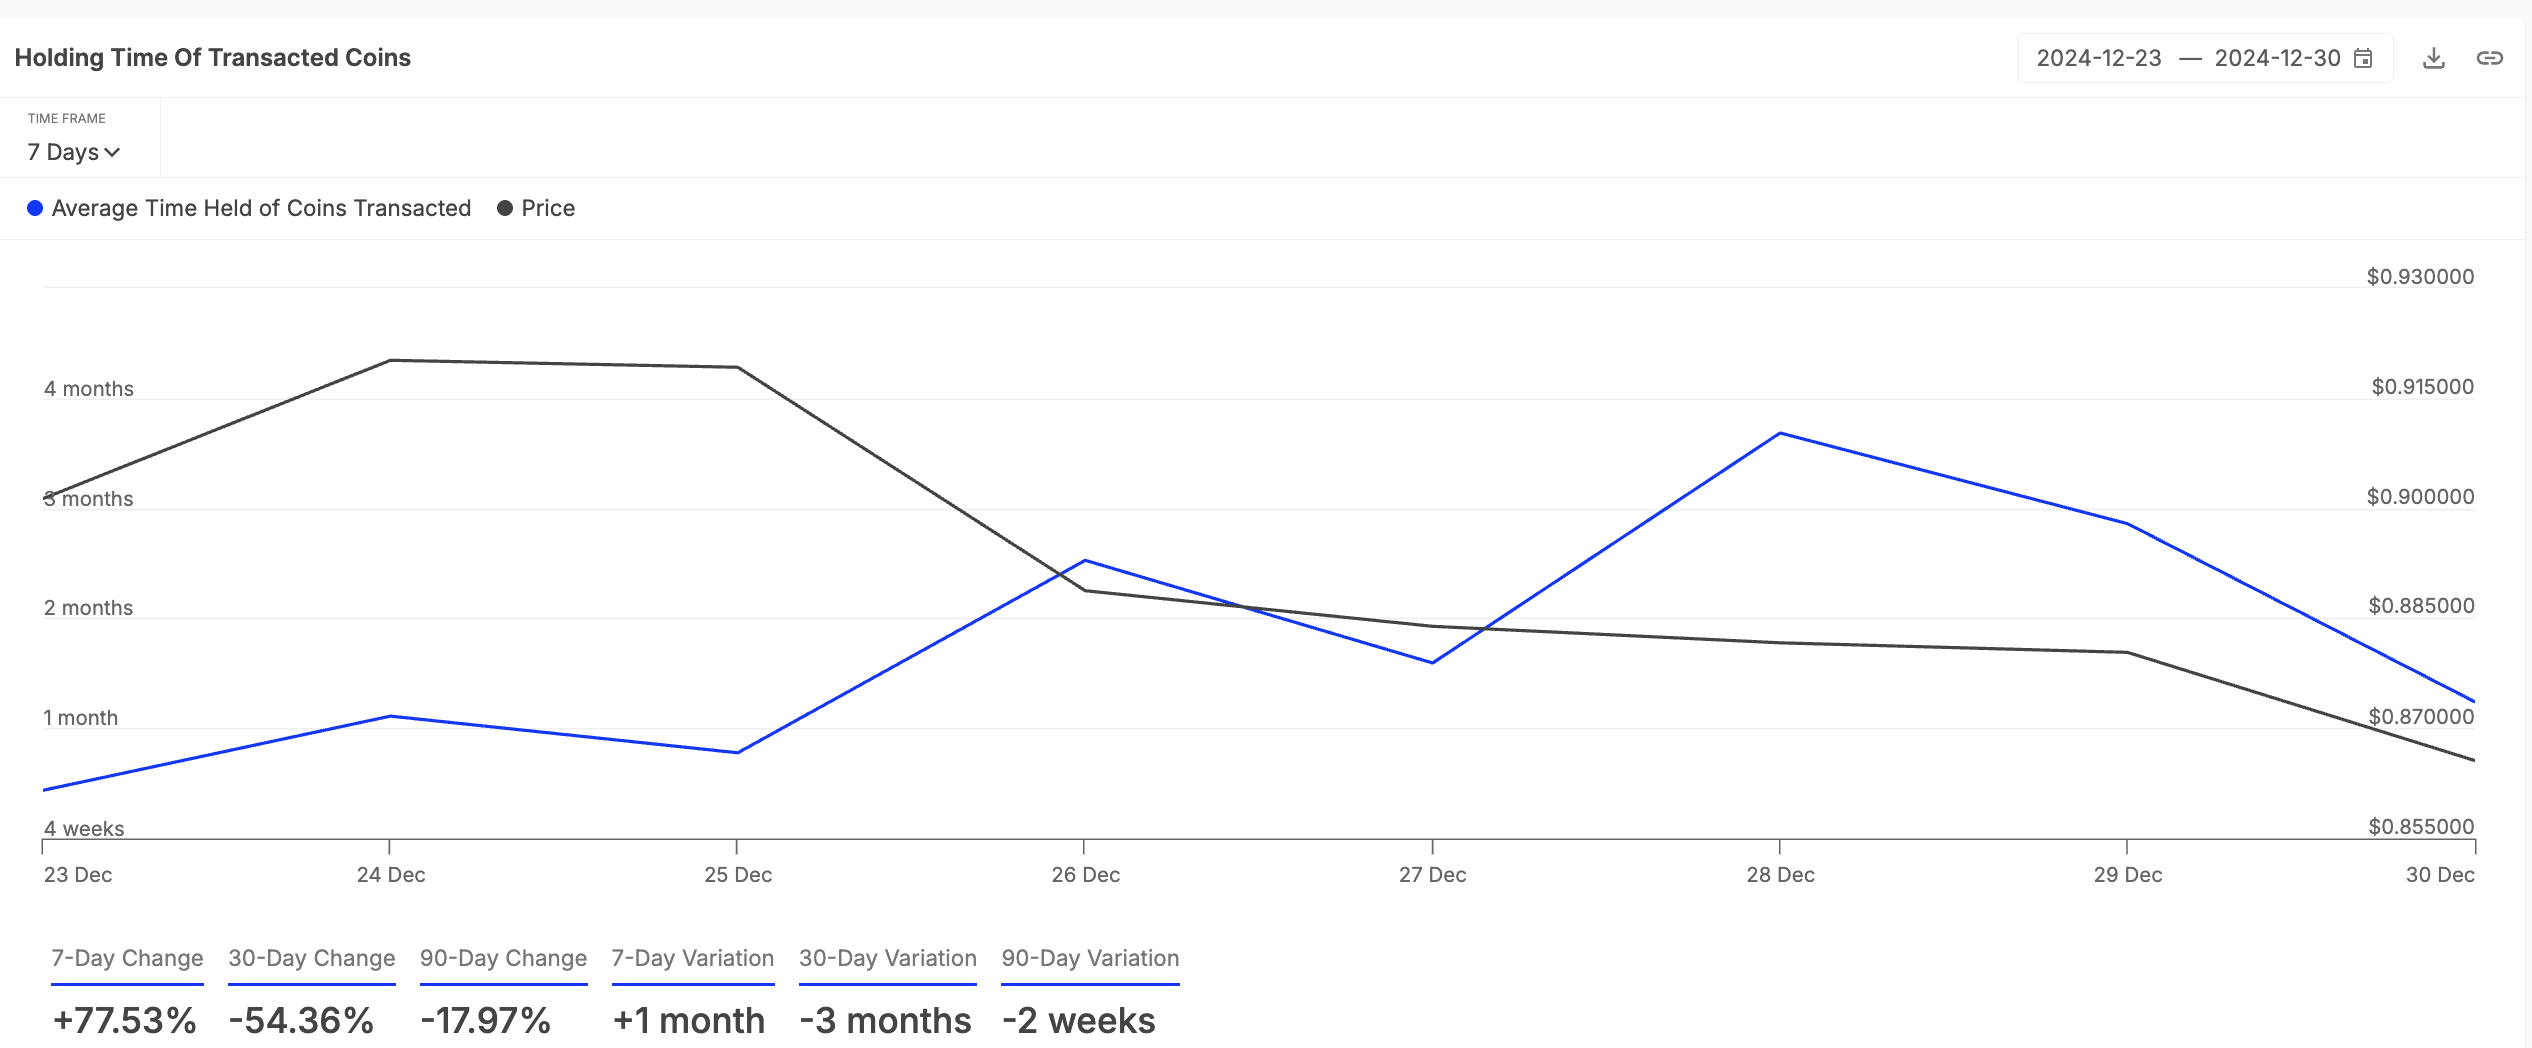
An asset’s holding time measures the average duration its coins/tokens are held before being sold or transferred. This bullish trend marks an ADA accumulation phase, with traders less inclined to sell.
It reflects strong investor conviction, as ADA investors choose to hold on to their coins rather than sell. Also, it could help reduce the selling pressure in the ADA market, driving up its value in the short term.
ADA Bulls Target Higher Gains
ADA trades at $0.76 as of this writing, extending its gains by 4% over the past day. On the daily chart, the coin’s Relative Strength Index (RSI) is in an upward trend at 52.11, confirming the buying activity.
The RSI indicator measures an asset’s overbought and oversold market conditions. It ranges between 0 and 100, with values above 70 indicating that the asset is overbought and due for a decline. Conversely, values below 30 indicate that an asset is oversold and due for a rebound.
At 52.11 and climbing, ADA’s RSI readings suggest strengthening bullish momentum as buying pressure builds. If accumulation continues, the coin’s price could reach $0.97.
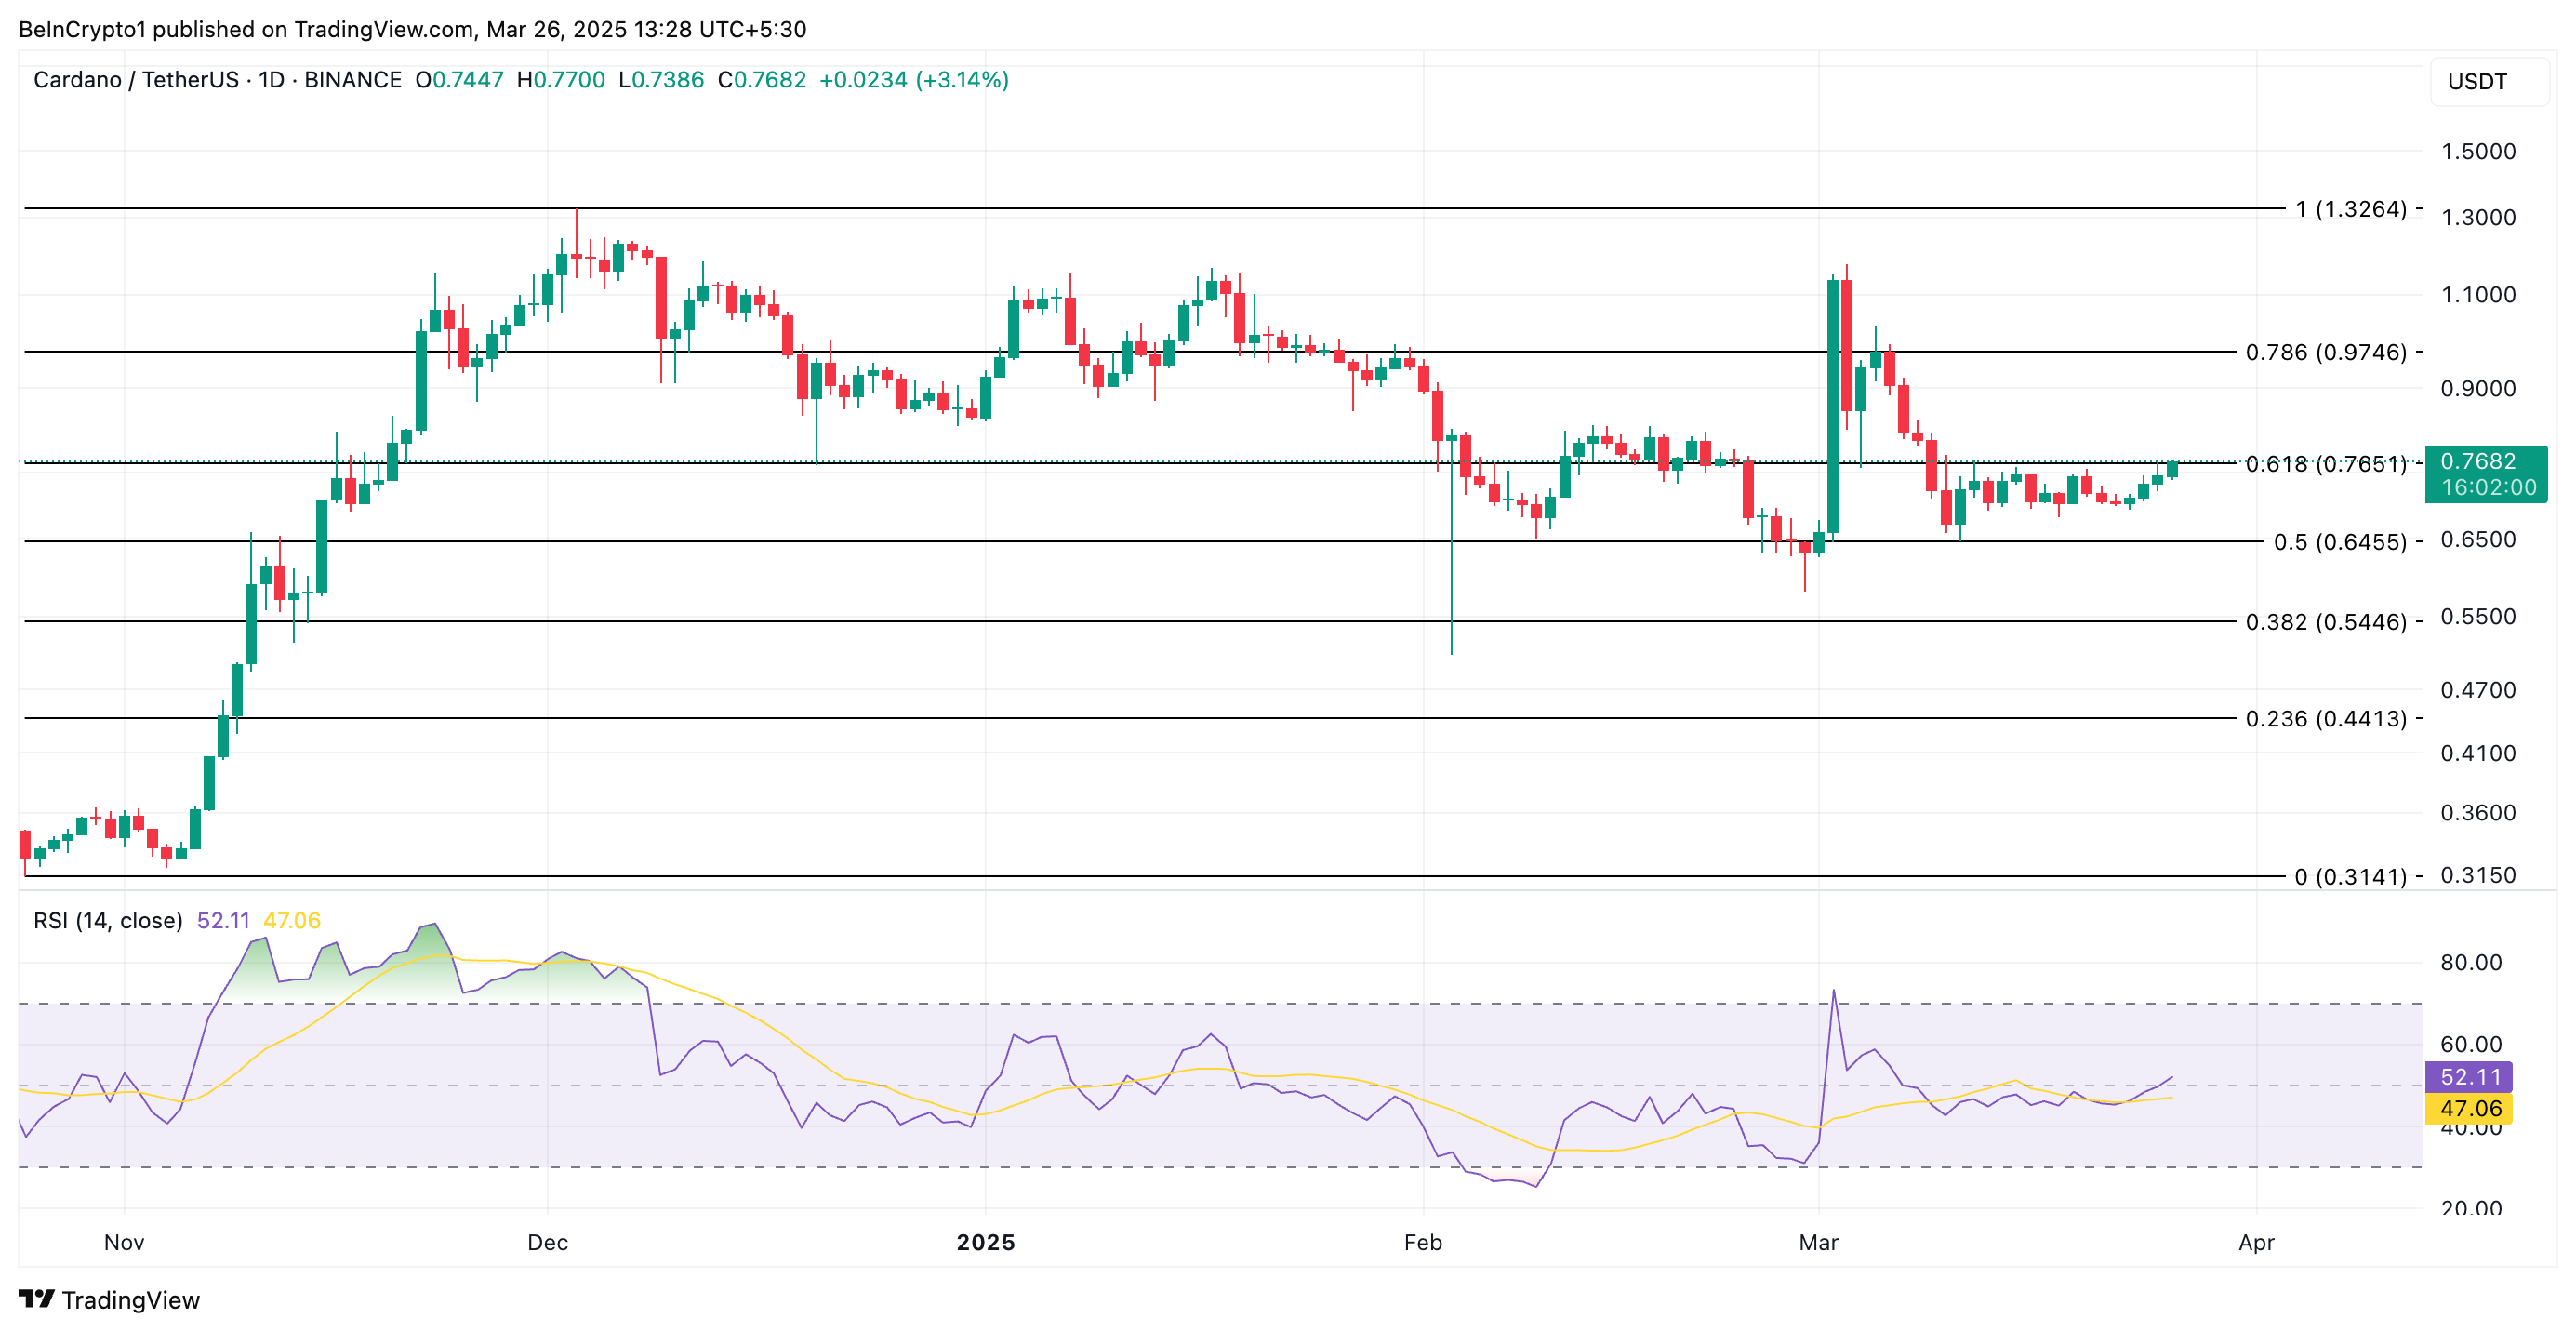
The meme coin market is witnessing the emergence of automated token launches with the help of Clanker. These meme coins are attracting the same interest from investors as traditional meme coins, so much so that even major CEXs like Coinbase are set to list one of them.
BeInCrypto has analyzed three clanker-based meme coins for investors to watch as these tokens’ market cap increased by 25% today.
tokenbot (CLANKER)
Launch Date – November 2024
Total Circulating Supply – 1 Million CLANKER
Maximum Supply – 1 Million CLANKER
Fully Diluted Valuation (FDV) – $53.59 Million
CLANKER has experienced a significant surge of 18% in the last 24 hours, following a 58% increase over the past five days. Currently trading at $53, the altcoin shows strong momentum and is likely to continue its upward trend as market sentiment remains positive.
The anticipated listing of CLANKER on Coinbase on April 23 is driving excitement. As the first major exchange listing for this meme coin, this event is expected to bring increased visibility and trading volume, potentially attracting more investors. The listing could serve as a key catalyst for further price growth.
With the Coinbase listing expected to generate attention, CLANKER’s price could rise toward the next resistance level of $67. However, if the listing fails to attract the expected hype, the meme coin could see a reversal, dropping to $42 or lower, especially if the $53 resistance is not breached.
BankrCoin (BNKR)
Launch Date – December 2024
Total Circulating Supply – 99.99 Billion BNKR
Maximum Supply – 100 Billion BNKR
Fully Diluted Valuation (FDV) – $18.54 Million
BNKR has surged by 36% in the last 24 hours, making it one of the top-performing tokens in the Clanker ecosystem. Trading at $0.0001913, it is holding just above the support level of $0.0001842, showing strong momentum in the short term. The altcoin remains on an upward trajectory.
To maintain its growth, BNKR must breach the resistance at $0.0002085. With continued support from the broader market, the meme coin could push towards $0.0002477, which would mark a new high. This could attract more investors and solidify its position in the Clanker ecosystem.
However, if BNKR fails to break the $0.0002085 resistance, it risks falling back through its current support of $0.0001842. This drop could bring the price down to $0.0001207, invalidating the bullish outlook and erasing recent gains for investors.
Small Cap Corner – Native (NATIVE)
Launch Date – December 2024
Total Circulating Supply – 98.99 Billion NATIVE
Maximum Supply – 100 Billion NATIVE
Fully Diluted Valuation (FDV) – $2.84 Million
NATIVE price has surged by 39% in the last 24 hours, reaching $0.00002846. The token is just below the resistance level of $0.00002849, showing strong short-term bullish momentum. If this trend continues, NATIVE could aim for higher targets, supported by ongoing market optimism and investor interest.
If the bullish momentum holds, NATIVE could break past the $0.00002849 resistance and climb towards $0.00003338. A successful rise beyond this level could fuel further price growth, providing the meme coin investors with significant returns.
However, if selling pressure increases and NATIVE fails to breach the $0.00002849 resistance, the price could drop back down to $0.00001695. This would invalidate the bullish outlook and erase recent gains, leaving the token vulnerable to further losses in the market.
TradFi’s relationship with Bitcoin continues to evolve, with 34 public corporations now holding a combined 699,387 BTC—worth over $72 billion. MicroStrategy remains the undisputed leader, holding 555,450 BTC alone.
While some view Bitcoin treasury strategies as bullish catalysts, the data tells a more nuanced story: adding BTC to a balance sheet isn’t a guaranteed stock booster. Outliers like Metaplanet have surged over 3,000% since their BTC entry, but many others have seen far more modest gains, or even declines.
Metaplanet Inc.
Metaplanet is a Japanese public company that has quickly transformed from a traditional business—formerly involved in hotel operations—into one of Asia’s most aggressive Bitcoin-focused firms. Its transformation shows how some TradFi players are reshaping their models around digital assets.
Since launching its Bitcoin Income Generation strategy in late 2024, the company has pivoted sharply toward crypto, with 88% of its Q1 FY2025 revenue—¥770 million ($5.2 million)—coming from Bitcoin option premium harvesting.
Metaplanet first added Bitcoin to its balance sheet in April 2024 and now holds 5,555 BTC worth approximately $576.8 million. Since that initial move, the company’s stock has soared over 3,000%, with recent filings showing a 15x increase in share price year-to-date.
The firm’s aggressive BTC accumulation strategy—targeting 10,000 BTC by year-end—has drawn growing investor interest, expanding its shareholder base by 500% in a year.
Despite short-term valuation losses due to Bitcoin price fluctuations, Metaplanet reported ¥13.5 billion in unrealized BTC gains as of May 12, signaling strong confidence in its long-term crypto positioning.
NEXON
Nexon, a major Japanese gaming company behind global hits like Dungeon&Fighter and MapleStory, added Bitcoin to its balance sheet in April 2021 and currently holds 1,717 BTC—worth approximately $178.3 million.
Despite this sizable allocation, the move hasn’t paid off in terms of market performance, as Nexon’s stock is down nearly 29% since the purchase, showing how, for many TradFi firms, crypto exposure doesn’t necessarily translate into equity gains.
Unlike other firms that saw major investor enthusiasm from Bitcoin exposure, Nexon’s value remains more closely tied to the performance of its gaming franchises.
In its Q1 2025 earnings report, Nexon reported revenue of ¥113.9 billion, up 5% year over year, and operating income jumping 43% to ¥41.6 billion, driven by strong performance from core titles and lower costs.
Semler Scientific (SMLR)
Semler Scientific made its first Bitcoin purchase in May 2024 and currently holds 1,273 BTC, valued at approximately $132.2 million.
Since adopting Bitcoin as its primary treasury reserve asset, the company’s stock has climbed over 55%.
While smaller in scale compared to top crypto treasury holders, Semler’s aggressive accumulation and performance have positioned it as a notable player in the Bitcoin corporate adoption narrative.
In its Q1 2025 earnings call, Semler Scientific reported a mixed performance. Revenue dropped 44% year-over-year to $8.8 million, driven by declines in its healthcare segment, while operating losses widened to $31.1 million amid $39.9 million in expenses.
A net loss of $64.7 million was largely due to an unrealized loss of $41.8 million from Bitcoin price fluctuations.
Despite these setbacks, the company reaffirmed its commitment to expanding its BTC holdings through a $500 million ATM program and a $100 million convertible note.
Tesla (TSLA)
Tesla, led by Elon Musk, has had a complex and headline-grabbing relationship with Bitcoin since adding it to its balance sheet in January 2021.
Musk, a long-time crypto enthusiast, has influenced market sentiment through both Tesla’s actions and his personal commentary on digital assets like BTC and Dogecoin. Tesla’s stock is up 34% since that initial Bitcoin buy, but the path has been volatile—peaking near $480 in late 2024 before collapsing below $107 in early 2023.
Despite the swings, Musk’s Bitcoin advocacy and Tesla’s early crypto exposure helped position the company as a bellwether for institutional adoption of crypto. Its journey reflects the volatility and complexity of crypto exposure within large TradFi companies, as BTC is up 212% in the same period.
In its latest Q1 2025 earnings, however, Tesla posted disappointing results. Automotive revenue dropped 20% year-over-year to $14 billion, dragging total revenue down 9% to $19.34 billion, well below Wall Street estimates.
Net income plummeted 71% to $409 million, and operating margin collapsed to 2.1% as production upgrades, price cuts, and political uncertainty—including rising tariffs—weighed heavily on performance.
Amid declining deliveries and intensifying global competition, Tesla highlighted progress in energy storage and AI infrastructure.
Still, with shares down 41% year-to-date and Musk’s growing political involvement drawing further scrutiny, investors remain cautious as the company prepares for a potential robotaxi launch in June.
Block Inc. (Formerly Square)
Block Inc., co-founded by Jack Dorsey, added Bitcoin to its balance sheet in October 2022 and currently holds 8,485 BTC, worth approximately $881 million.
Known for its early embrace of Bitcoin and crypto integration through Cash App, Block has positioned itself as one of the most prominent corporate Bitcoin holders.
Since its initial BTC acquisition, the stock has risen just 3.8%, reflecting a turbulent journey, peaking above $100 in December 2024, but also dropping to around $38.5 in November 2023 amid broader tech sector volatility and macroeconomic headwinds for TradFi.
Block’s Q1 2025 earnings revealed a mixed picture. The company missed both revenue and profit expectations, posting $5.77 billion in revenue versus the $6.2 billion expected.
Despite a 9% rise in gross profit to $2.29 billion, guidance for the rest of the year was cut due to macro uncertainty, including the impact of new tariffs.
Cash App’s gross profit rose 10% to $1.38 billion, thanks to the launch of Afterpay’s buy-now-pay-later feature and the expansion of its lending program under FDIC approval.
However, gross payment volume increased, and international exposure now accounts for 18% of the total volume.
While Block posted its most profitable quarter to date, shares are down 31% year-to-date, and investors remain cautious as the company prepares to deliver its first Bitcoin mining chips later this year.
Ethereum (ETH) has been struggling, down nearly 30% over the past 30 days as bearish sentiment continues to weigh on the asset. Over the last week, ETH has remained stuck below the $2,000 mark, unable to regain key resistance levels.
While some indicators, like BBTrend, are showing early signs of stabilization, whale activity points to cautious behavior among large investors. As Ethereum trades near critical support zones, the market is watching closely to see if the downtrend will deepen or if bulls can stage a meaningful recovery.
BBTrend Is Now Positive After 6 Days, But Still At Modest Levels
Ethereum’s BBTrend indicator is currently sitting at 0.22, having just turned positive after spending six consecutive days in negative territory.
During that stretch, it reached a negative peak of -17.68 on March 13, reflecting strong bearish momentum.
This shift marks a potential early sign of stabilization for Ethereum. The indicator has crossed back above zero, signaling that sellers may be losing control in the short term, as Ethereum network activity recently hit yearly lows.
BBTrend, or Bollinger Band Trend, is a momentum-based indicator that measures the strength and direction of a price trend relative to its Bollinger Bands. Readings below 0 typically suggest bearish conditions, while readings above 0 indicate bullish momentum.
Thresholds around -10 or +10 often highlight periods of stronger trend conviction. Ethereum’s BBTrend is now back in positive territory after a prolonged bearish phase, suggesting that downward pressure is easing.
However, at just 0.22, the indicator is still at low levels, signaling that while the sell-off might be cooling, the market has yet to transition into a strong bullish trend fully.
Whales Are Not Accumulating Ethereum
The number of Ethereum whales—wallets holding at least 1,000 ETH—has been steadily declining since February 22, after peaking at 5,828 addresses.
This gradual reduction in large holders points to a cautious approach among key players. Some whales are reducing their exposure or taking profits as Ethereum’s price action remains mixed.
Tracking whale behavior is crucial because these large addresses often act as market movers, capable of influencing price trends through their buying or selling activity.
A steady decline in Ethereum whale numbers may suggest waning confidence or a shift toward risk-off sentiment among institutional or high-net-worth investors.
This downward trend in whale accumulation could limit the strength of any potential rallies, as fewer large players are positioned to provide strong buying support in the short term.
Will Ethereum Fall Below $1,700 In March?
Ethereum has been under pressure, trading below the $2,000 mark for the past seven days. Sellers have kept the asset pinned beneath key resistance levels.
The current support stands at $1,823, and if this level is tested and broken, Ethereum could decline further toward $1,759 and potentially fall below $1,700 for the first time since October 2023, despite some experts defending its future echoes early Amazon and Microsoft.
However, if Ethereum’s price manages to stabilize and build an uptrend, it could challenge the immediate resistance at $1,956.
A breakout above this level may open the path for a rally toward $2,106, with further bullish momentum potentially pushing ETH to retest $2,320 and even $2,546.
A break above $2,500 would mark the first time Ethereum reclaims that level since March 2, signaling a notable shift in market confidence and buyer strength.