Amid market uncertainty, Cardano (ADA) has been consolidating in a tight range over the past few days near a crucial level, creating a make-or-break situation. For the past 11 days, ADA has been fluctuating between $0.70 and $0.74, now testing the lower boundary of this range.
ADA’s Current Price Momentum
Besides this consolidation, ADA’s current price is also supported by an ascending trendline that has been intact since the beginning of March 2025. The asset is currently trading near $0.71 and has registered a modest price surge of over 0.50% in the past 24 hours.
Cardano (ADA) Technical Analysis and Key Levels
According to expert technical analysis, ADA is already forming a symmetrical triangle pattern alongside its ongoing consolidation. If the asset breaks out of this pattern and closes a four-hour candle above the $0.74 level, there is a strong possibility it could breach the consolidation and surge by 15% to reach the $0.85 mark.
Source: Trading View
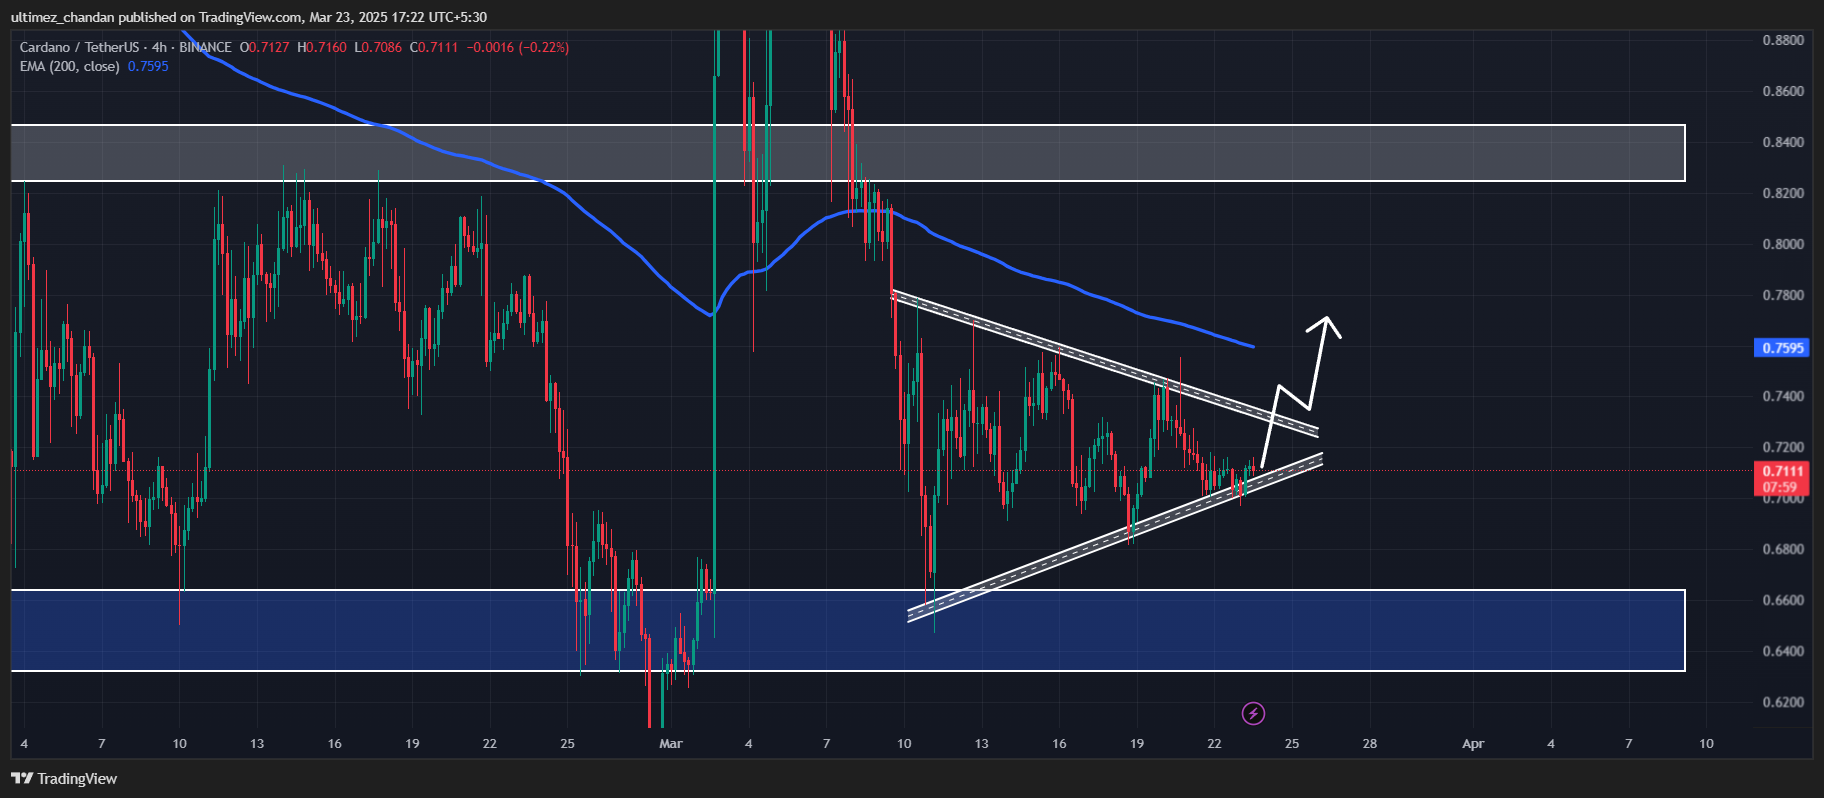
As of now, the asset holds the potential to rise by 3%, meaning it could easily reach the $0.736 level. This prediction applies to a lower time frame. However, on a higher time frame, ADA’s daily chart suggests that a major rally will only begin once the asset closes a daily candle above the $0.85 level.
With the ongoing bearish market sentiment and an unclear pattern, traders and investors seem to be participating less in ADA, resulting in a record drop in trading volume, as reported by the on-chain analytics firm Santiment.
Source: Santiment
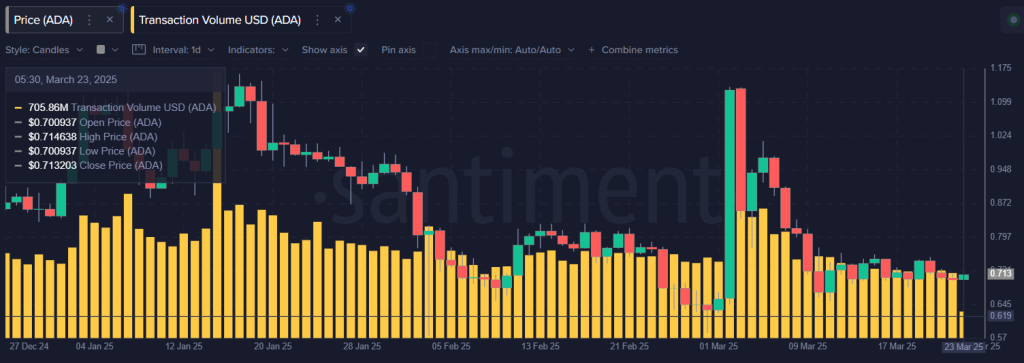
Data reveals that the asset’s trading volume is at its lowest since the beginning of 2025. Moreover, in the past 24 hours, the volume has dropped further by 15%.
While investors scan the horizon for an official announcement from World Liberty Financial (WLFI) over its USD1 stablecoin, on-chain data indicates significant activity. The USD1 stablecoin has recorded a daily trading volume of nearly $44 million following a soft listing on BSC and Ethereum.
USD1 Stablecoin Records $44 Million In Daily Trading Volume
According to data from Coingecko, USD1 stablecoin has recorded frenetic activity levels over the last 24 hours. Data from the crypto data aggregator, USD1 stablecoin has garnered a daily trading volume of $44.8 million over the last day.
The surge in daily transaction activity comes in the absence of an official exchange listing announcement of USD1 stablecoin. However, USD1 tokens are raking up impressive numbers following the soft launch on decentralized exchanges like PancakeSwap V3 on BSC. On-chain data reveals that the most active trading pair on PancakeSwap V3 is the USD1/WBNB with volumes of nearly $22 million.
Despite the 43,714% spike in daily transaction activity, total supply sits at just over the $7 million mark. WLFI cofounder ZachWitkoff reposted a tweet alluding to the soft launch of the USD1 stablecoin on Ethereum and BNB Chain.
“The stablecoin USD1, created by the WLFI ecosystem, has recorded $45 million in volume within its first 24 hours live,” wrote the pseudonymous Notaz.Sol on X. “Now available on BNB Chain and Ethereum, the strong debut signals growing interest and demand for USD1.”
USD1’s daily trading volume spike follows an airdrop proposal for WLFI holders early in the week in an attempt to drive adoption metrics.
When Will WLFI Announce An Official Exchange Listing?
Weeks after WLFI percolated the ecosystem with the announcement of USD1, the stablecoin is yet to make its debut on centralized exchanges. The delay in listing continues to stump investors but recent on-chain transaction volume indicates a major listing announcement is imminent.
A previous listing date prediction for USD1 fell through but enthusiasm is still running high for community members. Since the April 1 prediction did not pan out, eyes are fixed for a listing announcement before the end of April.
However, pseudonymous crypto analyst xHuai.eth opines that the listing will likely coincide with the passing of a new stablecoin bill in the US. Flowing from the official announcement for the USD1 stablecoin, the technical aspect for the listing is covered with Ethereum and BNB Chain tapped for launch, hinting at a potential listing.
USD1 is racing against other industry firstmovers like USDC and USDT and an early listing will give it an edge to snag a slice of the market share.
Bitcoin price consolidates above the $84,600 on Sunday, April 20. Having closed eight consecutive sessions above the $80,000 mark, on-chain data trends suggest BTC market outlook for the week ahead remains bullish despite regulatory pressures on Coinbase.
Oregon State to Sue Coinbase as Bitcoin Price Holds Above $80,000 for Consecutive Days
Oregon Attorney General Dan Rayfield has filed a securities enforcement action against Coinbase, alleging that the exchange facilitated the sale of unregistered crypto assets, exposing investors to significant risk.
In the lawsuit, Oregon state alleges that Coinbase has encouraged the sale of unregistered cryptocurrencies to people in Oregon exposing residents to risk of pump-and-dump schemes and fraud.
“After building trust with Oregon consumers, Coinbase sold high risk investments without them being properly vetted to protect consumers Oregonians lost money, and we believe Coinbase should be held accountable and take steps to protect consumers.”
The complaint accuses Coinbase of misleading consumers in Oregon by offering high-risk digital assets without sufficient oversight.
In response, Coinbase’s Chief Legal Officer, Paul Grewal, called the suit a “desperate scheme” and “a giant leap backwards” in crypto policy progress.
Despite this legal headwind, Bitcoin has remained resilient. Following a sharp decline to $74,300 on April 9, triggered by China’s new tariffs on U.S. tech, BTC swiftly rebounded after the U.S. Consumer Price Index for March came in lower than expected.
Bitcoin price action, April 20, 2025 | Source: Coingecko
Bitcoin price is trading at $84,500 at press time on April 20, having closed above $83,000 for eight consecutive trading sessions.
This steady uptrend, even in the face of a fresh regulatory attack, suggests that the market sees the lawsuit as isolated to Coinbase—not a major threat to Bitcoin’s near-term price prospects. With continued institutional interest and technical strength holding above key support, BTC price appears poised to maintain positive momentum in the week ahead
BTC Showing Resilience to U.S. Pressures
Bitcoin’s recent price action showcases strength relative to U.S. equities, particularly in the tech sector.
While flagship stocks such as NVIDIA and Microsoft grapple with declining investor sentiment, Bitcoin continues to draw inflows and sustain support.
US Tech Stocks Heatmap, April 20| Source: TradingView
NVIDIA shares dropped over 7% this week following a $5.5 billion charge related to China export compliance. The erasing billions in market capitalization for adjacent US tech stocks including Microsoft, Tesla, and Apple.
Against this backdrop, Bitcoin has appreciated nearly 12% since April 12.
More so, Lower-than-expected jobless claims last week increased pressure on the Fed to maintain a hawkish stance—yet BTC has continued its upward trajectory, bucking the risk-off trend.
This decoupling signals renewed investor conviction in Bitcoin as a long-term macro asset, especially as U.S. fiscal policy and central bank dynamics introduce heightened volatility to traditional markets.
Investors Pull 14,000 BTC from Exchanges in the Last 8 Days as BTC Sets Up Local Bottom
A critical on-chain indicators supporting the current BTC rally is the notable drop in exchange-held Bitcoin.
Data from CryptoQuant shows that more than 14,000 BTC have been withdrawn from centralized exchanges since April 12, aligning with the day Bitcoin reclaimed the $80,000 level.
Bitcoin Price vs. BTC Exchange Reserves, April 2025 | Source: CryptoQuant
These outflows suggest increasing long-term conviction among holders, reducing available supply for trading and heightening the potential for price appreciation. Historically, sustained withdrawal activity often marks local bottoms and preludes major bullish cycles.
The drop in exchange balances comes at a time of increased spot demand—especially with platforms like Charles Schwab signaling intentions to enter direct crypto spot trading.
As regulatory uncertainty begins to decouple from Bitcoin’s price performance, investors appear to be front-running the next wave of institutional participation.
In conclusion, while the Oregon lawsuit against Coinbase may create noise in the short term, Bitcoin’s structural and technical foundation remains intact. A continued consolidation above $83,000—paired with supply contraction and strong macro divergence—puts the $90,000 and $100,000 targets well within reach for Q2.
Bitcoin price is consolidating below a descending trendline resistance near $85,489, with short-term support from the 4-day SMA at $84,632. As see in the Bitcoin price forecast chart below, BTC has formed a coiling pattern with higher lows and marginally lower highs—often a prelude to a decisive breakout.
On April 20, BTC closed at $84,594, holding above the critical $84K level for the eighth consecutive session, suggesting persistent underlying demand.
Bitcoin Technical Analysis Today
The Average Daily Range (ADR) remains muted at 3.06, indicating consolidation but also priming BTC for a potential expansion in volatility.
Meanwhile, the bullish BBP (Buy Balance Power) reading at 1,553.76 reinforces near-term strength, showing that buying momentum is outpacing sell pressure. Volume has declined modestly, but the broader context of consistent closes above $83,000 reflects solid market absorption.
Bitcoin price forecast today leans bullish as the 4-day SMA trends above price, creating a compression zone between it and the 60-SMA. A daily candle close above $85,500 could confirm a breakout, targeting $88,000 short term. Failure to hold $84,000 would re-expose $82,300 as interim support.
The market sentiments, specifically with the memecoins, have been witnessing quick shifts, following the BTC price rally. Moreover, they attract more bullish and bearish activity compared to Bitcoin, keeping the next price action shady. Currently, the popular memecoins like Pepe, Fartcoin, FLOKI, etc., and a few more have been demonstrating significant strength. But the question remains whether the rise is short-lived.
Fartcoin (FARTCOIN) Price Analysis
The FARTCOIN price is undergoing a parabolic recovery since the start of March but has been failing to surpass the crucial resistance at $0.98 since the start of the month
The volume has dropped significantly which has drag the volatility lower, preventing the price from rising above the pivotal resistance
The MACD was about to undergo a bearish crossover but the MACD line is trying hard to rise above the Signal line, as the bulls regain strength
On the other hand, the +Di & -Di have diverged, which were heading for a bearish crossover, flashing bullish possibilities
The technicals are turning bullish but as long as the volume remains drained, the FARTCOIN price may continue to consolidate around $0.9.
Pepe (PEPE) Price Analysis
The PEPE price has rebounded from the local bottoms for the second consecutive time, forming a double-bottom pattern
Despite a drop in the volume, the buyers remain dominant, keeping the bullish possibilities alive
The RSI is approaching the crucial barrier and may even surpass for the first time this year, which is believed to elevate the levels above the bearish range
On the other hand, the MACD, which is bullish is about to rise into the positive range, substantiating the bullish claim
Therefore, the PEPE price is believed to keep rising and reach the crucial resistance zone between $0.00000878 and $0.0000090. A breakout out from here may pave way for the token to squash a zero from it’s value
FLOKI Price Analysis
The FLOKI price had dropped below the descending parallel channel and had formed another parallel channel; however, the recent rise has elevated the levels within the upper channel
The Bollinger bands have begun to go parallel, suggesting a drop in the volatility, which may result in a squeeze and, in turn, a bullish breakout
Meanwhile, the RSI is rising and is trying to surpass the average zone, which could push the price close to the resistance at $0.0000068
Therefore, the FLOKI price appears to be self-assured of maintaining a strong ascending trend and reaching $0.00001 soon
The post Memecoins Break Out as Bitcoin Surges—Should You be Optimistic on Fartcoin, Pepe & FLOKI? appeared first on Coinpedia Fintech News
The market sentiments, specifically with the memecoins, have been witnessing quick shifts, following the BTC price rally. Moreover, they attract more bullish and bearish activity compared to Bitcoin, keeping the next price action shady. Currently, the popular memecoins like Pepe, Fartcoin, FLOKI, etc., and a few more have been demonstrating significant strength. But the question …