Cardano (ADA) is down more than 6% on Thursday but remains up nearly 40% over the past seven days. After surging to $1.15 following its inclusion in the US crypto strategic reserve, ADA has struggled to stay above $1 in recent days.
Some users are now questioning its inclusion in the reserve, raising concerns about its price. With whale accumulation slowing and resistance at $1 proving difficult to break, ADA’s next move will depend on whether bullish momentum can return or if selling pressure pushes it lower.
ADA ADX Shows The Uptrend Is Still Strong, But It’s Not As Strong As Before
Cardano has an ADX of 32.5, down from 43.7 three days ago, following a price surge driven by ADA’s inclusion in the US crypto strategic reserve.
Despite the decline in ADX, it remains above the 25 threshold, indicating that the ongoing uptrend still has strength, though momentum has slightly weakened.
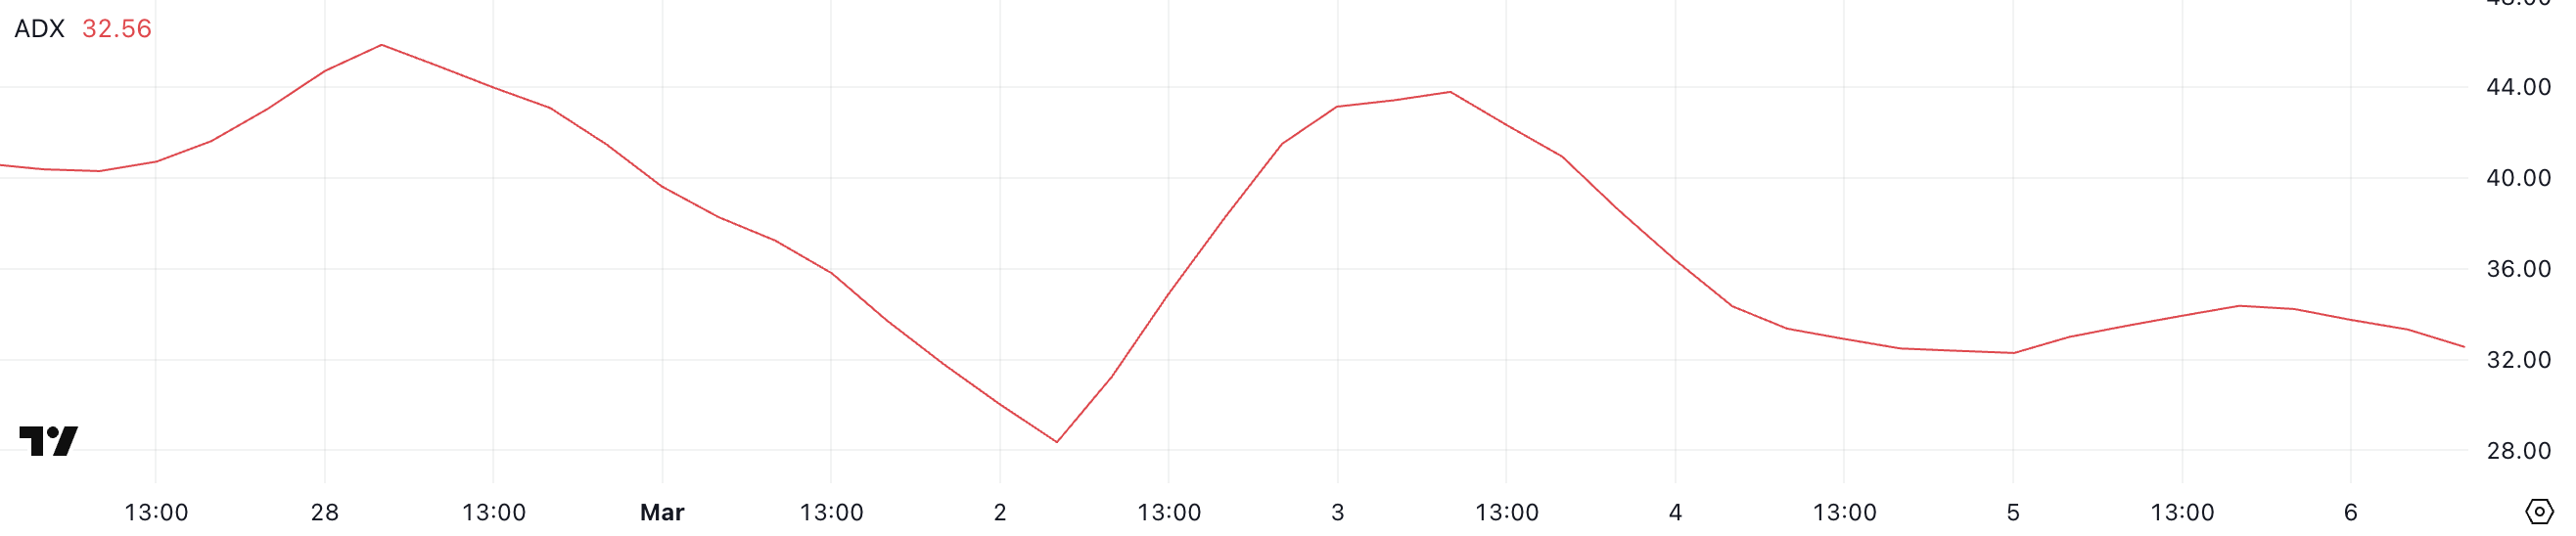
The Average Directional Index (ADX) measures trend strength on a scale from 0 to 100, with readings above 25 signaling a strong trend and values below 20 suggesting weak or nonexistent momentum.
With ADA in an uptrend and ADX at 32.5, the trend remains intact but may not be as strong as it was three days ago.
If ADX continues to decline, the trend could lose momentum, leading to a potential slowdown or consolidation. However, if ADX stabilizes or rises again, ADA could maintain its upward trajectory and push toward new resistance levels.
Cardano Whales Are Not Accumulating
The number of Cardano whales – addresses holding between 1 million and 10 million ADA – has declined slightly in the past few days after a strong increase between March 1 and March 4, when it rose from 2,442 to 2,471.
The count now stands at 2,463, indicating that some large holders have reduced their positions following the recent surge. This may have been influenced by the crypto community questioning the inclusion of ADA and XRP in the US crypto strategic reserve.

Tracking these whales is important because large holders can influence market liquidity, volatility, and price trends. A rising number of whales often signals accumulation, which can drive prices higher, while a decline suggests potential profit-taking or reduced confidence.
With the current whale count slightly below its recent surge, ADA’s recent uptrend could slow if more large holders begin selling. However, if accumulation resumes, it could support continued price gains.
Will Cardano Test $1 Soon?
Cardano’s EMA lines indicate a bullish trend, with short-term EMAs positioned above long-term ones.
However, despite this positive setup, Cardano price has struggled to break above $1 in recent days after a sharp correction following its 71% surge on March 2. This suggests that while momentum remains intact, resistance at $1 is proving difficult to overcome.
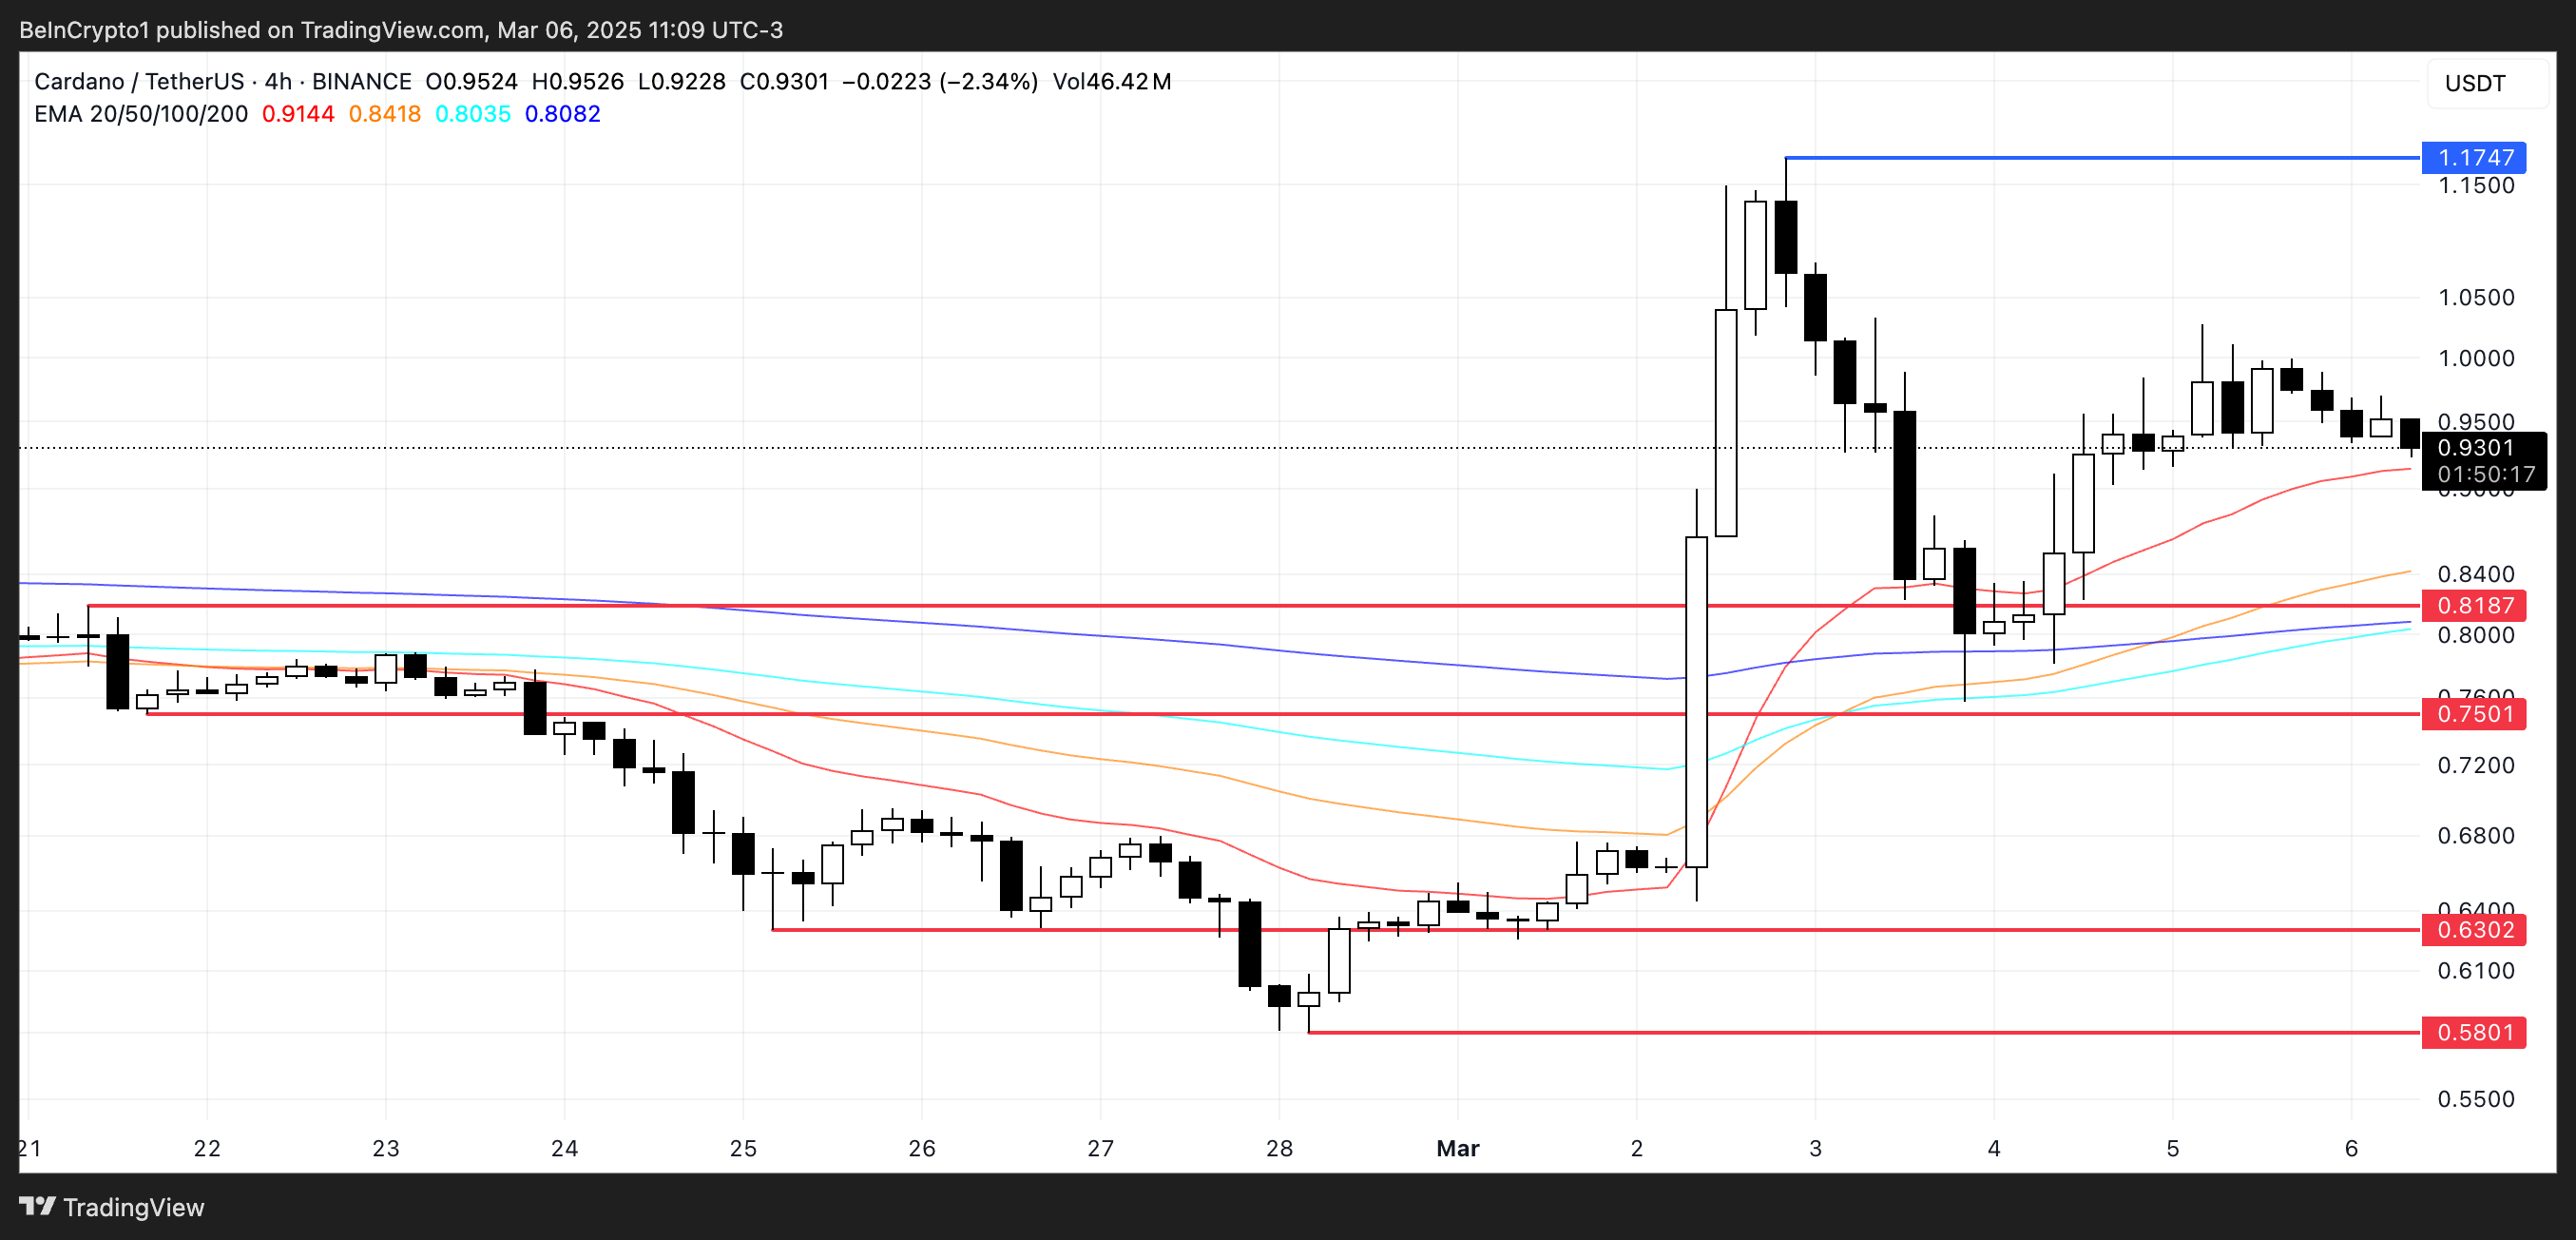
If the current uptrend reverses into a downtrend, ADA could test support at $0.818, with a break below that level potentially leading to $0.75. A stronger selloff could push the price as low as $0.63 or even $0.58.
On the other hand, if ADA regains momentum, it could test $1 again, and a breakout above this key resistance could send the price toward $1.17, a level it nearly reached during the March 2 surge.
The post Cardano (ADA) Might Struggle to Retain $1 Amid US Reserve Debate appeared first on BeInCrypto.