The broader crypto market has had a rocky start to August, but the HBAR price has shown signs of resilience. The token is up over 4% in the last 24 hours and holds monthly gains above 60%, with a 3-month performance still up by more than 43%.
Despite the volatility, the broader uptrend remains intact. The key question now is: can HBAR translate its on-chain strength into a technical breakout?
Sustained Outflows Point to Holder Confidence
HBAR has recorded two consecutive weeks of strong negative net flows: –$46.49 million and –$40.85 million. This indicates a clear trend of tokens being pulled off exchanges, typically a bullish sign, reflecting investor confidence and a reduced likelihood of immediate sell pressure.
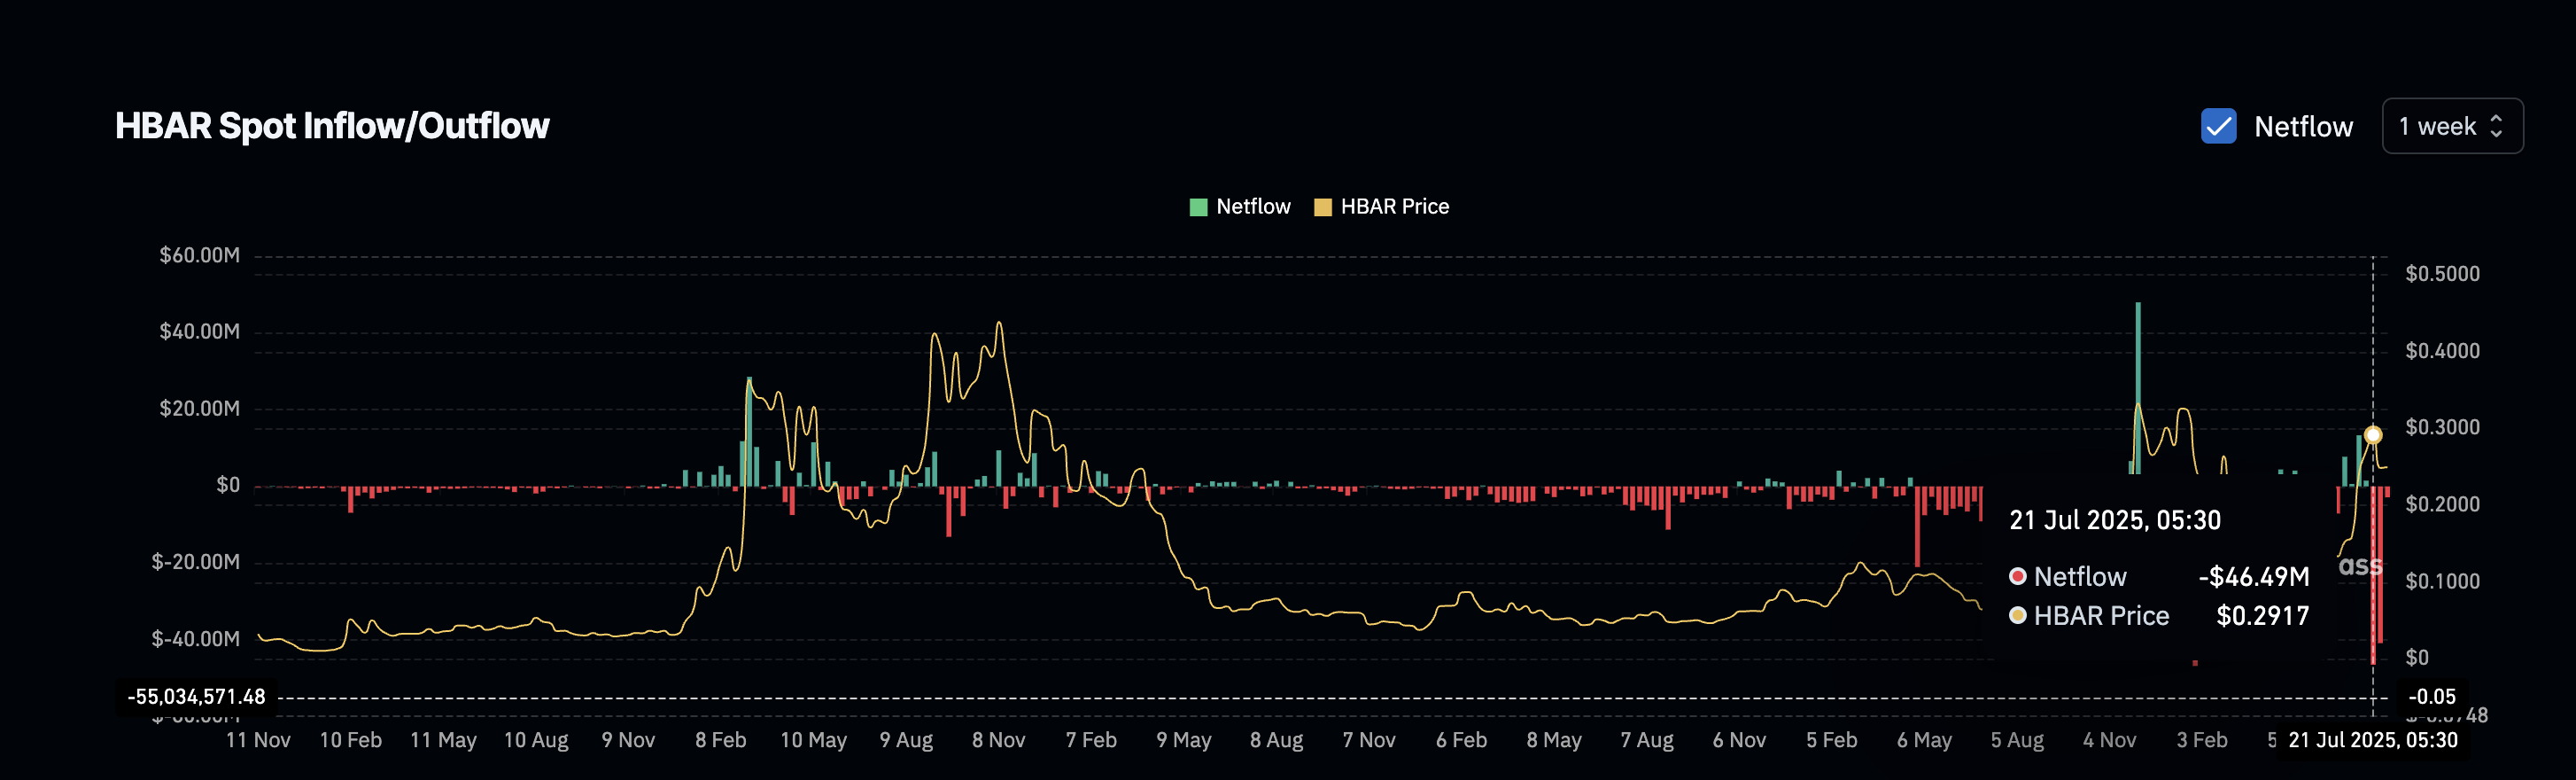
The new week has just started, and traders should keep an eye on the next set of outflows. A third week of negative netflows would further add weight to the accumulation pattern.
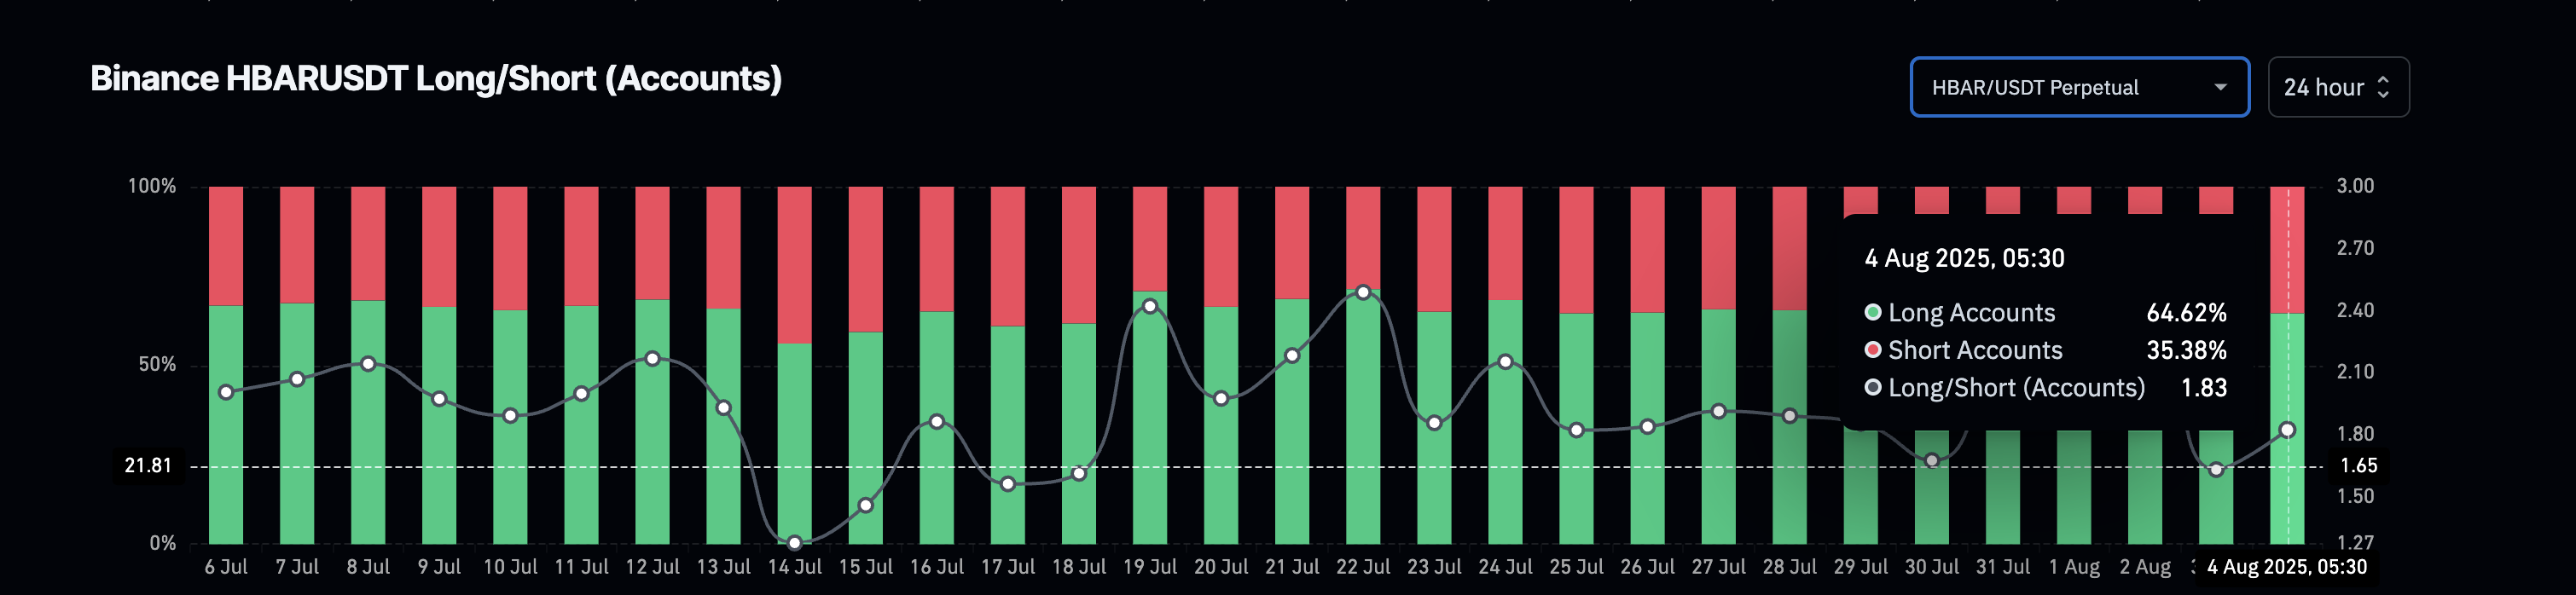
Supporting this is the long-short account ratio from Binance, which sits near 1.83. That means nearly two-thirds of the accounts trading HBAR are positioned long. Unlike long/short volume ratios that track trade sizes, this metric reflects how many traders are betting on price gains. Taken together, the steady outflows and the high long account dominance validate a bullish undercurrent in the market structure.
For token TA and market updates: Want more token insights like this? Sign up for Editor Harsh Notariya’s Daily Crypto Newsletter here.
Short-Term RSI Divergence Suggests Bullish Continuation
To get an early read on momentum, we move to the 4-hour chart, ideal for capturing near-term trend shifts. Between August 1 and August 4, the price formed a marginally lower high ($0.255 to $0.253), but RSI (Relative Strength Index) surged from 42 to 52 over the same period.
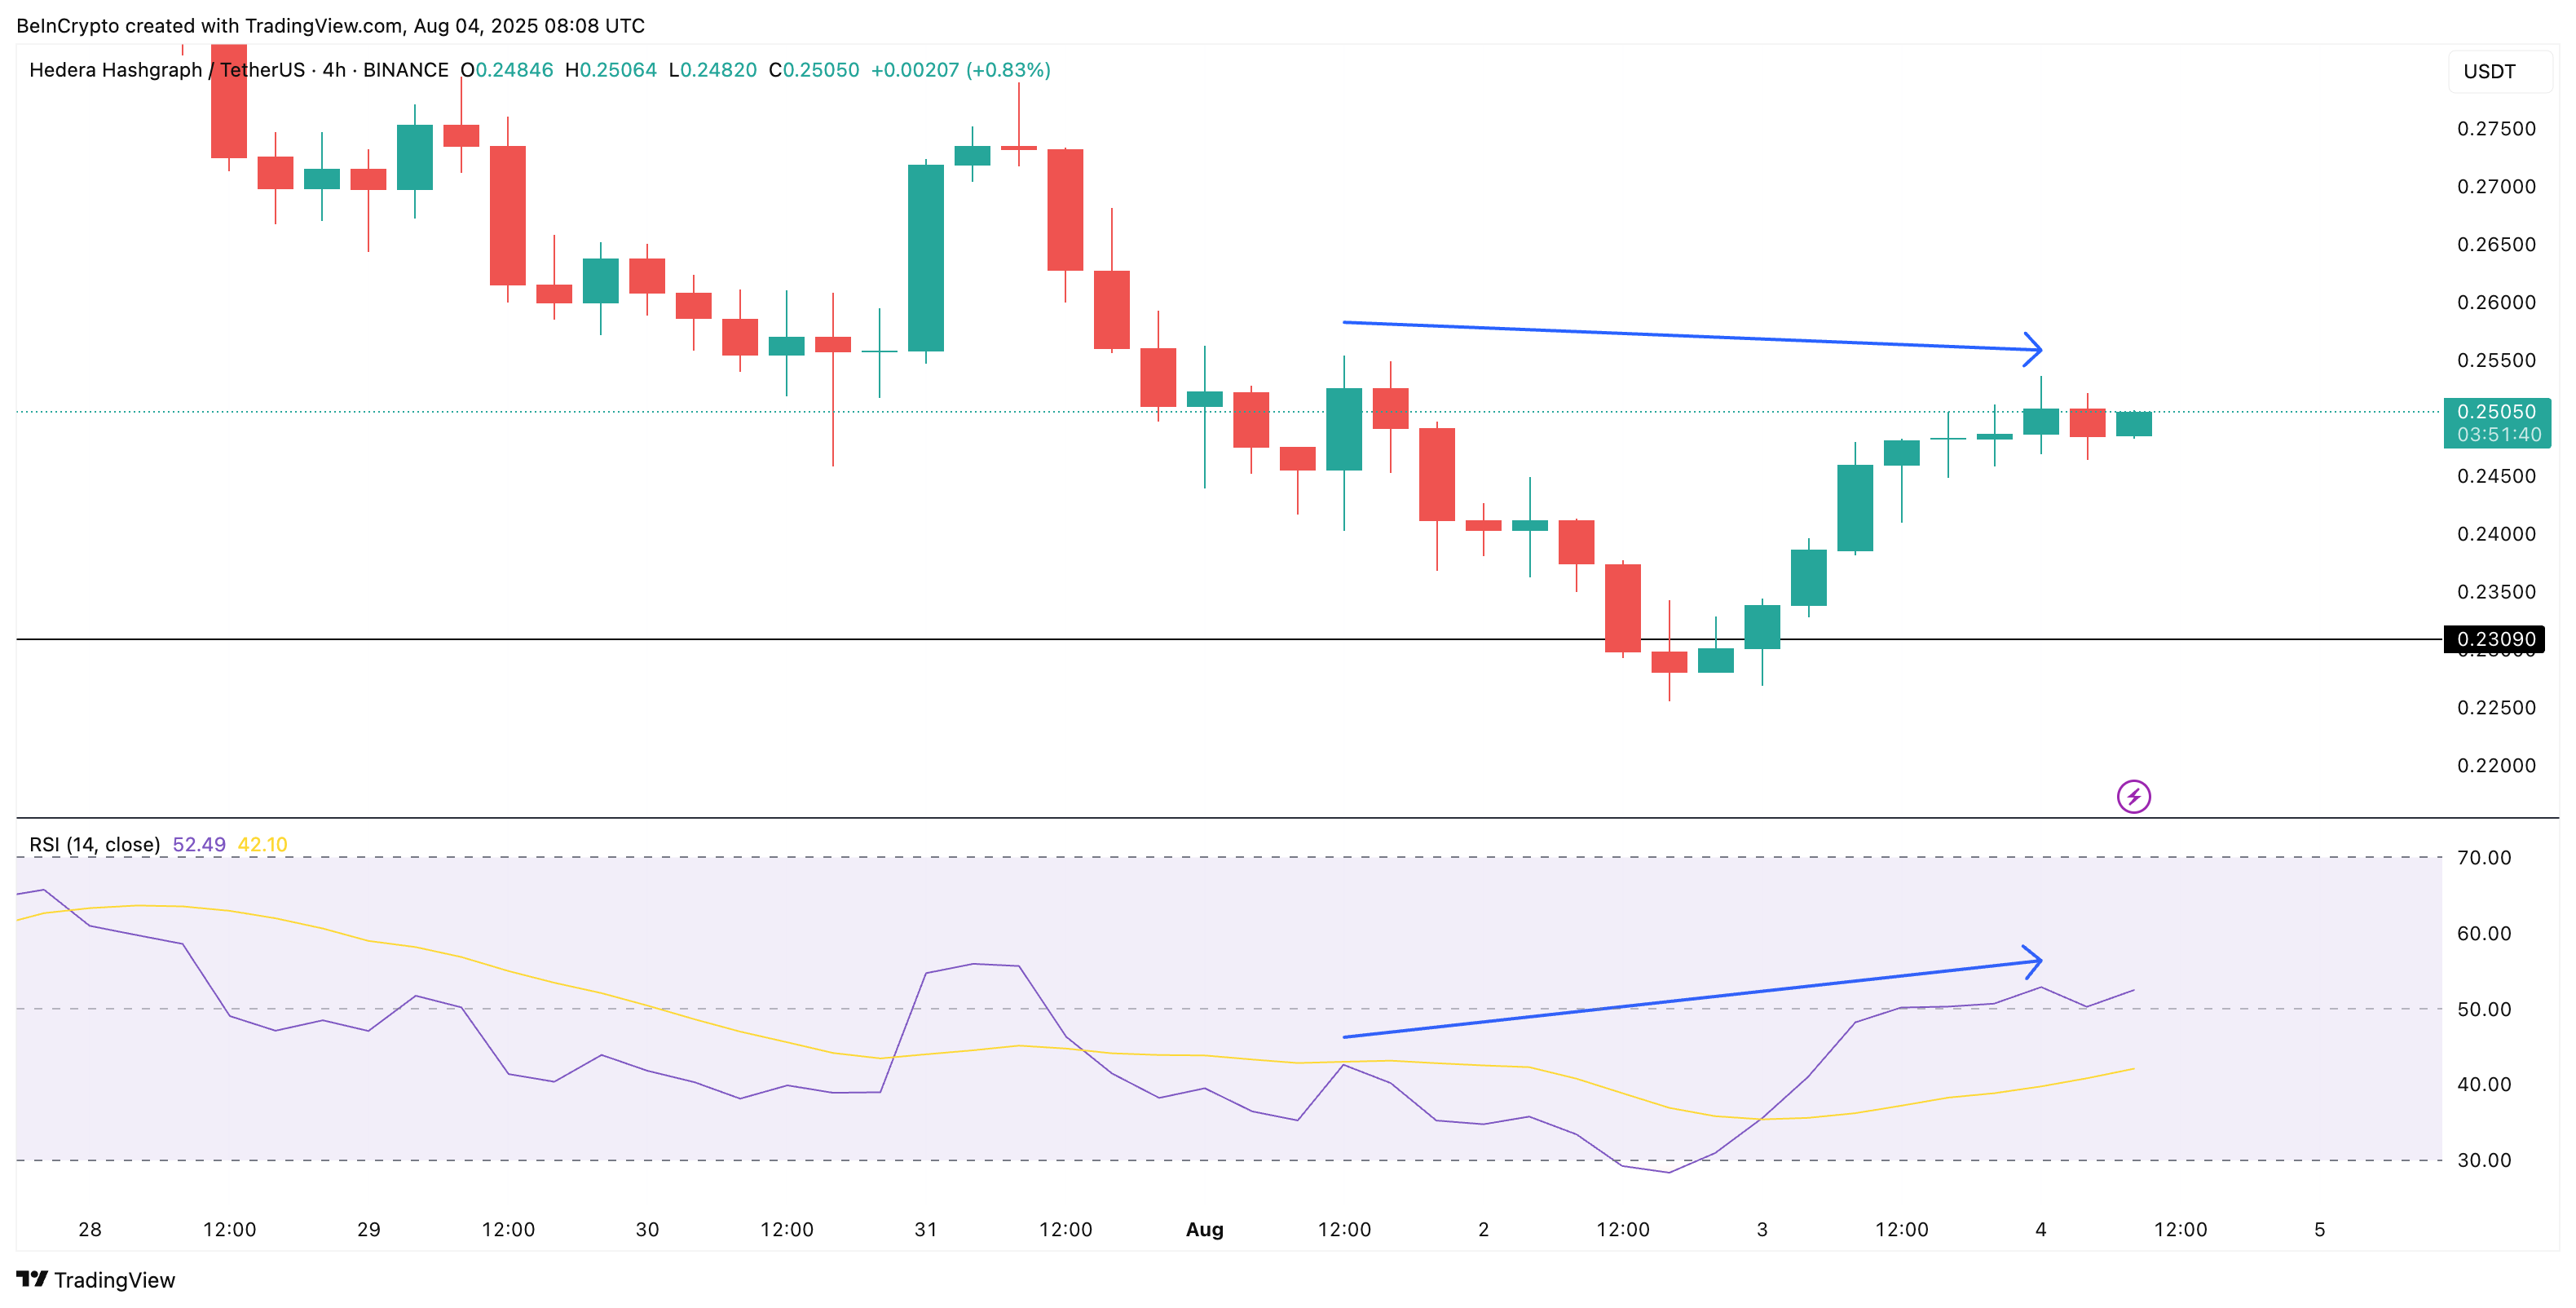
This is a textbook case of hidden bullish divergence, which signals trend continuation, not reversal, in an uptrend. While not a breakout trigger by itself, it strengthens the case for sustained upward movement when paired with net flow and positioning data.
The Relative Strength Index (RSI) is a momentum oscillator that measures the speed and change of price movements, helping identify overbought or oversold conditions.
The HBAR Price Pattern Breakout Hinges on Key Fibonacci Levels
HBAR is forming a clean ascending triangle, a bullish continuation pattern. The rising support trendline started in June, while the horizontal resistance levels are being tested repeatedly. A breakout above $0.27 would confirm the pattern, but $0.29 remains the crucial resistance derived from trend-based Fibonacci extension levels (drawn from $0.12 to $0.29 with retracement to $0.23).
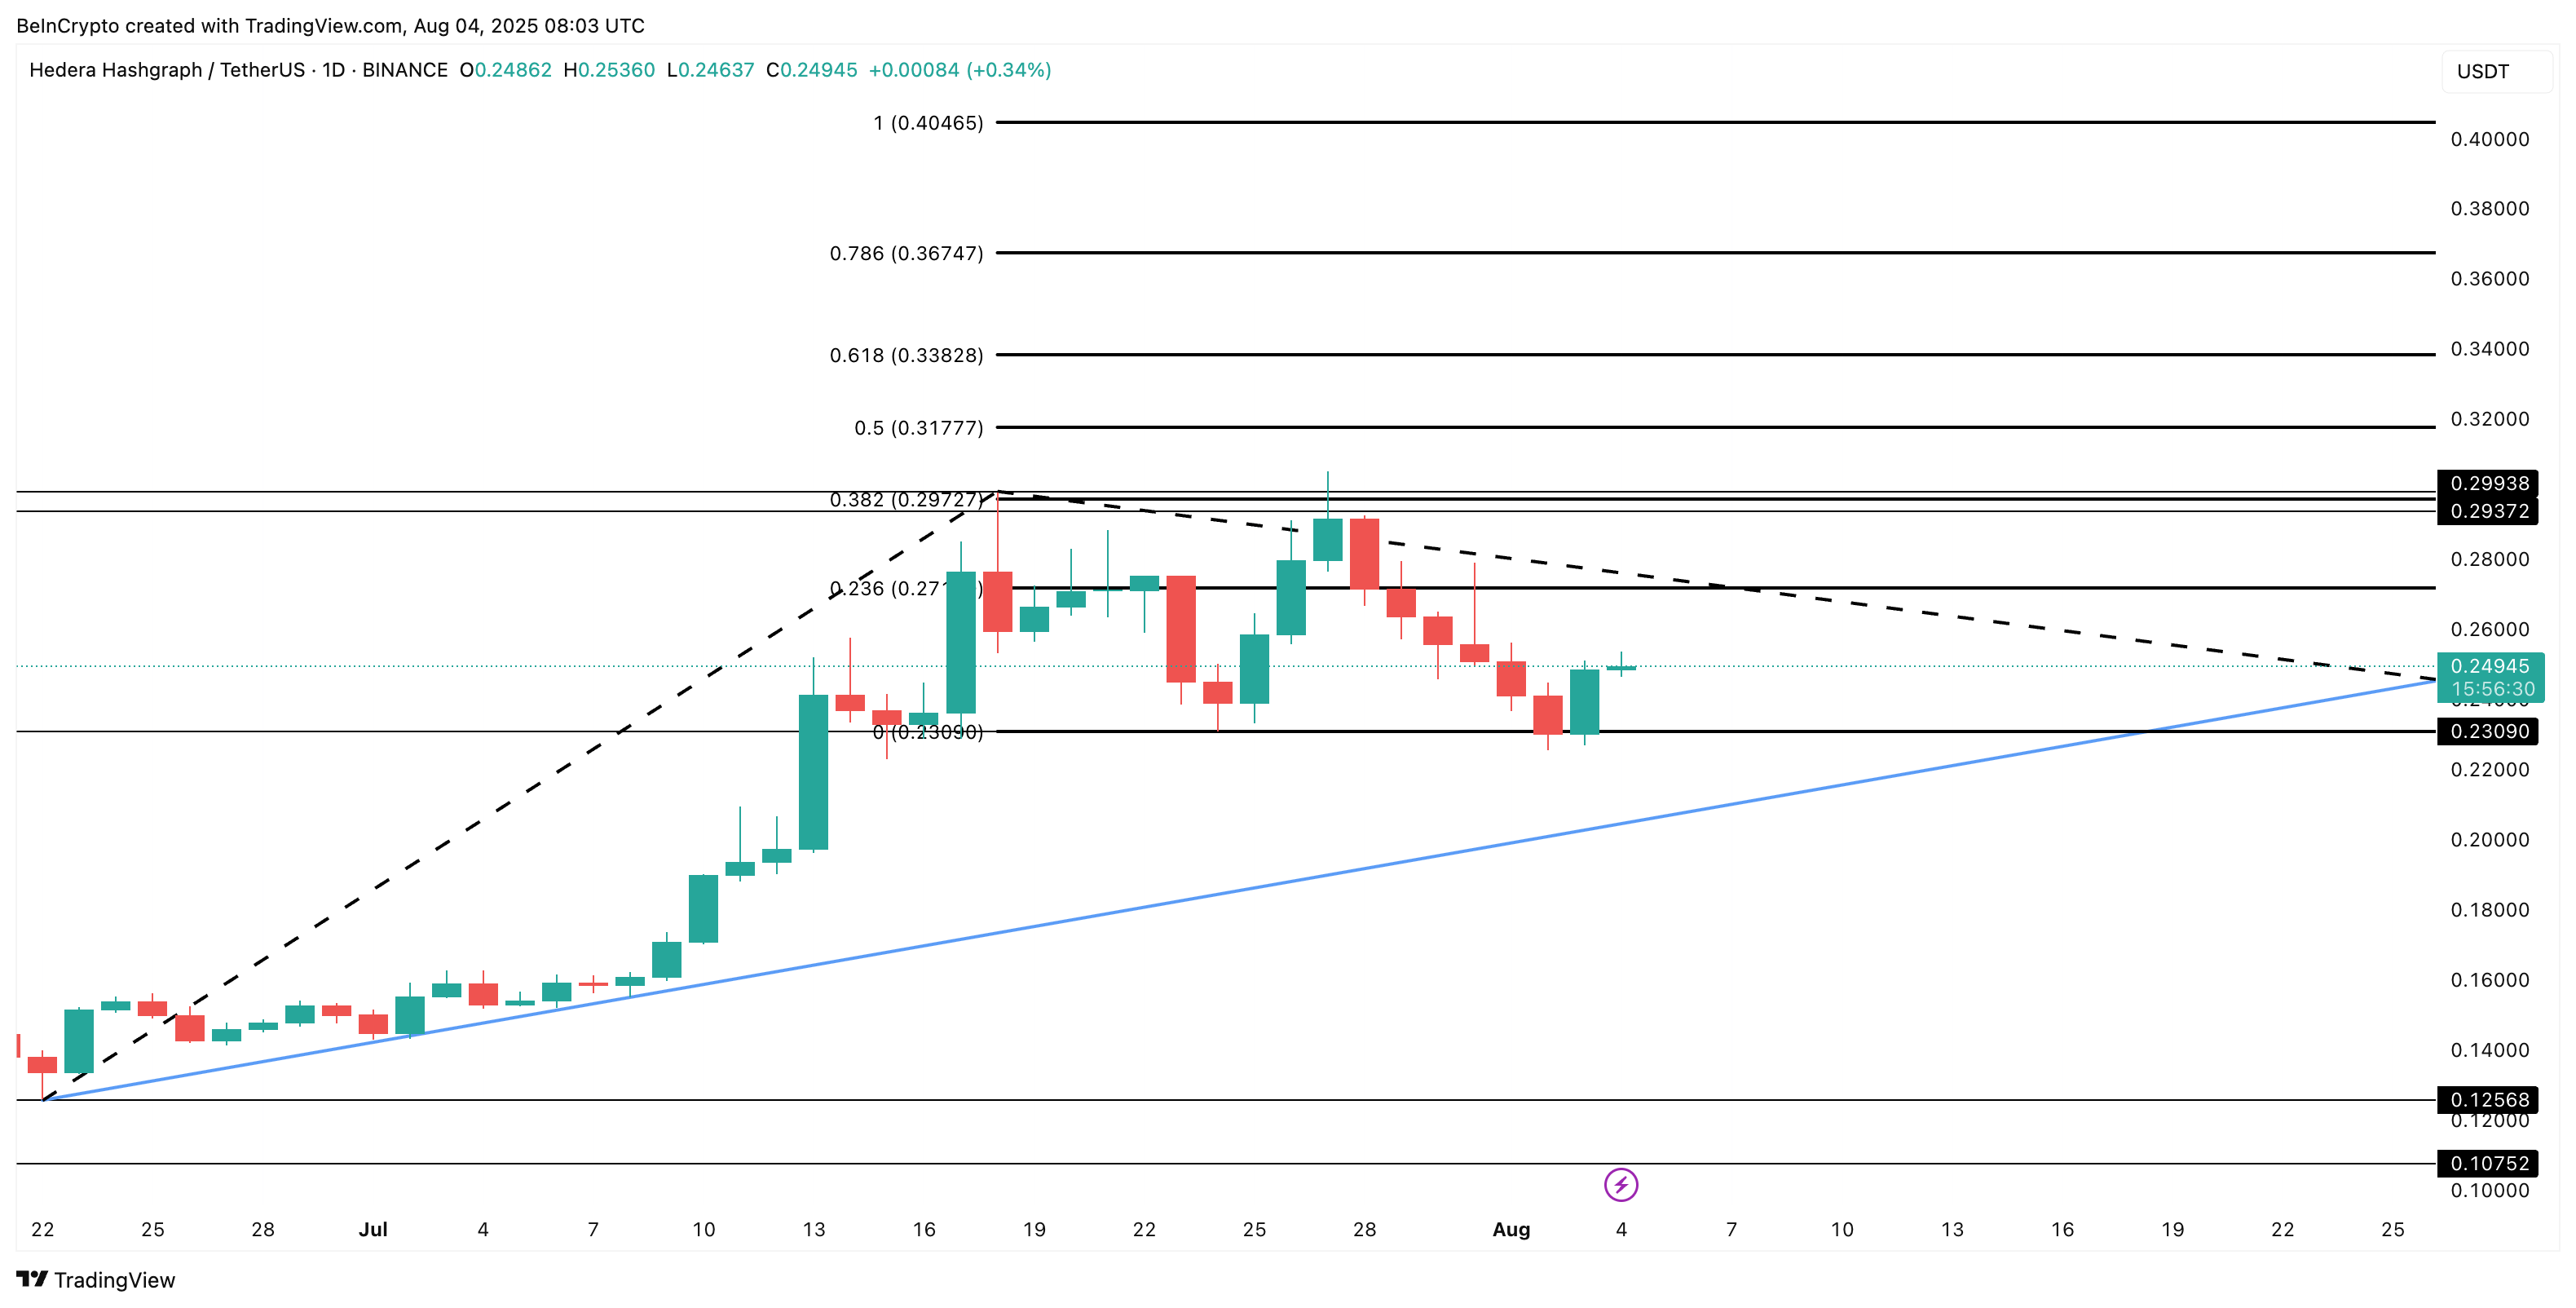
Trend-based Fibonacci extension is a tool traders use to identify potential future support and resistance levels by projecting price moves from a previous trend swing.
If HBAR price breaks $0.29, it could accelerate toward new swing highs. On the downside, a drop below $0.23 would invalidate the short-term bullish thesis, but the broader structure wouldn’t flip bearish unless the HBAR price breaks out of the triangle’s lower trendline.
The post Bullish HBAR Indicator Surfaces: Will Price Respond with a Pattern Breakout? appeared first on BeInCrypto.