Bubblemaps (BMT) recently saw a surge in price following the Binance Token Generation Event (TGE) and its subsequent listing. This rally sparked investor excitement, pushing the price to a new all-time high.
However, the momentum was short-lived, as many investors quickly took profits, leading to a 17% decline.
Bubblemaps Notes Selling Pressure
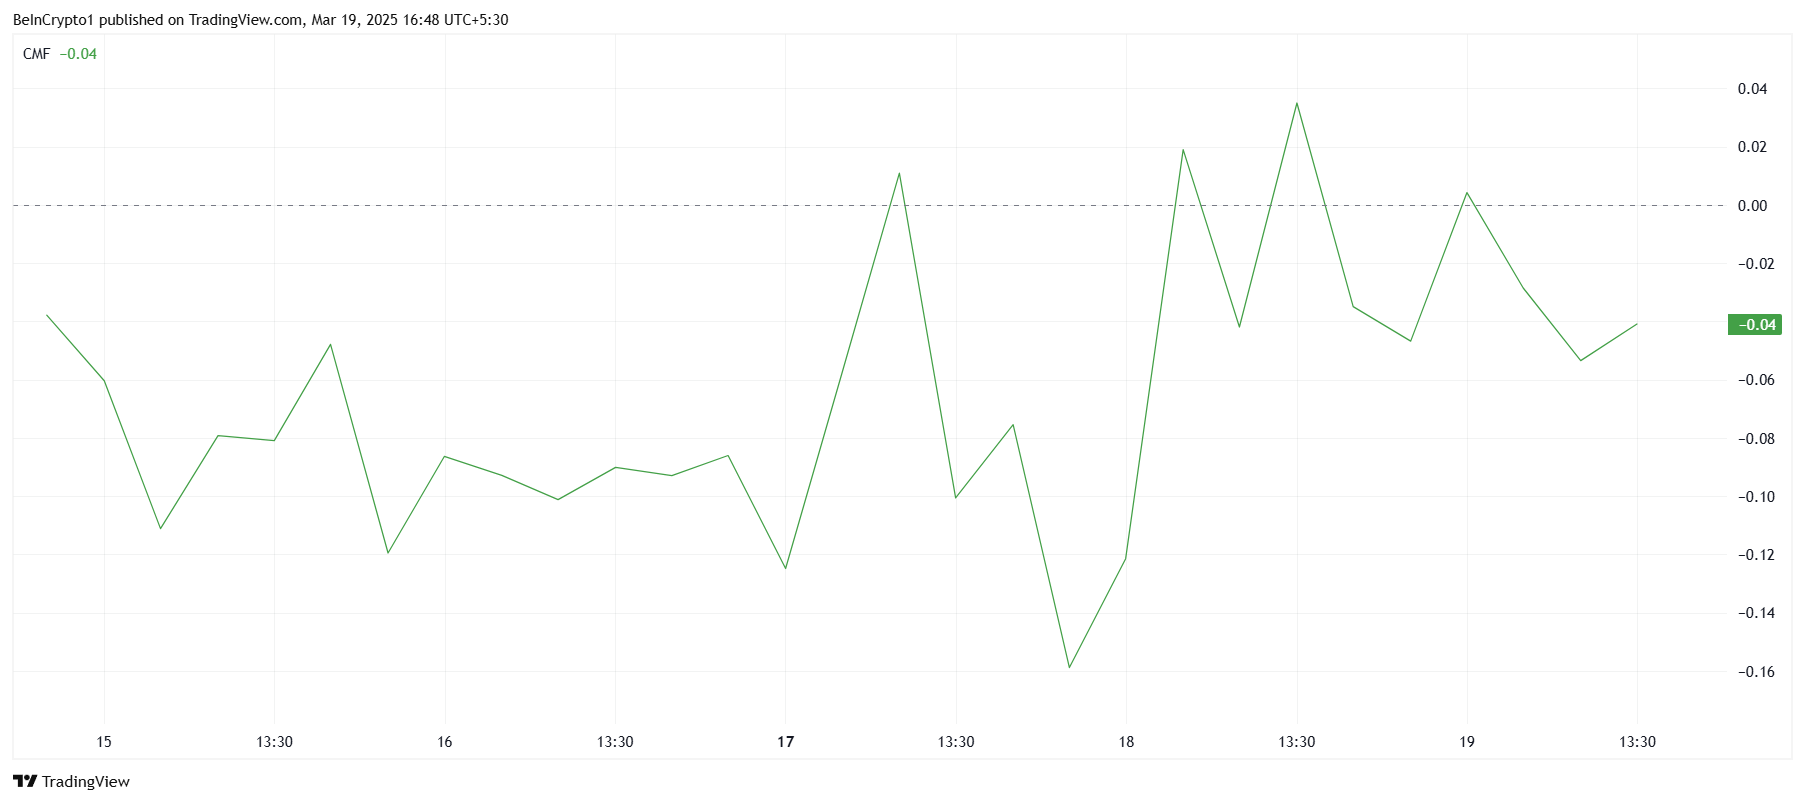
The Chaikin Money Flow (CMF) indicator showed a downtick over the last day, reflecting rising outflows as investors sell off their holdings. This drop in the CMF suggests that the momentum from the initial rally is beginning to fade.
With the indicator still struggling to move above the zero line, the lack of sustained inflows signals that the rally may lose steam in the coming days. Investors are likely cashing out after the initial excitement, which could keep BMT price from maintaining its upward trajectory.
The absence of fresh capital flowing into the asset further complicates any potential recovery.
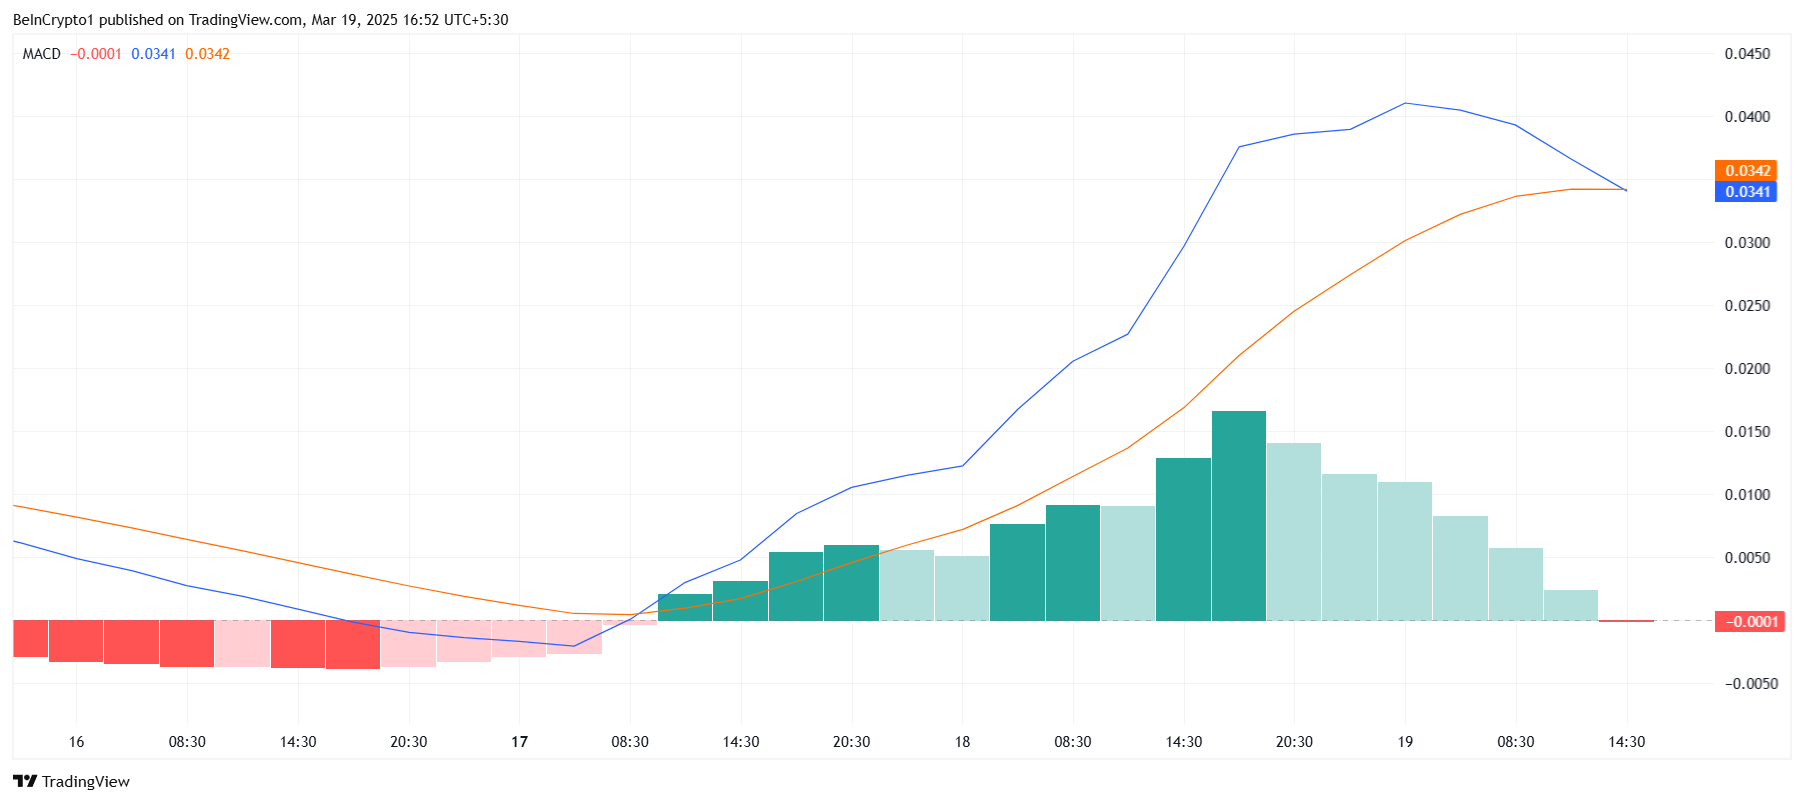
The Moving Average Convergence Divergence (MACD) indicator also points to weakening momentum. After showing positive signals earlier in the rally, the MACD has shifted towards a bearish crossover, suggesting a shift from positive to negative momentum.
The initial bullish trend appears to be losing strength, and the price could follow suit in the near term.
The MACD’s shift to bearish territory confirms that the market sentiment around Bubblemaps is starting to sour. The change in momentum is often an early sign of further declines, and this could lead to more selling as traders react to the negative signals.
Bubblemaps has seen a significant 147% price increase over the past 48 hours. However, after the recent 17% drop, the price is now trading at $0.226. Given the current market conditions, BMT could experience further declines, potentially falling to $0.194 or even as low as $0.119 if investor sentiment continues to drop.
Should the outflows continue, Bubblemaps could struggle to recover. The lack of strong inflows and the shift in momentum from bullish to bearish will likely limit any upside.
A drop below $0.194 would solidify a bearish outlook, and the altcoin may need more substantial market support to avoid further losses.
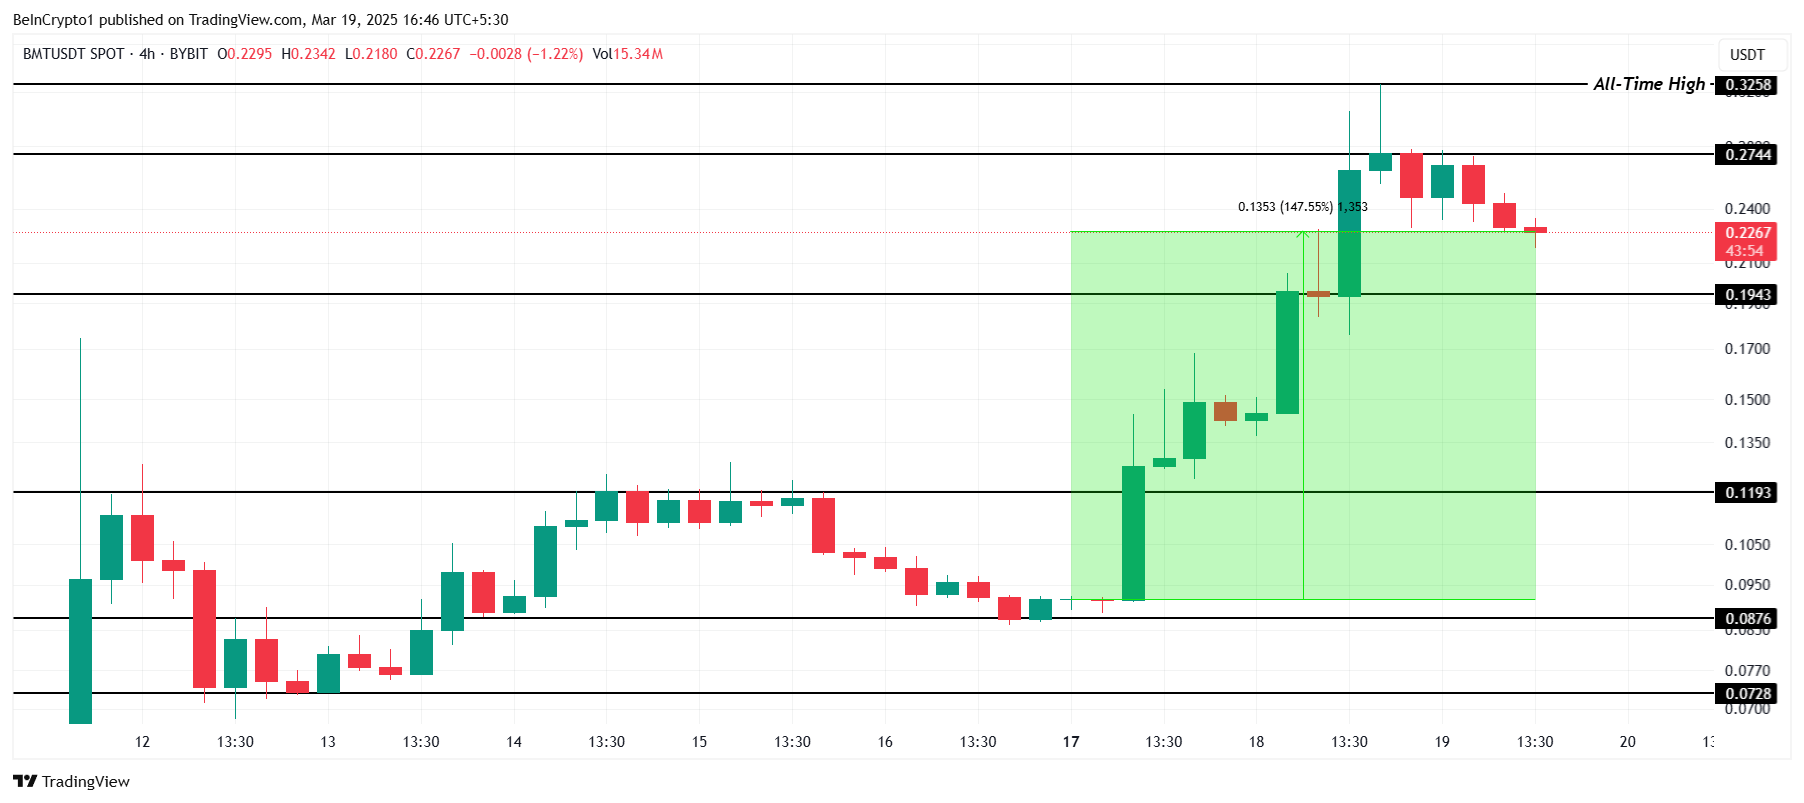
However, if inflows pick up and buying pressure strengthens, there is potential for a price rebound. A breach of the $0.274 resistance level could pave the way for a new all-time high above $0.325, invalidating the current bearish trend and signaling renewed investor confidence.
Bitcoin’s decisive break above the psychologically significant $95,000 mark has injected fresh optimism into the market, at least among miners.
This key milestone has triggered a shift in miner sentiment, with on-chain data showing a noticeable uptick in BTC miner reserves over the past few days.
Miners Bet on BTC Upside as Reserve Jumps from Yearly Low
According to CryptoQuant, Bitcoin’s miner reserve, which had been in a sustained downtrend, began to rise on April 29, shortly after BTC closed above the $95,000 threshold.
For context, the reserve had dropped to a year-to-date low of 1.80 million BTC just a day earlier before reversing course and showing signs of accumulation.
Bitcoin’s miner reserve tracks the number of coins held in miners’ wallets. It represents the coin reserves miners have yet to sell. When it falls, miners are moving coins out of their wallets, usually to sell, confirming growing bearish sentiment against BTC.
Conversely, when this metric rises, as it is now, it suggests miners are holding onto more of their mined coins, often reflecting growing confidence in the BTC’s future price appreciation.
Moreover, the bullish shift in miner sentiment is further supported by the positive miner netflow recorded since April 29. This signals that more coins are being put into miner wallets rather than offloading to exchanges.
Such behavior reflects confidence in further upside, as miners, often seen as long-term holders, are choosing to accumulate rather than liquidate.
There Is a Catch
However, the sentiment is not universally bullish. While BTC miners are stepping back from selling, derivatives data tells a different story.
In the futures market, BTC’s funding rate has remained negative since the beginning of May, a sign that a significant portion of traders are betting on a near-term price correction. At press time, the coin’s funding rate is -0.0056%.
The funding rate is a periodic payment exchanged between long and short traders in perpetual futures contracts to keep the contract price aligned with the spot price.
When it is positive, it means traders holding long positions are paying those with short positions, indicating that bullish sentiment dominates the market.
On the other hand, a negative funding rate like this signals more short bets than long ones, suggesting bearish pressure on BTC’s price.
Breakout or Breakdown as Traders and Miners Diverge
While miner behavior may point to renewed confidence, the steady bearish sentiment in derivatives suggests that traders remain wary of a potential pullback.
If coin accumulation strengthens, BTC could extend its gains, break above the resistance at $98,515, and attempt to regain the $102,080 price mark.
BeInCrypto sat down with members of the LBank team to analyze the possible resurgence of the meme coin market as a leading crypto narrative and what their fusion with artificial intelligence (AI) can have on their reach.
LBank also discussed the impact of the four-month-old Markets in Crypto-Assets (MiCA) regulation on its operations across Europe. They described a fundamental change in investor confidence in light of greater regulatory clarity and simplified accessibility.
Have Meme Coin Highs Given Way to Devastating Lows?
In recent years, the meme coin market has largely been characterized by overwhelming highs and devastating lows. The first few months of 2025 have further confirmed the volatile nature of these tokens, to the point that a vocal part of the crypto community believes that their recent lows have marked the end of the meme coin lifecycle.
These claims are not unfounded, especially now that the US President has become a meme coin player. When Trump launched his meme coin in mid-January, TRUMP reached a market capitalization of nearly $8.8 billion, a number never before seen by a meme coin launch.
When insider traders capitalized on the surge to sell off their holdings and retain millions of dollars in gains, retail investors bore the brunt of the massive sell-off, suffering hundreds of thousands of dollars in losses.
“The decline in meme coin market cap since January can be attributed to a combination of market dynamics and sentiment shifts. A key driver was the rapid rise and subsequent crash of the TRUMP token, which drew significant market capital due to its viral appeal but collapsed sharply, eroding investor confidence and triggering a broader risk-off sentiment,” Eric He, Community Angel Officer and Risk Control Adviser at LBank told BeInCrypto.
After similar experiences with the MELANIA token and the LIBRA launch, some of these retail investors realized that meme coins —as unregulated and unpredictable as they are— may not be the best investments.
Is the Meme Coin Frenzy Coming to a Halt?
Given the devastating effects that these episodes have had on the meme coin market, trading has reduced significantly. The crypto community seems to have become saturated with news of pump-and-dump schemes and rug pulls, likely contributing to a halt in the meme coin frenzy.
The total meme coin market capitalization has been free-falling since January’s peak following the presidential token launches. Now, its levels resemble those of September 2024. The greater economic downturn that traditional and crypto markets experienced over the past several weeks has only worsened prospects.
Yet, despite this downward pressure, the market still experiences a high level of activity. It has a $14.5 billion trading volume and a $57 billion market capitalization.
Total meme coin market capitalization. Source: CoinGecko.
According to the LBank team, the meme coin industry is due for a revival.
LBank’s Belief in the Revival of the Meme Coin Market
Though the decline in meme coin performance has been significant, the LBank team expressed that these circumstances are far from unexpected. Meme coins are inherently tied to community support and social momentum.
The sustained trading volumes and large market capitalization serve as tangible indicators that, even in a downturn, the market is seeing active community engagement and liquidity. Investors still see value in the tokens’ cultural and speculative appeal.
“We see it as a healthy market correction rather than a fundamental shift. Meme coins have always been volatile, but the fact that trading volumes remain high shows continued interest. What’s happening now is not the end of the trend—it’s just a recalibration before the next wave,” Mario Iemma, Head of Spanish Markets at LBank, told BeInCrypto.
In fact, Iemma believes that meme coins will not be dying out anytime soon.
AI agents represented the first significant shift in the evolution of the cryptocurrency industry. These autonomous systems proved that they could make decisions and perform tasks independently. This technology enhances intelligence, adaptability, and fairness in financial mechanisms.
Now, developers have unlocked artificial intelligence’s potential on tokens. Systems like Grok have already made news by using AI to automatically and independently design and launch tokens.
However, with a nascent technology like AI, the LBank team emphasized the need for responsible and thorough deployment for the long-lasting success of AI-generated tokens. This success hinges on two particular factors: accessibility and security.
Security and Accessibility Challenges for AI-Generated Tokens
The concept of security is frequently associated with any emerging technology. Artificial intelligence is no exception, especially in a particularly unregulated industry like crypto.
According to He, AI-generated token projects’ degree of security and transparency will determine their success.
Iemma agreed, adding that if AI-generative tokens become widely accessible, this development will also require additional layers of oversight.
“That same accessibility demands better filters, vetting, and AI-based security audits—areas where exchanges like LBank are already investing resources,” he said.
While reflecting on the security risks associated with artificial intelligence and the breaches in consumer trust that meme coins have had on the crypto community, the LBank team also emphasized the need for greater regulation in the industry.
The development of cryptocurrency regulations varies significantly across the globe. Notably, the European Union implemented comprehensive rules almost five months ago, while key markets such as the United States are still establishing adequate frameworks.
MiCA’s Effect on the European Crypto Market
Last December, with the implementation of the Markets in Crypto-Assets (MiCA) regulation, the European Union became the first jurisdiction to establish a comprehensive and unified regulatory framework for crypto-assets across all its member states, marking a significant milestone.
According to the LBank team, MiCA gives users and institutions a trustworthy framework. This development has proven critical for industry growth across the region.
“MiCA has forced firms to become more transparent and compliant, which is a good thing for long-term trust. We’ve seen exchanges accelerate their legal and operational upgrades. For users, it creates a safer, more predictable environment,” Iemma said, adding, “With clearer rules, banks and investment firms are more willing to explore crypto partnerships, custody solutions, and even tokenized assets. Regulation reduces reputational risk, and MiCA is helping bridge that gap.”
However, this experience can be largely attributed to established firms in the industry and investors with access to substantial resources. Other players, however, have struggled to gather the requirements to apply for a MiCA license.
Future Accommodation for Smaller Crypto Businesses
In discussing the impact of MiCA since its enactment last December, He highlighted how different industry players have responded to the landmark regulation. He noted that startups struggle the most to obtain an operational license.
When evaluating the cost-effectiveness of an operational license, He’s conclusions make sense.
MiCA is an expensive regulation. It mandates minimum capital requirements based on the crypto services offered. These requirements range from €50,000 for advisory and order-related services to €125,000 for exchange and trading platforms and up to €150,000 for custody services. Businesses must maintain this capital as a financial safeguard.
Beyond minimum capital requirements, companies must factor in government and legal fees, local presence costs, bank setups, and ongoing operational costs. But for prominent exchanges like LBank, the benefits outweigh the costs.
Future MiCA updates could address the high compliance costs for smaller businesses. Meanwhile, other regions developing their crypto regulations should consider this aspect to avoid creating similar barriers.
SUI blockchain has been gaining traction in recent weeks, and its market cap is now approaching $7 billion. Fueled by meme coin activity and rising DeFi engagement, the network has seen a notable jump in DEX volume and technical momentum.
While indicators like RSI and EMA lines show early signs of a potential trend shift, overall strength remains mixed. SUI sits at a key crossroads—supported by short-term excitement but still needing stronger confirmation to challenge top-tier chains.
SUI Surges to 5th in DEX Volume, But Still Trails Top Chains
SUI’s recent surge in DEX activity has grabbed attention, largely fueled by growing interest in meme coins and speculative trading on its ecosystem. Over the past seven days, SUI’s DEX volume hit $2.1 billion, marking a 4.49% increase and continuing its steady upward trend.
This momentum has helped SUI outperform other ecosystems, most notably surpassing Arbitrum in the past 24 hours to become the fifth-largest chain by DEX volume.
However, despite the short-term gains, SUI still trails well behind top-tier networks like Base, BNB Chain, Ethereum, and Solana in total DEX activity.
Chains Sorted By DEX Volume In The Last 24 Hours. Source: DeFiLlama.
These established ecosystems continue to dominate in terms of liquidity, user base, and overall transaction volume.
While SUI’s rise is notable, especially given its relatively new position in the DeFi ecosystem, it will need to sustain this growth and diversify beyond meme coin hype to truly challenge the leading players.
For now, it remains an exciting underdog with momentum—but not yet a major contender.
SUI Momentum Rebuilds, But Trend Remains Weak
SUI’s RSI is now at 51.86, up from 35.22 just three days ago. This suggests buying pressure has returned after a short-term dip, helping stabilize price action.
The Relative Strength Index (RSI) measures momentum on a scale from 0 to 100. Readings above 70 are considered overbought, while those below 30 indicate oversold conditions.
Sitting near the midpoint, SUI’s RSI points to neutral momentum. It hasn’t crossed above 70 in almost a month, showing that bullish strength has remained limited.
Meanwhile, SUI’s DMI (Directional Movement Index) shows that its ADX is down to 9 from 14.79 just two days ago. The ADX measures trend strength, and anything below 20 signals a weak or nonexistent trend.
The +DI is at 15.83 while the -DI is at 13.15, meaning buyers have a slight edge—but the low ADX suggests that edge isn’t strong. There’s no clear trend dominating the market right now.
Together, the RSI and DMI suggest that SUI is in a consolidation phase. Buyers are showing some activity, but not enough to build a strong, sustained trend—at least for now.
EMA Setup Still Bearish, But SUI Bulls Show Signs of Life
SUI’s EMA lines are still showing a bearish setup, with short-term averages sitting below the long-term ones. However, the gap between them has narrowed, and a potential golden cross may be forming.
A golden cross occurs when a short-term EMA crosses above a long-term one, often seen as a bullish signal. If this plays out, SUI could gain momentum and push toward the $2.28 resistance level.
Breaking above that could open the path toward $2.41 and $2.54. If bullish momentum builds further, SUI blockchain could even test the $2.83 level—its highest since early March.
But if the market fails to hold current levels and selling pressure returns, a correction could begin. In that case, it might fall back to test the $2.02 support.
Losing that support could bring deeper downside, potentially pushing SUI toward $1.71. For now, price action is at a critical point, with both breakout and breakdown scenarios on the table.