Bitcoin’s (BTC) price briefly hit $120,000, with daily trading volume surging past $77 billion. The BTC price rise happened after more than $920 million in Bitcoin was withdrawn from Kraken and sent to unknown wallets in under one hour today. There is a strong accumulation patterns based on the transfers alongside more purchases by ETFs.
Ripple has gone ahead with one of the biggest RLUSD tokens burn since introducing the stablecoin. The crypto has already achieved various milestones and is growing in terms of user adoption. So, this step could mark a significant point towards increasing its demand. Here’s why.
Why Ripple Burnt 12 Million RLUSD Tokens?
According to the Ripple stablecoin tracker’s X post, the blockchain-based digital payment network has burned 12 million RLUSD stablecoin tokens on Tuesday. The on-chain stats confirm that at 11:05 UTC on April 22, the firm went ahead with sending the token to a burn wallet, which would remove their existence from the ecosystem forever.
Notably, such practices are made to reduce the excess supply of the token, creating scarcity, eventually boosting the demand. Another important point to note is that the transaction also focused on introducing cross-chain liquidity, as explained by the experts.
XRPL dUNL validator, Vet, reveals that the individual who requested the burning had moved the RLUSD from one blockchain to another. As a result, the supply of the tokens reduced on the XRP Ledger and increased on the Ethereum blockchain.
This acted as a liquidity bridge without affecting the circulation of the tokens. Interestingly, the RLUD Treasury minted 12 million (equal to the burning amount) within seconds after that.
RLUSD Trading Volume Rose 200% Past Tokens Burning
Similar to most top stablecoins, RLUSD is also pegged to the dollar at a 1:1 ratio. Interestingly, its adoption has been constantly growing since various top exchanges listed the token. Recently, Ripple stablecoin got listed on the Aave V3 Ethereum Core Market, gaining additional investor attention.
Amid that and the RLUSD tokens burning, its trading volume is up by more than 200%, currently at $102.96 million. In addition, its market capitalization stands at $294.07M, with 294.04M RLUSD in circulation. Interestingly, under the impact of this and the recovery of the crypto market, the XRP price is soaring.
Notably, Ripple Labs’ integration of RLUSD stablecoin with the payment network highlights the digital asset among users. Experts anticipate that RLUSD will occupy 50% of the stablecoin market capitalization and many other milestones in the near future.
Hyperliquid users reported a brief outage today, primarily impacting the frontend. Several users were momentarily unable to withdraw funds, place, or close orders. The cause of this outage remains unclear.
Although the glitch was repaired within minutes, some community members reacted with FUD. Many feared unjust liquidations of their short positions, while others speculated that Hyperliquid’s recent growth caused the issue.
Hyperliquid’s Frontend Outage
Decentralized exchange Hyperliquid has been one of the most popular platforms among the crypto community in 2025. Despite its surging popularity, Hyperliquid has experienced a few bumps in the road.
Several high-profile trades, the whole James Wynn saga, and the JELLYJELLY short squeeze kept the platform in crypto headlines recently. Today, the exchange faced another minor setback.
Bad news: the Hyperliquid API is down
Good news: Hyperliquid appears to still be producing blocks
Bad news: you cannot short HYPE because all frontends are down
Good news: you also cannot get liquidated because the API is down (i actually don’t know if this is true) pic.twitter.com/NmIeD2kx98
According to Discord messages from Hyperliquid developers, this outage only lasted a few minutes. Nonetheless, the fan community showed displeasure with the decentralized exchange, worrying about their accounts.
Some accounts even theorized that this mishap could disrupt billions in short positions. So far, however, those fears seem overblown.
The platform didn’t release any public statements on the matter, but given the nature of the outage, it was likely an API issue.
Social media reports suggest that several customers couldn’t place or close orders, the entire frontend seemed dysfunctional, and more.
However, Hyperliquid continued producing blocks during the outage, and it doesn’t look like the backend suffered. The malfunction only lasted a few minutes, not causing any lasting damage.
Technical outages in crypto are not new, especially among new blockchain networks and platforms.
Moreover, the exchange quickly fixed the problems from other crises this year. For all we know, today’s outage could give Hyperliquid developers a better chance to future-proof their frontend.
Decentralized exchange (DEX) aggregator 1inch experienced a critical breach of its smart contracts last week. However, following negotiations with the hacker, the exchange successfully recovered most of the $5 million stolen.
Despite the recovery, the attack highlights the ongoing security challenges within the DeFi ecosystem.
1inch Recovers Most of Its Stolen Funds
1inch experienced this particular breach on March 5. Investigators attributed it to a vulnerability in an outdated version of the platform’s smart contract. After discussions and a generous bug bounty, the attacker returned the funds.
“After negotiations with the hacker, most of the $5 million stolen from 1inch has been returned, with the hacker keeping a portion as a bug bounty,” WuBlockchain reported, citing Decurity’s postmortem report.
1inch explained in the March 7 blog that the breach was caused by a flaw in the Fusion v1 resolver smart contract, an obsolete platform component. The team detected the incident at approximately 6 PM UTC on March 5.
Attackers exploited outdated logic within Fusion v1 to execute unintended transactions.
Notably, no end users were directly affected, as the attack targeted a third-party market maker, TrustedVolumes. Upon discovering the breach, 1inch swiftly redeployed its resolver contracts as a precautionary security measure, preventing further exploits.
According to Decurity’s postmortem report, the hacker initiated an on-chain message following the attack. They requested a bug bounty in exchange for returning the stolen funds.
TrustedVolumes, the affected market maker, entered negotiations with the attacker, leading to a successful resolution.
This resolution marks a rare instance in which a DeFi exploit resulted in the voluntary return of stolen assets. It reflects the growing trend of ethical hacking and white hat negotiations in the DeFi industry.
Also, it highlights the persistent risks DeFi protocols encounter. The latest hack is another reminder of the necessity for continuous monitoring and rapid response mechanisms to safeguard users and assets.
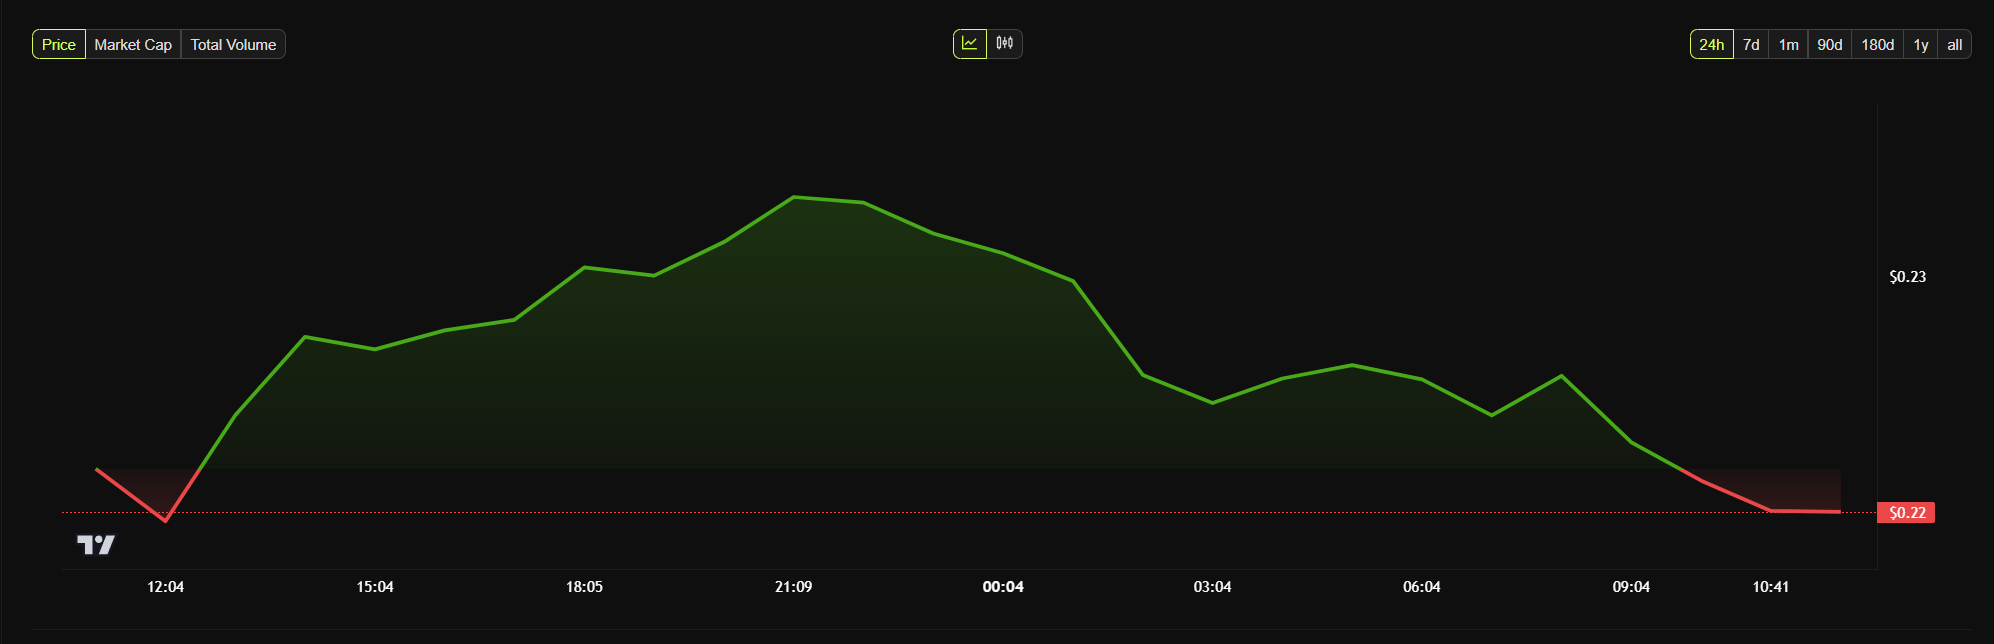
Despite the recovery, the 1INCH price has only gone up by a modest 1.12% since Sunday’s session opened and was trading for $0.23 as of this writing.
This incident highlights the importance of continuous smart contract audits and proactive vulnerability detection. It also indicates the need for stronger validation mechanisms to prevent similar incidents in the future.