Bitcoin (BTC) price has dropped below $120,000 after hitting an all-time high of $123,091 earlier today. The decline in BTC price follows fresh geopolitical tension as U.S. President Donald Trump threatened to impose 100% tariffs on Russia within 50 days if the war with Ukraine does not stop. BTC Price Pulls Back After Reaching All-Time
A massive scandal has shaken the crypto world, and it’s all about the MOVE token. What was supposed to be a successful launch for MOVE ended in disaster, causing its price to drop to an all-time low of $0.219. Behind this sudden collapse lies a financial deal that was supposed to boost the token’s success but instead led to market manipulation and shady tactics.
Who’s really behind this crypto chaos, and how did it all go so wrong? Let’s break down the details.
Deceptive Deal Leads to a Price Collapse
The Movement Foundation, behind the launch of MOVE, is now under investigation for signing a deal that gave a single entity disproportionate control over the token market. The agreement granted Web3Port, a Chinese market maker with ties to Donald Trump-affiliated World Liberty Financial, significant leverage.
This resulted in the sale of 66 million MOVE tokens just one day after their debut in December. The massive token dump triggered a sharp price drop and sparked allegations of insider trading.
Rentech: The Middleman at the Center of the Scandal
Internal messages from Movement’s co-founder, Cooper Scanlon, revealed that they were deceived into working with a middleman named Rentech. Initially believed to be a subsidiary of Web3Port, Rentech turned out to be a separate entity that facilitated this market manipulation.
The deal allowed Rentech to borrow up to 5% of MOVE’s total supply, giving them significant control over the token’s price, raising red flags about potential price manipulation.
Incentives for Price Manipulation
The market-making agreements involved unusual provisions, such as one that incentivized Rentech to artificially push the price of MOVE token over $5 billion in value. This setup would have allowed them to profit from a sharp price rise and then sell off their tokens, benefiting from the inflated price.
Industry experts, including crypto founder Zaki Manian, called this structure “dangerous” and unethical, accusing the deal of encouraging price manipulation.
Internal Conflicts and Investigation
Movement is also facing internal tensions. Allegations have surfaced about co-founder Rushi Manche’s involvement in pushing for the deal, with some suggesting that conflicts of interest played a role.
The company is now investigating these claims and working to hold those responsible accountable.
Binance Steps In
As a result of the token dump, Binance, one of the largest crypto exchanges, banned the market-making account tied to Rentech. In response, Movement Foundation launched a token buyback initiative to stabilize the price and regain investor trust.
Despite the negative press and the fallout from the price crash, Movement Labs has promised to investigate the circumstances surrounding the deal and ensure accountability.
The post MOVE Token Scandal News: Who & How Market Manipulation Led to Massive Price Drop appeared first on Coinpedia Fintech News
A massive scandal has shaken the crypto world, and it’s all about the MOVE token. What was supposed to be a successful launch for MOVE ended in disaster, causing its price to drop to an all-time low of $0.219. Behind this sudden collapse lies a financial deal that was supposed to boost the token’s success …
Bitcoin has reached a new high of $97,000, continuing its strong price climb. At the moment, Bitcoin is trading just under $97,000. It recently broke through the $96,000 level and is showing signs of strength on the daily and weekly charts. Some price pullbacks are still expected, but the overall trend remains upward.
Analysts are now watching closely for the next major price levels as this rally could drive the entire crypto market higher. In the second quarter of 2025, Bitcoin is showing strong bullish indicators. It recently cleared its 200-day moving average and is building strong support.
Additional support levels at $95,797 and $96,441 are also being monitored as part of a broader bullish structure. According to an analyst, a sustained drop below $95,280 could signal the early stages of a larger correction, but as of now, Bitcoin remains firmly above that threshold.
If buying pressure resumes, short-term targets to the upside include $97,325, $98,745, and the psychological milestone of $100,000. These levels represent areas of potential resistance based on recent price dynamics.
The larger trend remains constructive, with bulls aiming for a continuation of the uptrend toward the $115,000–$120,000 range later this cycle—provided current support zones hold.
Market Outlook: More Gains Ahead?
The strong Bitcoin rally could push other cryptocurrencies like Ethereum, XRP, and Solana higher as well. This pattern, seen in past bull markets, usually starts with Bitcoin leading the way, followed by altcoins gaining momentum as investor money spreads across the market.
While pullbacks are expected — since prices never go up in a straight line — many experts believe the market is setting up for another major run. A key support level to watch is $95,280. As long as Bitcoin stays above this, there’s a chance for more upside.
The post Bitcoin Price Breaks $97000: What’s Next? appeared first on Coinpedia Fintech News
Bitcoin has reached a new high of $97,000, continuing its strong price climb. At the moment, Bitcoin is trading just under $97,000. It recently broke through the $96,000 level and is showing signs of strength on the daily and weekly charts. Some price pullbacks are still expected, but the overall trend remains upward. Analysts are …
XRP is gaining momentum once again, climbing nearly 6% in the past week and pushing its market cap back above $130 billion for the first time since March 27.
The altcoin’s RSI has entered overbought territory for the first time in over a month, its Ichimoku Cloud setup remains bullish, and its EMA lines have formed consecutive golden crosses. With traders eyeing both breakout targets and key support zones, XRP enters a pivotal moment that could define its next major move.
XRP Enters Overbought Zone for First Time Since March
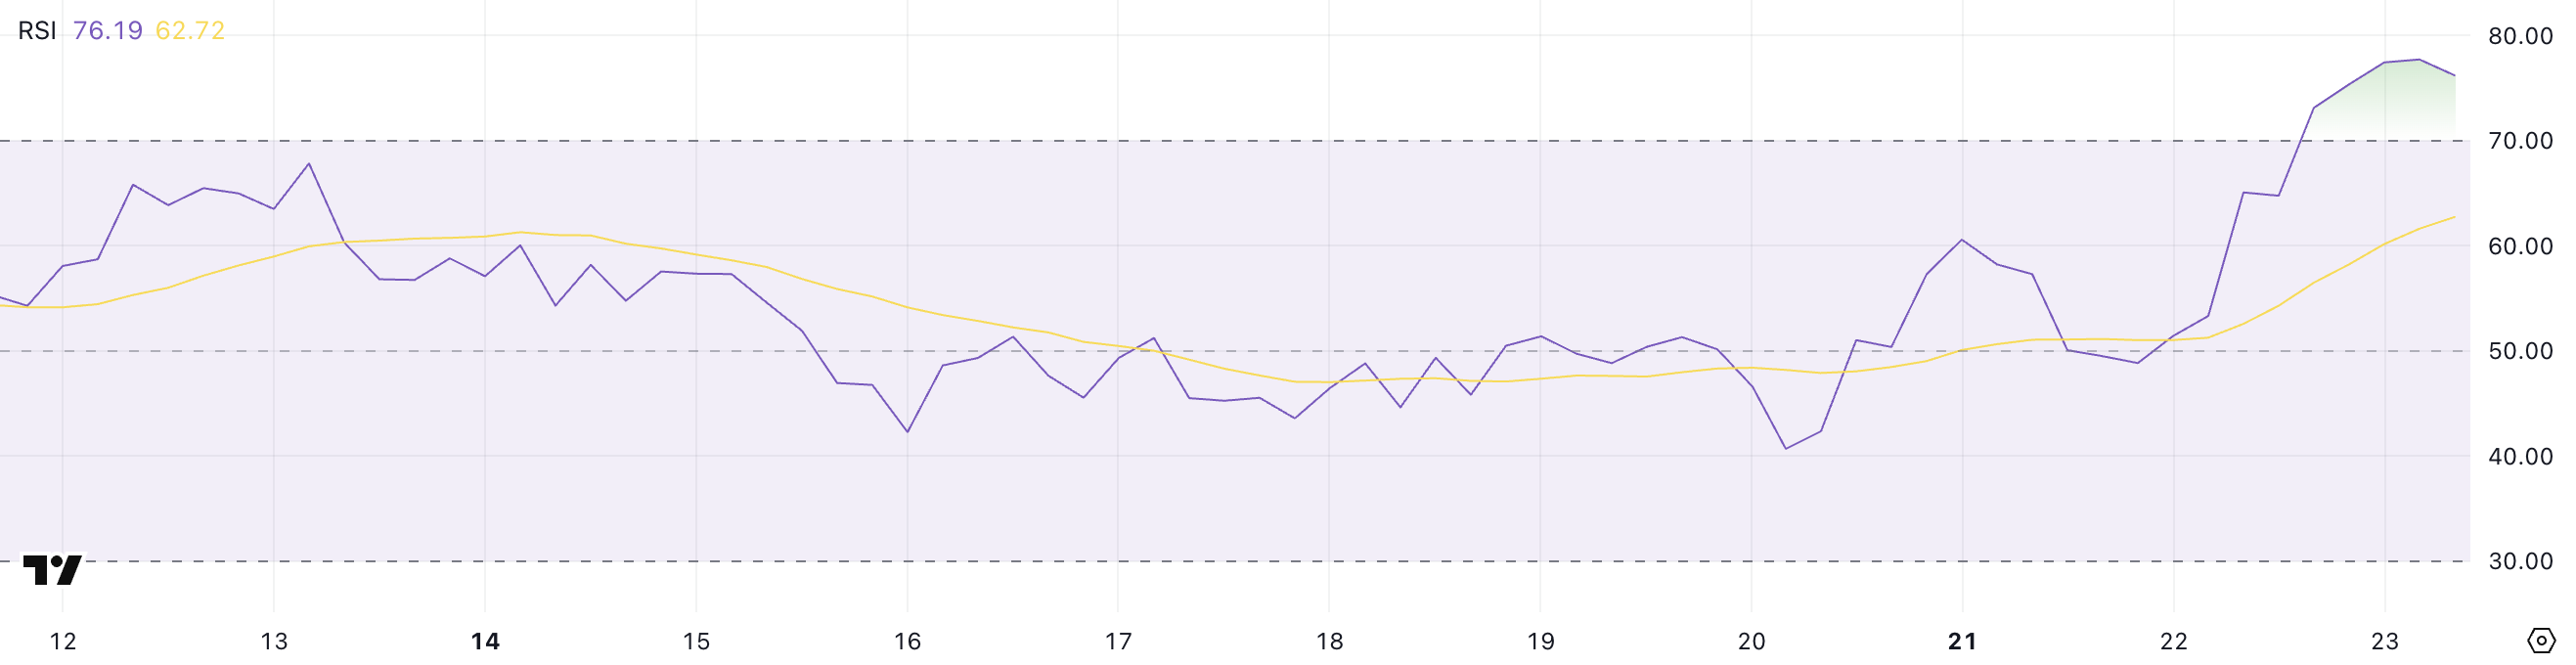
XRP’s Relative Strength Index (RSI) has surged to 76.19, climbing above the 70 threshold for the first time since March 19 — over a month ago.
Just yesterday, its RSI was at 51.4, signaling a sharp increase in buying momentum within a short period.
This jump suggests that XRP is entering an overbought zone, a level where price action often begins to slow or reverse, depending on broader market sentiment.
RSI is a momentum indicator that ranges from 0 to 100 and helps traders assess whether an asset is overbought or oversold. A reading above 70 typically signals overbought conditions, suggesting that the asset may be due for a pullback.
A reading below 30, on the other hand, signals oversold conditions and potential for a bounce. With XRP now at 76.19, traders may begin to watch for signs of weakening momentum or consolidation. Despite that, some analysts claim XRP market cap could soon surpass Ethereum’s.
However, strong upward RSI moves can also signal the start of a breakout if supported by volume and broader bullish sentiment.
Ichimoku Signals Align for XRP as Cloud Turns Bullish
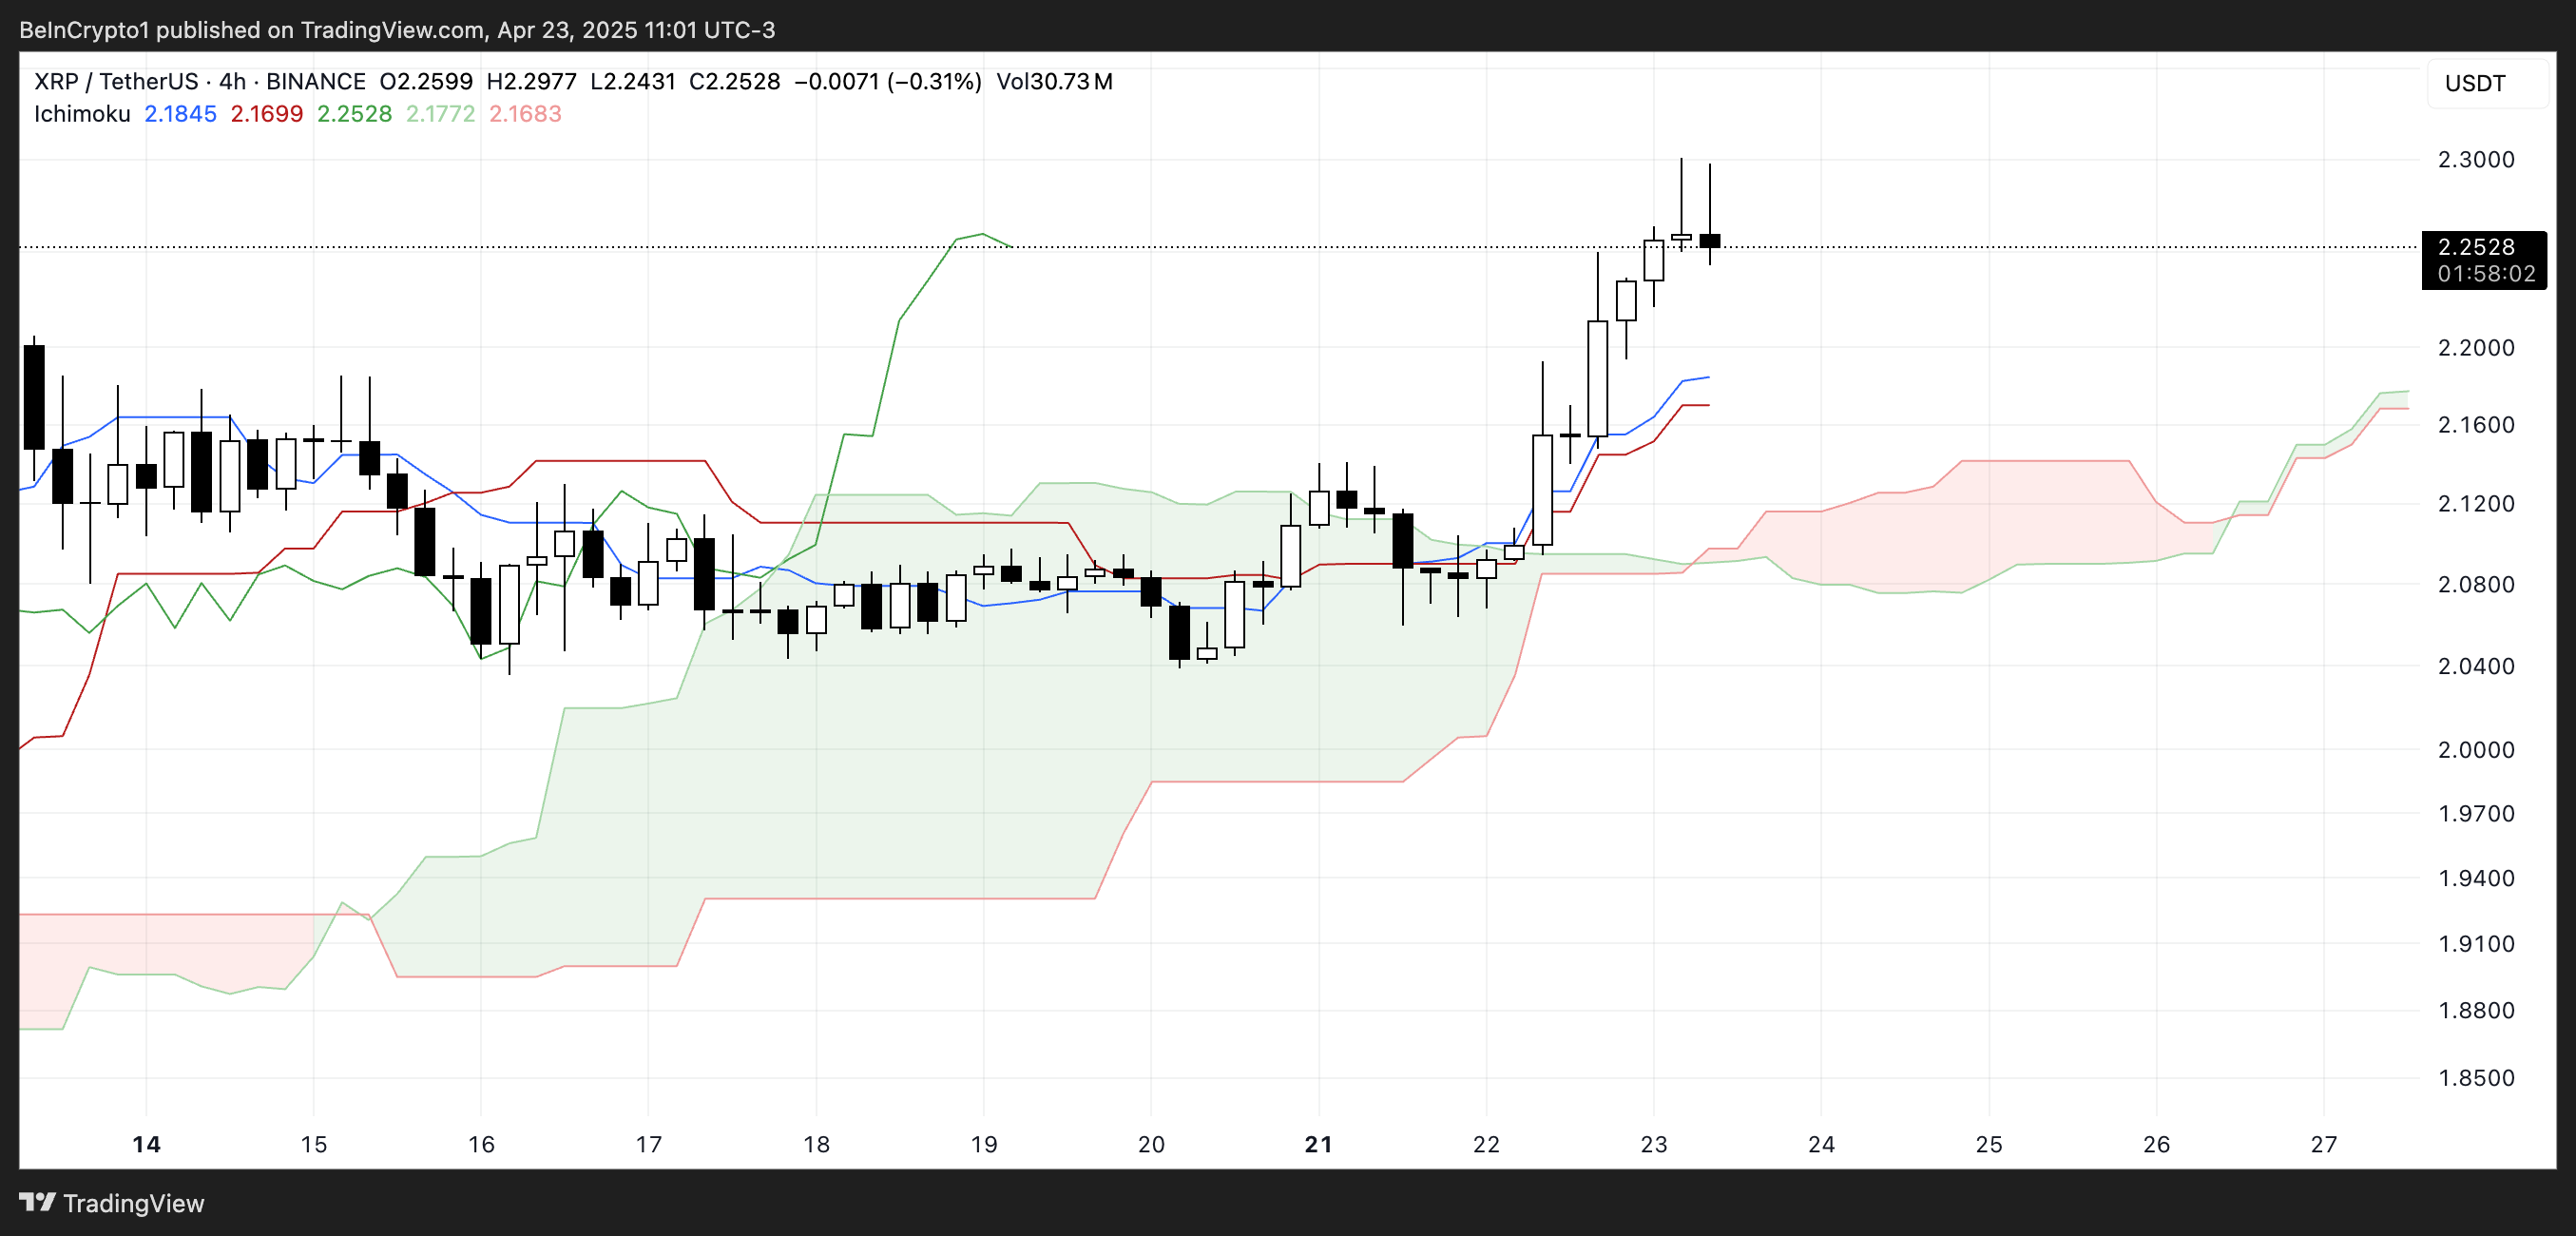
XRP’s Ichimoku Cloud remains in a bullish configuration, with the price clearly positioned above the Kumo (cloud), formed by the Senkou Span A (green line) and Senkou Span B (red line).
This indicates a continuation of upward momentum, though the green cloud ahead is narrower than before, suggesting that bullish conviction may not be as strong as in earlier phases of the trend.
The Tenkan-sen (blue line) is above the Kijun-sen (red line), signaling short-term bullish momentum through a positive crossover.
Meanwhile, the Chikou Span (green lagging line) is well above the cloud, confirming that current momentum is supported by past price strength.
However, the thinner cloud ahead calls for some caution — while the trend remains bullish, a weaker cloud can suggest reduced support if the price turns.
For now, XRP has a positive technical structure, but traders will monitor for any signs of weakness.
XRP Builds Momentum on Golden Crosses—Reversal or Rally?
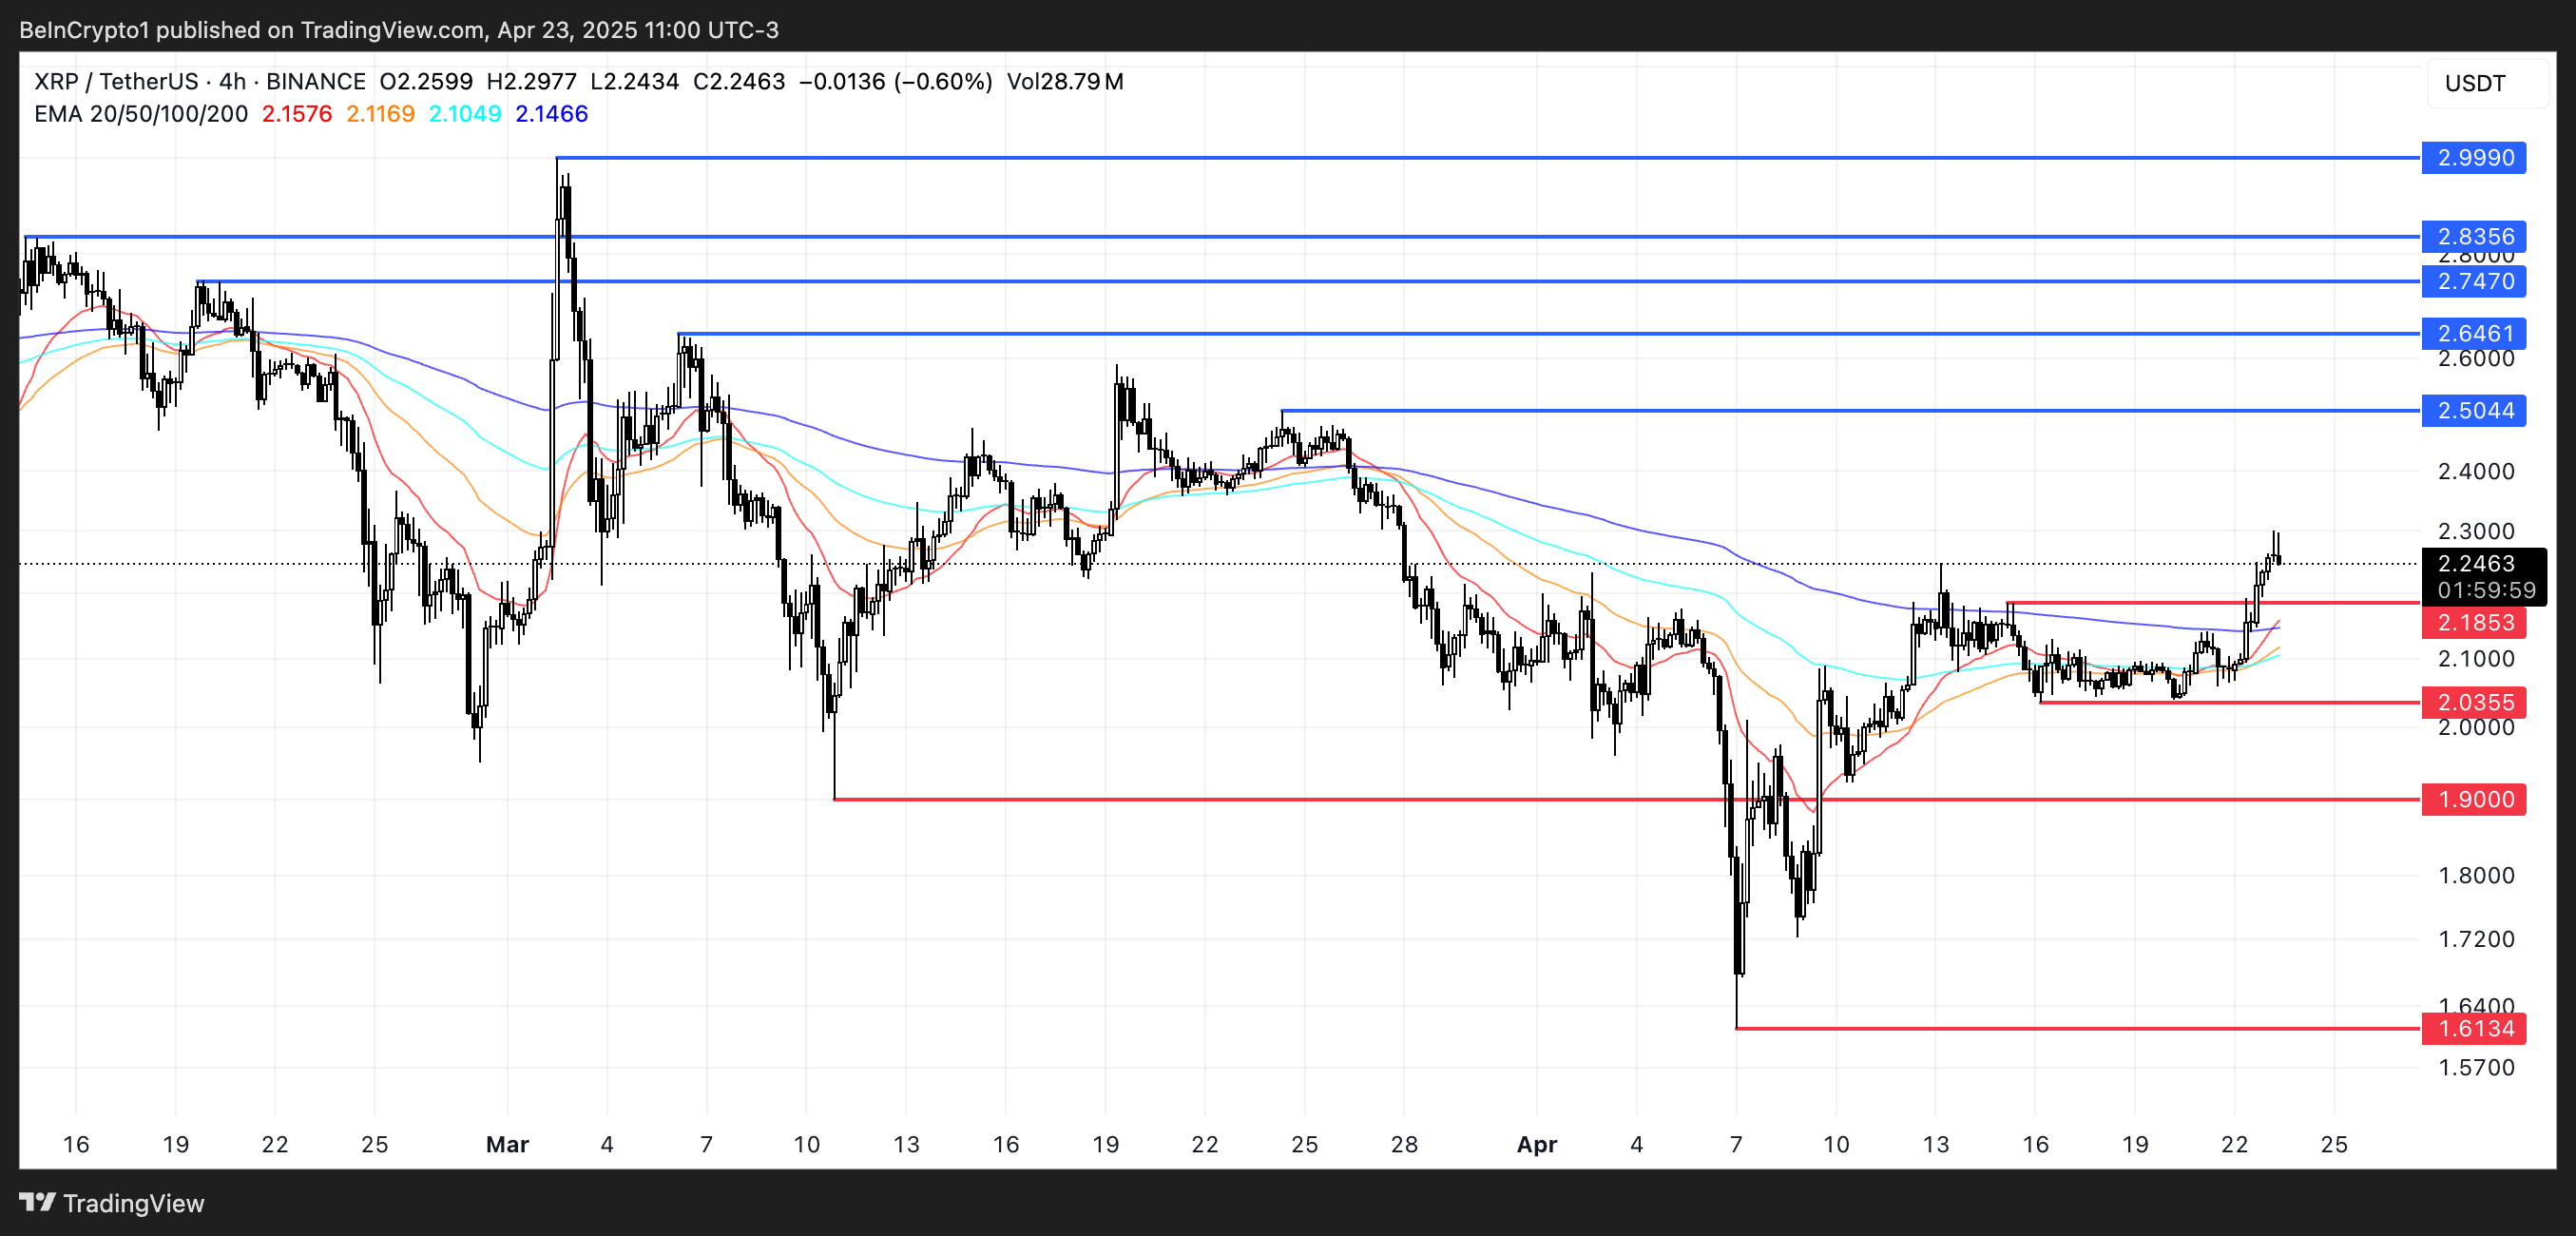
XRP’s exponential moving average (EMA) lines have formed consecutive golden crosses since yesterday, a strong bullish signal that indicates growing upward momentum.
This pattern suggests that short-term averages are crossing above longer-term ones, often seen as a sign of a trend reversal or the beginning of a new uptrend.
If this momentum continues, XRP price could climb to test $2.50, with further resistance levels at $2.64, $2.74, and $2.83.
Should the broader bullish sentiment return, XRP may even attempt to reclaim the $2.99 level — and possibly break above $3 for the first time in months.
However, if the momentum fades and the trend reverses, XRP could pull back to test support at $2.18. A loss of that level would open the door for a deeper correction toward $2.03.
Continued downside pressure could push XRP below the $2 mark, with the next major support levels at $1.90 and $1.61.