In a massive development, White House crypto adviser Bo Hines has provided an update on the crypto policy report that the President’s Digital Asset Working Group was working on. They plan to release it on July 30, with the crypto community highly anticipating an update on the Strategic Bitcoin Reserve. U.S. Crypto Policy Report To
Paul Atkins, a pro-crypto lawyer, has become the new head of the Securities and Exchange Commission (SEC). He replaces Gary Gensler, an official who focused on litigation, filing lawsuits against multiple companies. Therefore, it is likely that some altcoins, such as Hedera Hashgraph (HBAR), Ripple (XRP), and Solana (SOL), will surge 10X after this change in leadership at the agency.
Best Altcoins to Buy for 10X Gains as Paul Atkins Becomes SEC Chair
The crypto market is expected to thrive after the new change in leadership. A likely catalyst for this is that the agency is expected to approve most of the 72 crypto ETFs filed by companies such as Franklin Templeton, Canary, and Grayscale.
Additionally, the SEC is likely to avoid filing major lawsuits against the crypto sector. XLM, XRP, and SOL will all be beneficiaries of these events.
Hedera Hashgraph (HBAR)
Hedera Hashgraph is one of the top altcoins that could surge 10x after the recent events at the SEC. That’s because Canary has applied for a spot HBAR ETF, which will likely be approved in the coming months.
HBAR price has also formed a falling wedge pattern on the daily chart. The two lines are nearing their confluence level, while the price has moved slightly above the upper side. Additionally, top oscillators, such as the Relative Strength Index, have formed a bullish divergence pattern, indicating a strong surge.
Therefore, the HBAR token is likely to experience a strong bullish breakout in the coming months, with a target of $0.2500.
Hedera Price Chart
Ripple (XRP)
XRP is another top altcoin to buy due to its history with the SEC. The SEC recently concluded its litigation with Ripple, allowing the company to engage in transactions with other financial services industry entities.
The agency is also expected to approve some or all of the ETF applications by companies like Grayscale, Canary, Bitwise, and 21Shares. Such a move is expected to lead to over $8 billion in inflows.
XRP price has formed a falling wedge chart pattern, pointing to an eventual rally in the coming weeks. If this happens, the price to watch will be $3, up by 43% from the current level.
XRP Price Chart
Solana (SOL)
Solana is also one of the top altcoins to buy and hold for 10x gains in the near term. Like XRP and HBAR, several companies like Canary and Bitwise have applied for a spot SOL ETF.
The coin has also formed a cup-and-handle pattern on the weekly chart. It has a depth of about 96%. Therefore, measuring the same distance from the upper side of this pattern will bring the next target to $500.
Solana Price Chart
Solana may also benefit from the growing ecosystem, and the fact that some companies like Upexy and Janover have started accumulating the token.
XRP has been consolidating over the last few days, managing to stay above the $2 mark. However, after validating a four-month-long downtrend earlier this month, the altcoin is struggling to sustain its current position.
As investor interest wanes, XRP may face challenges in maintaining upward momentum.
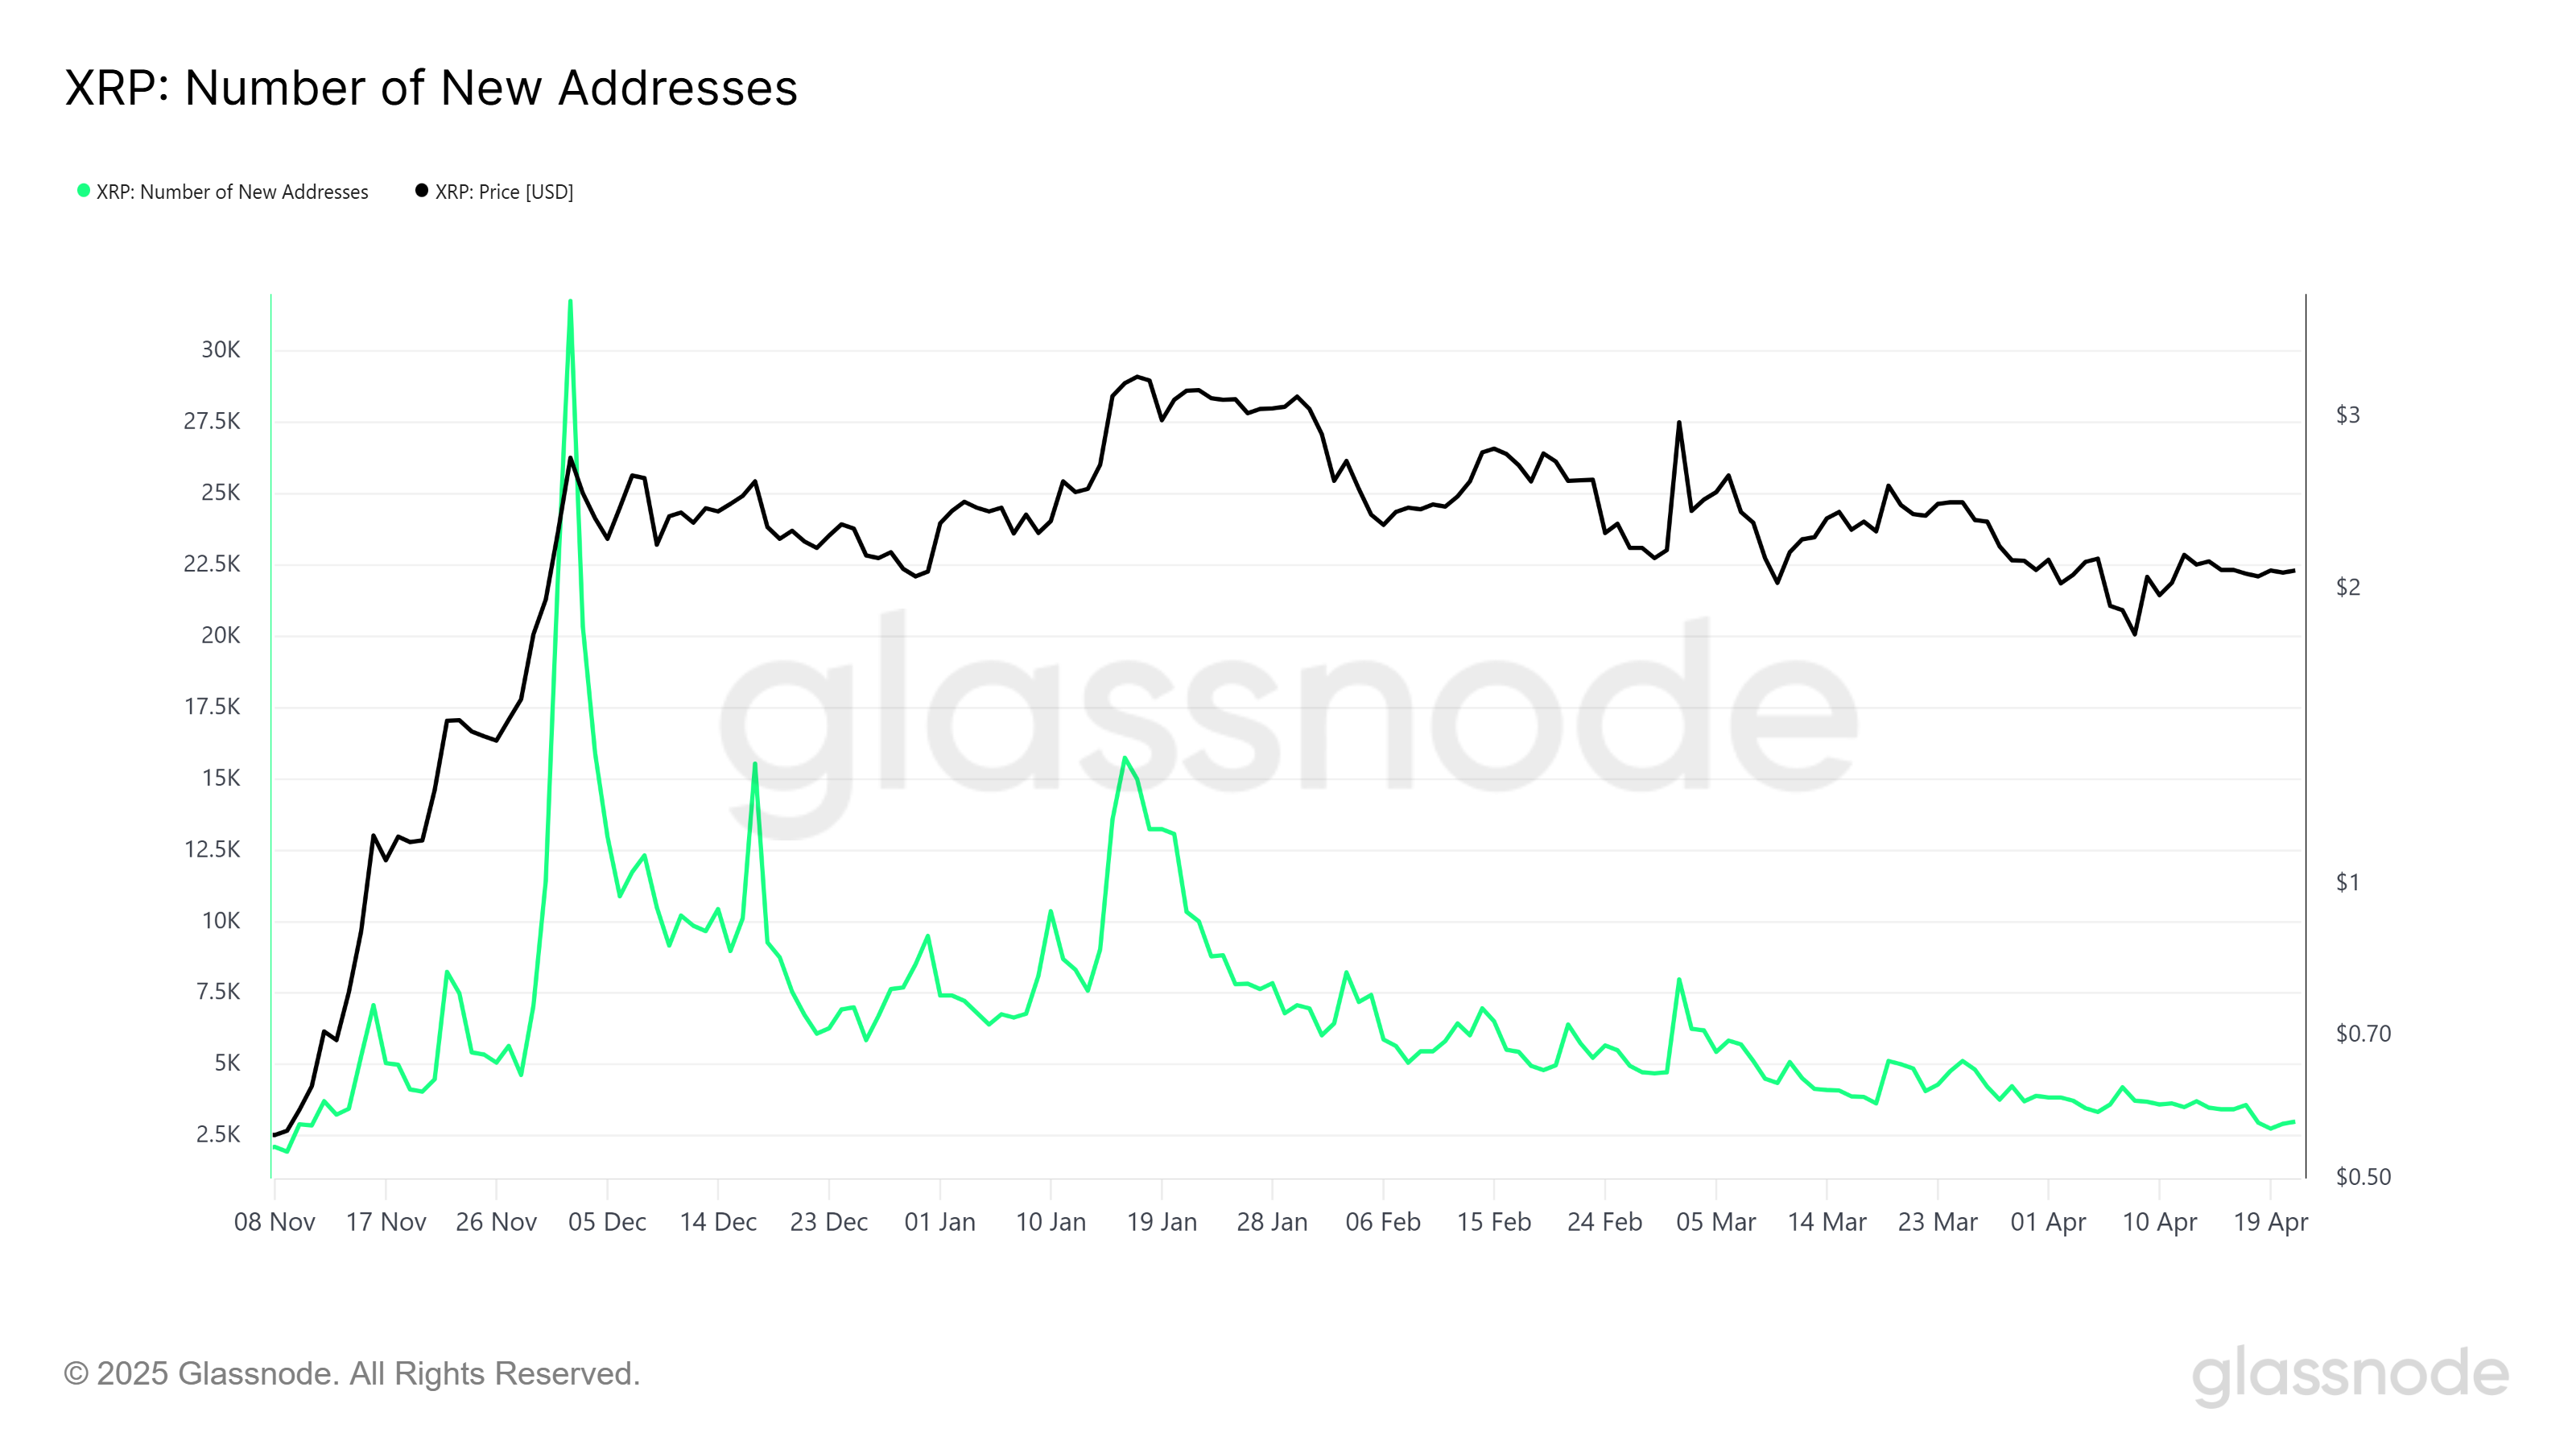
XRP Is Losing Investors’ Interest
New addresses associated with XRP have hit a 5-month low, signaling a decline in new investor interest. This suggests that XRP is losing traction within the market as fresh capital fails to flow into the asset. The absence of new buyers could make it difficult for XRP to maintain its position above $2.
The falling demand is concerning as XRP’s price growth is often supported by new market participants. With fewer investors entering the market, the altcoin may face a prolonged period of stagnation. Unless there is a shift in demand, XRP’s ability to maintain its price level could be compromised.
The overall macro momentum for XRP remains weak, as reflected by technical indicators like the RSI. Currently stuck below the neutral line of 50.0, the RSI suggests that XRP is still in the bearish zone. This indicates a lack of bullish momentum, which could prevent the altcoin from seeing any significant rallies in the near term.
In addition, the broader market sentiment continues to be bearish, which further impacts XRP’s potential for recovery. Unless the market turns around or the altcoin finds new sources of demand, XRP’s price will likely remain suppressed.
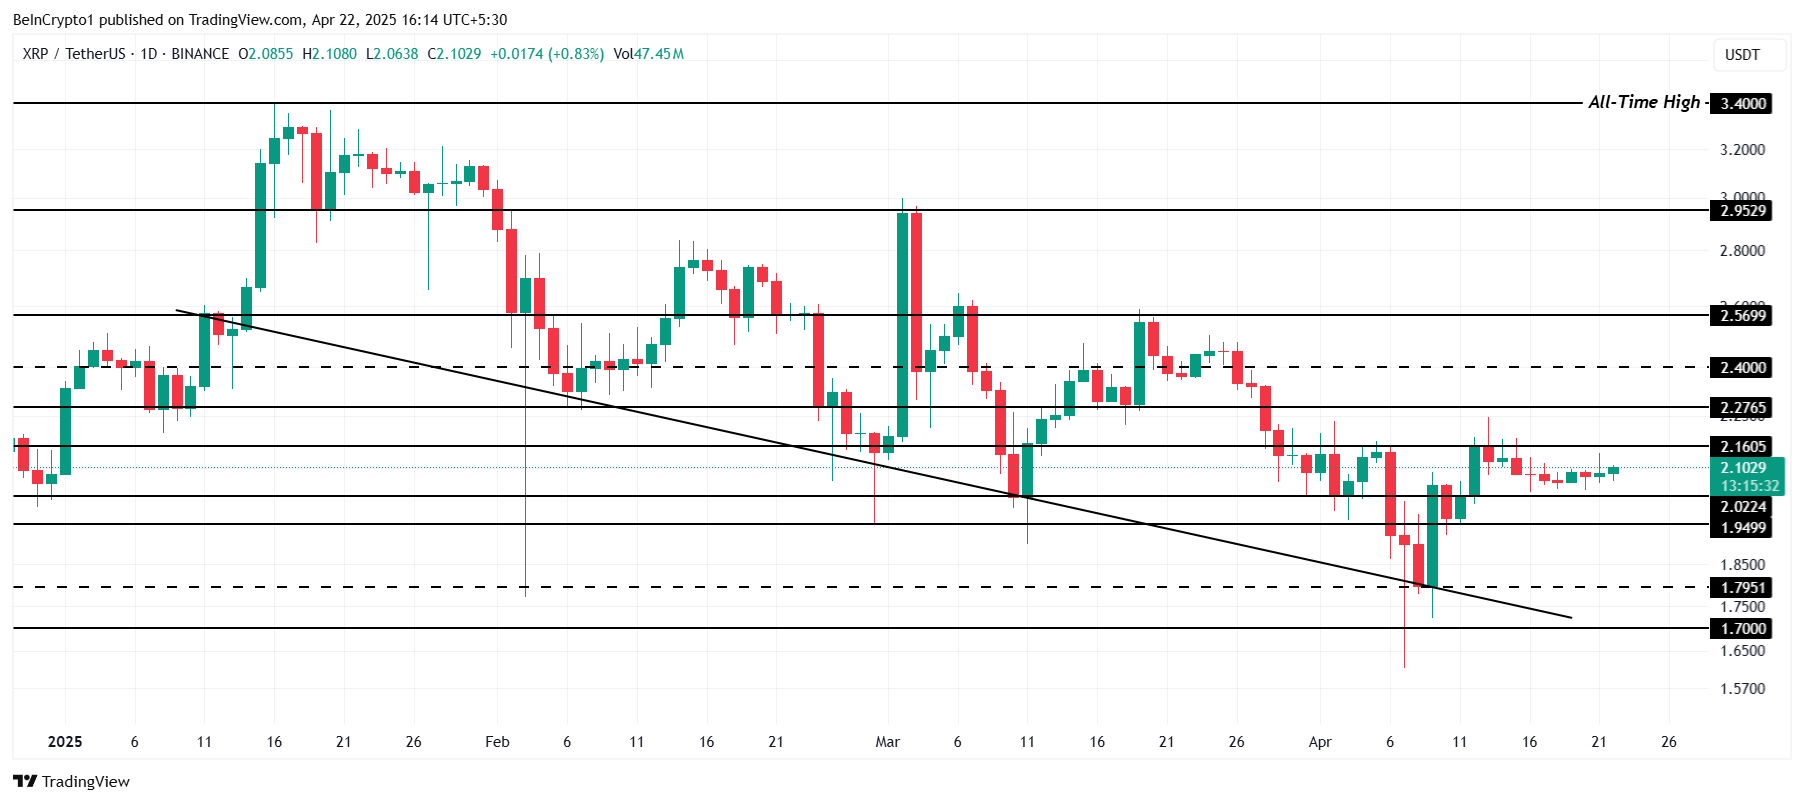
XRP’s price is currently at $2.10, holding above the $2.02 support level but facing resistance at $2.16. The ongoing downtrend that has persisted since the beginning of the year continues to weigh heavily on the altcoin. If the price fails to break through the resistance level, XRP may try to push higher.
The current market conditions could prevent XRP from surpassing $2.16. However, if the price loses the $2.02 support, it may drop to the next support level of $1.94. Should this happen, the altcoin could experience a more significant decline, potentially reaching as low as $1.79.
Alternatively, if XRP manages to breach the $2.16 resistance, it could rally towards $2.27. With a change in investor sentiment and market conditions, this could propel the altcoin to $2.40, invalidating the bearish outlook.
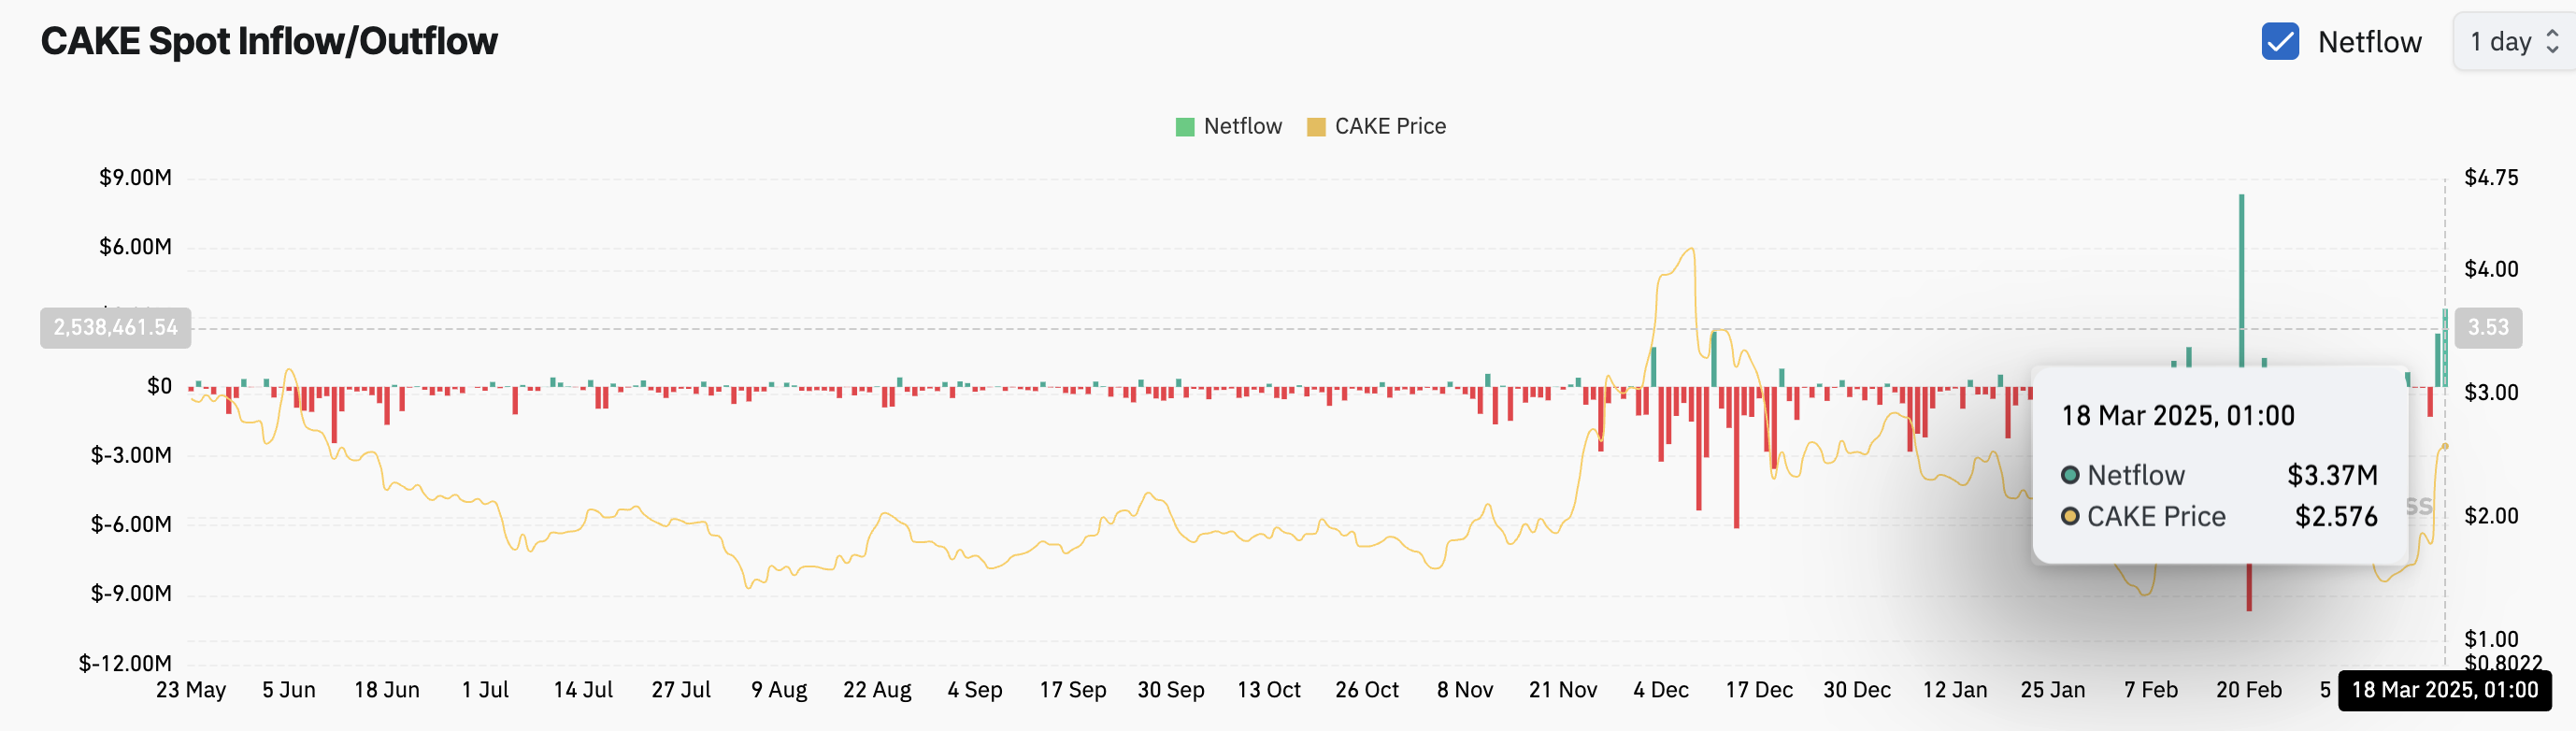
PancakeSwap’s CAKE token is the market’s top performer today, surging 21% in the past 24 hours. At press time, the altcoin trades at $2.56.
This rally comes as CAKE records its highest daily spot inflow in a month amid strong demand and renewed investor interest in the token.
CAKE Rockets Higher with $3.37 Million Inflows—Is More Upside Ahead?
CAKE’s price rally is primarily driven by the sharp increase in trading activity on the PancakeSwap decentralized exchange (DEX). Over the past few days, the platform has seen a significant uptick in daily trading volume, outperforming Ethereum’s Uniswap and Solana’s Raydium.
The trend has triggered a surge in demand for the DEX’s native token, CAKE, causing its value to soar by double digits. The uptick in buying pressure is reflected by the token’s spot inflows, currently at $3.37 million, its single-day highest figure in the past month.
When an asset records spot inflows, the number of tokens purchased and moved into spot markets has increased, indicating rising demand. CAKE’s high spot inflows suggest that investors are actively accumulating the asset. If this buying pressure continues, it can drive further price appreciation.
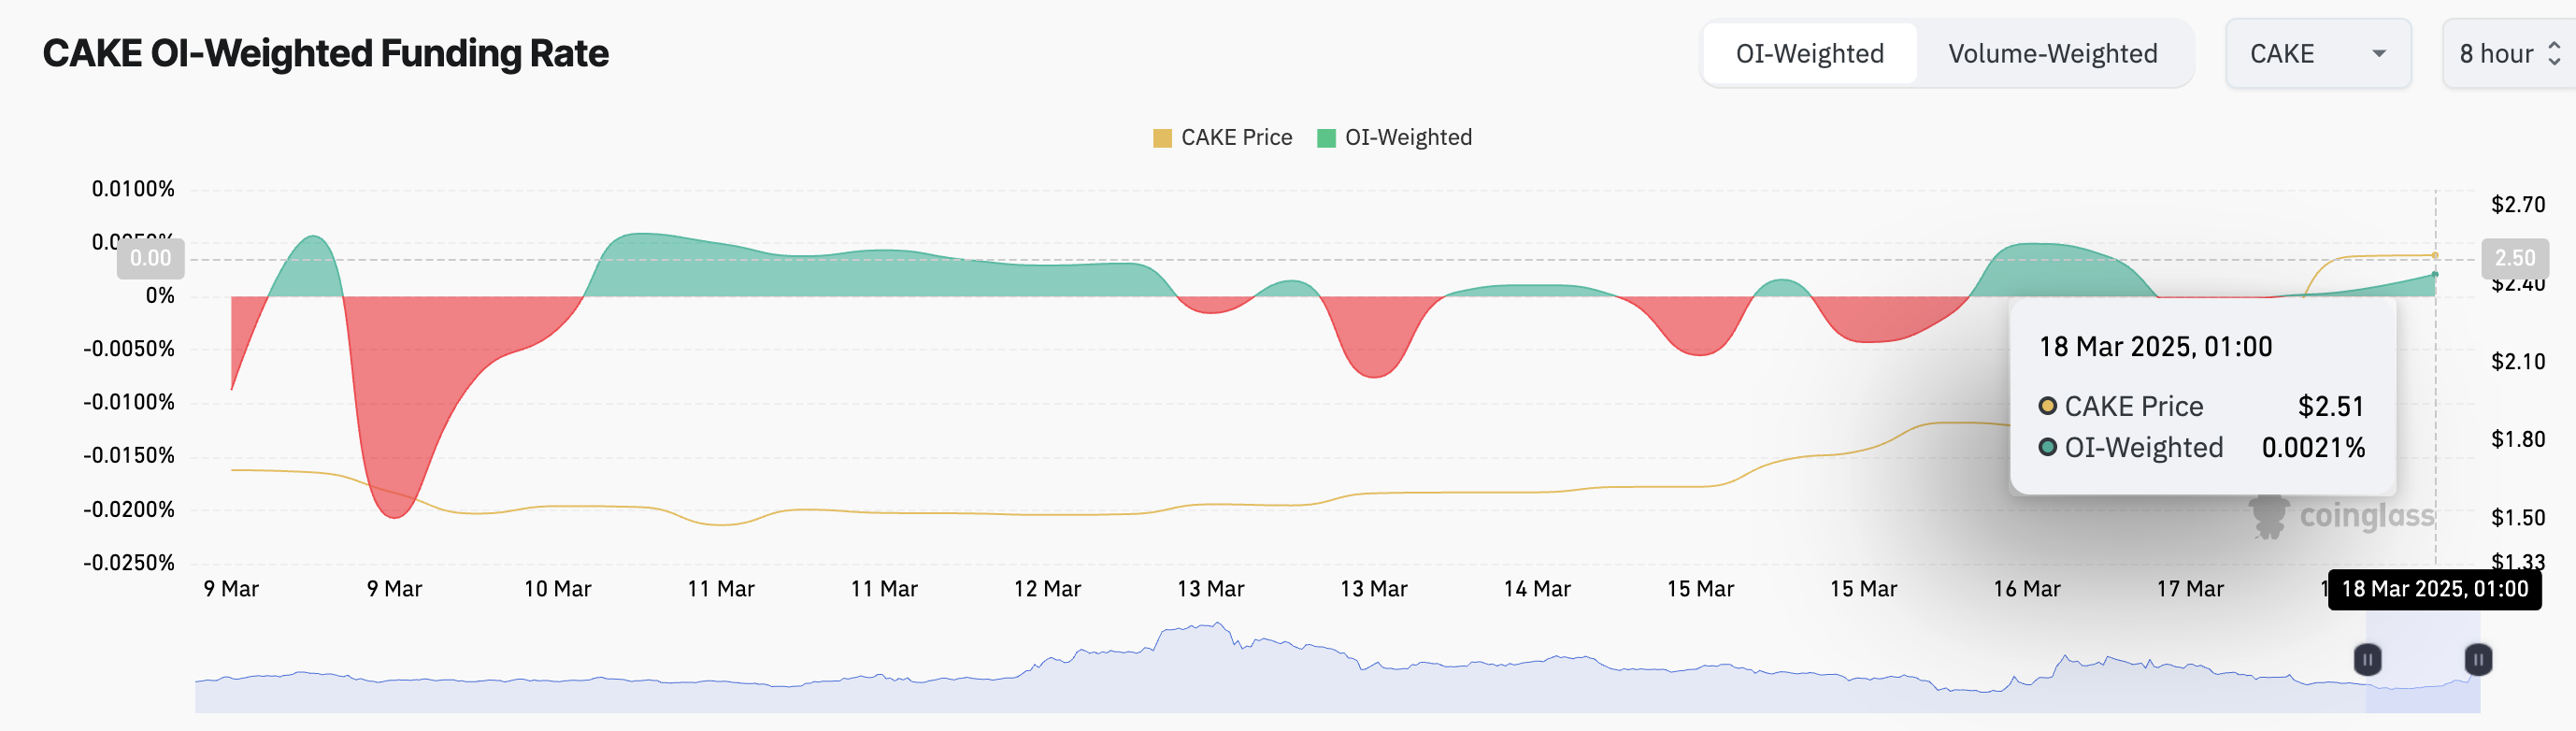
This is a bullish signal, especially as it is accompanied by positive market sentiment, as shown by the token’s funding rate, which is 0.0021% as of this writing.
The funding rate is a periodic fee exchanged between long and short traders in perpetual futures contracts to keep the contract price aligned with the spot market. A positive funding rate means long traders are paying short traders, indicating strong demand and bullish market sentiment for CAKE.
With rising inflows and growing demand, CAKE’s price performance suggests that traders are positioning for further upside. If demand continues at this pace, the token could extend its gains, drawing even more liquidity into PancakeSwap’s ecosystem.
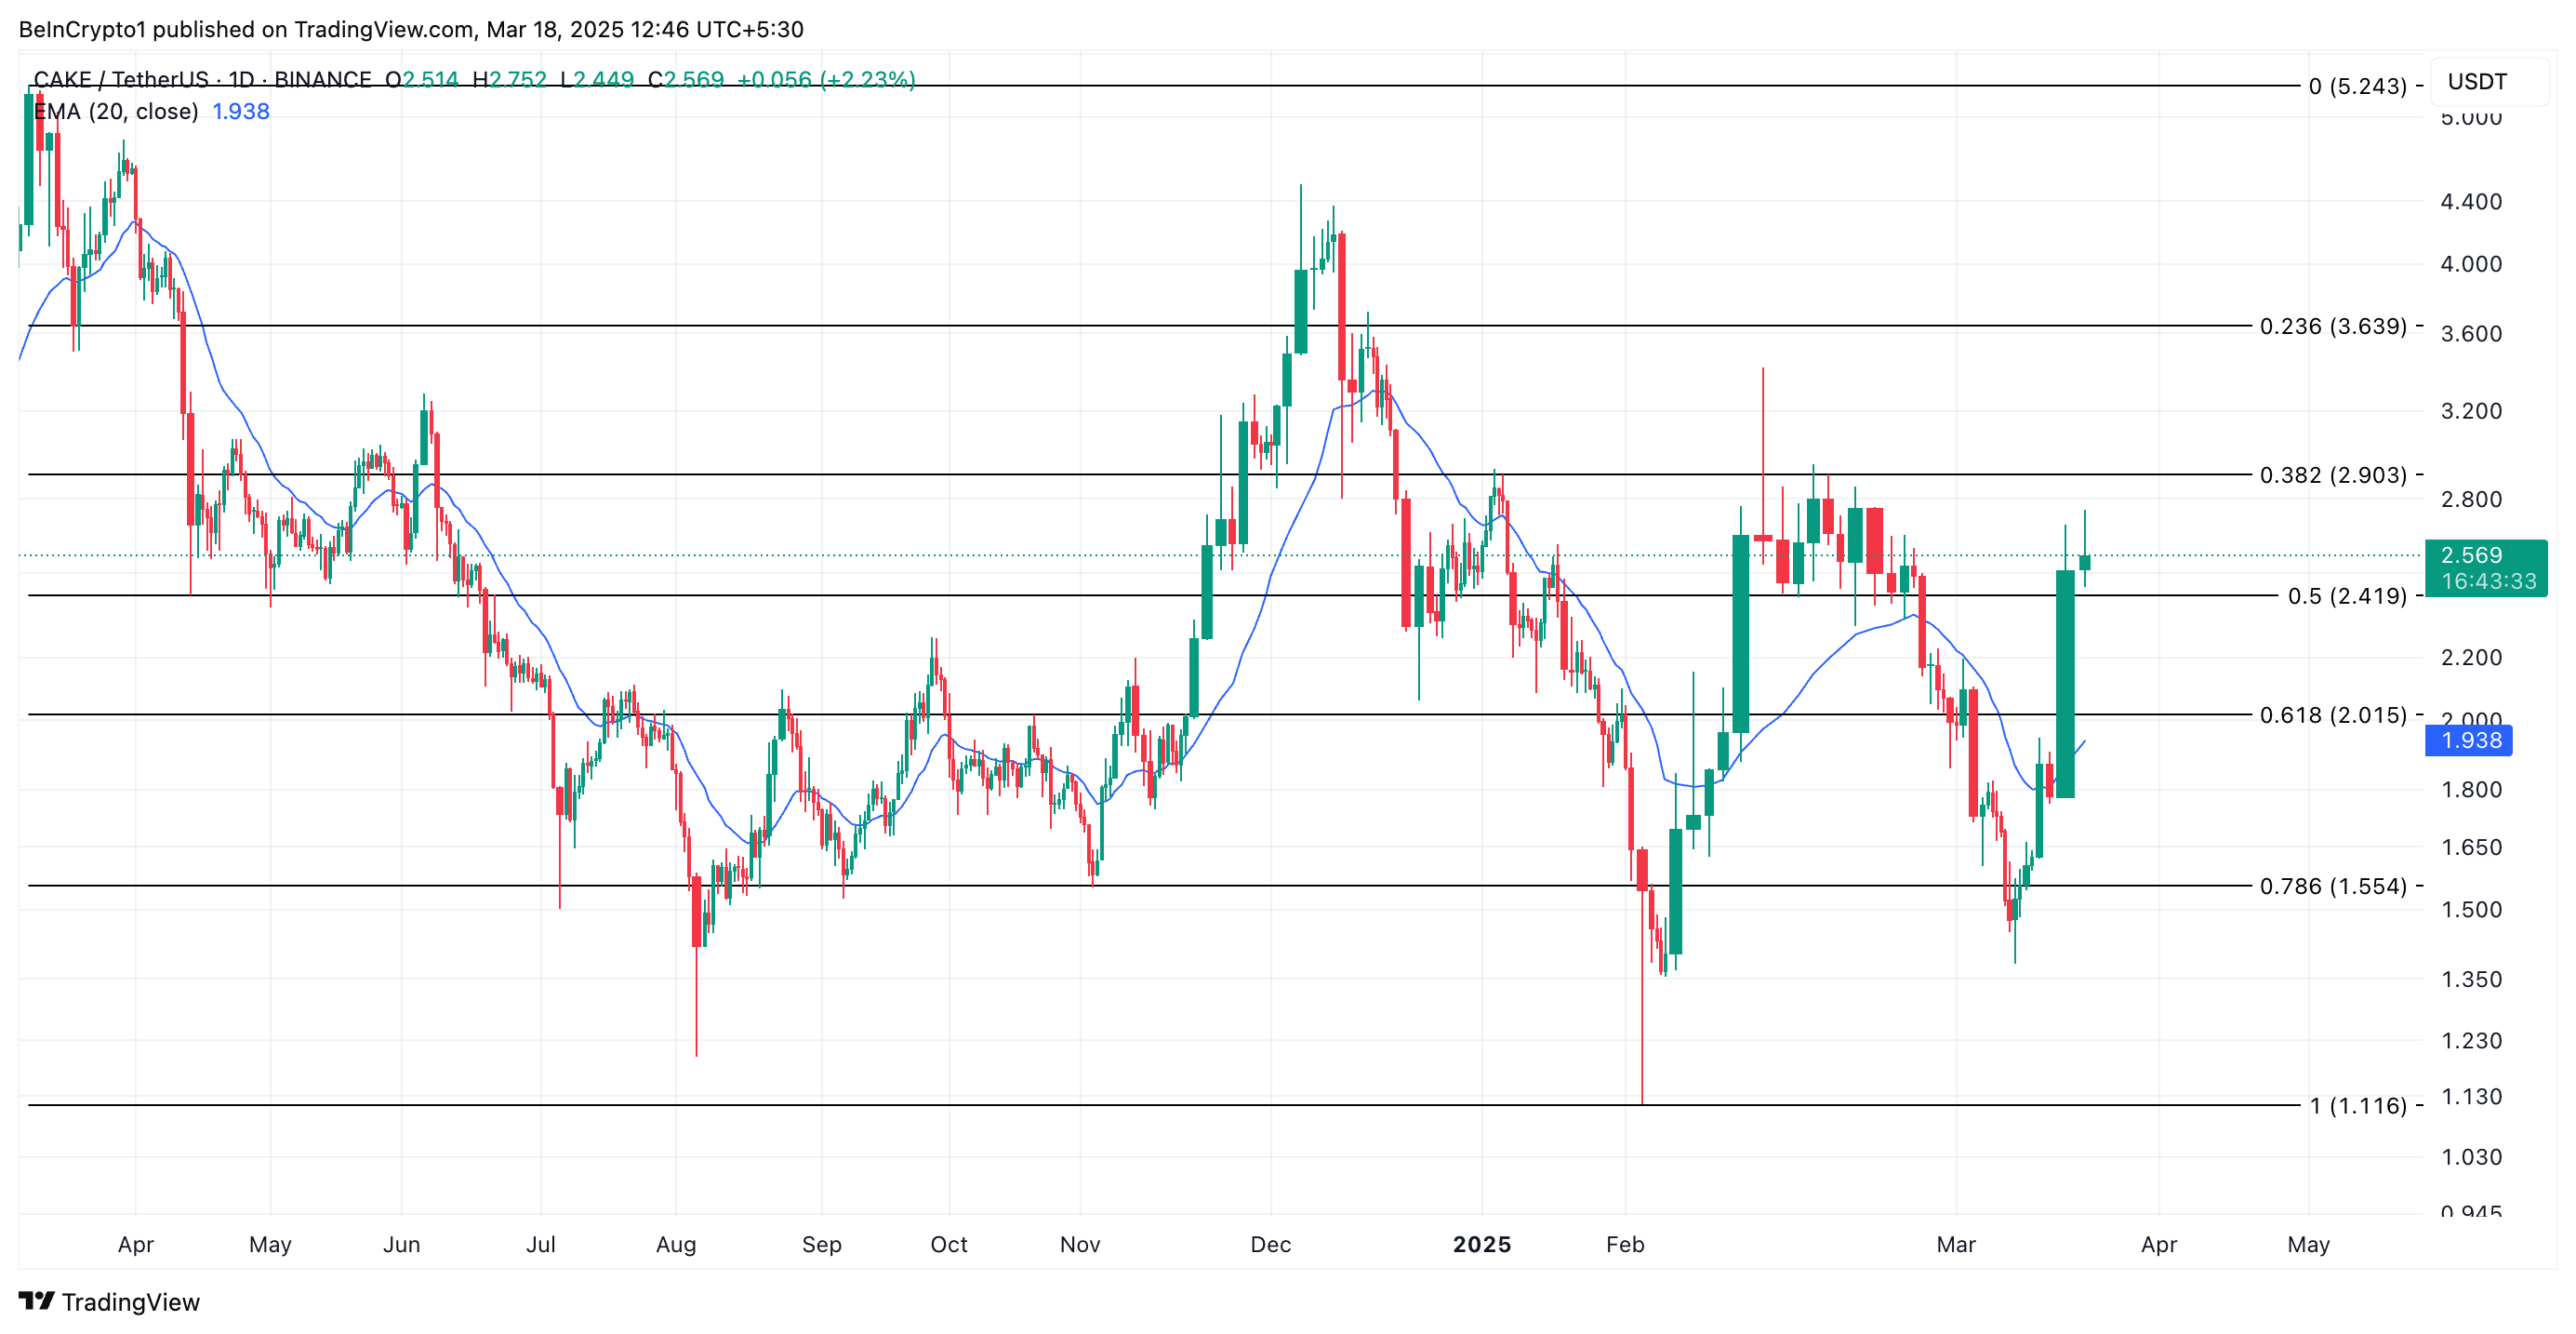
CAKE’s rally has pushed it significantly above its 20-day exponential moving average (EMA) which now forms dynamic support below its price at $1.93.
This moving average measures an asset’s average price over the past 20 trading days. It gives more weight to recent price data, making it more responsive to price movements than a simple moving average.
When an asset’s price climbs above the 20-day EMA, it signals bullish momentum, suggesting that buyers are in control and the asset may continue its upward trend.
If this trend persists, CAKE could extend its uptrend to $2.90.
On the other hand, a resurgence in profit-taking activity could prevent this from happening. If CAKE demand stalls and it sheds its recent gains, its value could plunge to $2.41. If that support level fails to hold, the token’s price could drop to $2.01.