Grayscale and VanEck submitted amended S-1s of their proposed Solana ETFs. This is a positive sign that the funds may soon be approved. These two filings disclose sponsor fees, fund mechanics, and custodial relationships. Grayscale Sets 2.5% Fee, Cash Model for GSOL Solana ETF Grayscale’s amended filing sets a 2.5% sponsor fee and names Coinbase
Ethereum’s major holders are returning to the market. Amid the past week’s market consolidation, major players have seized the opportunity to accumulate ETH aggressively.
On-chain data reveals an uptick in whale holdings, while ETH-based exchange-traded funds (ETFs) recorded their first weekly net inflow in eight weeks, signaling a significant shift in sentiment.
ETH Whale Accumulation and ETF Inflows Hint at Imminent Price Surge
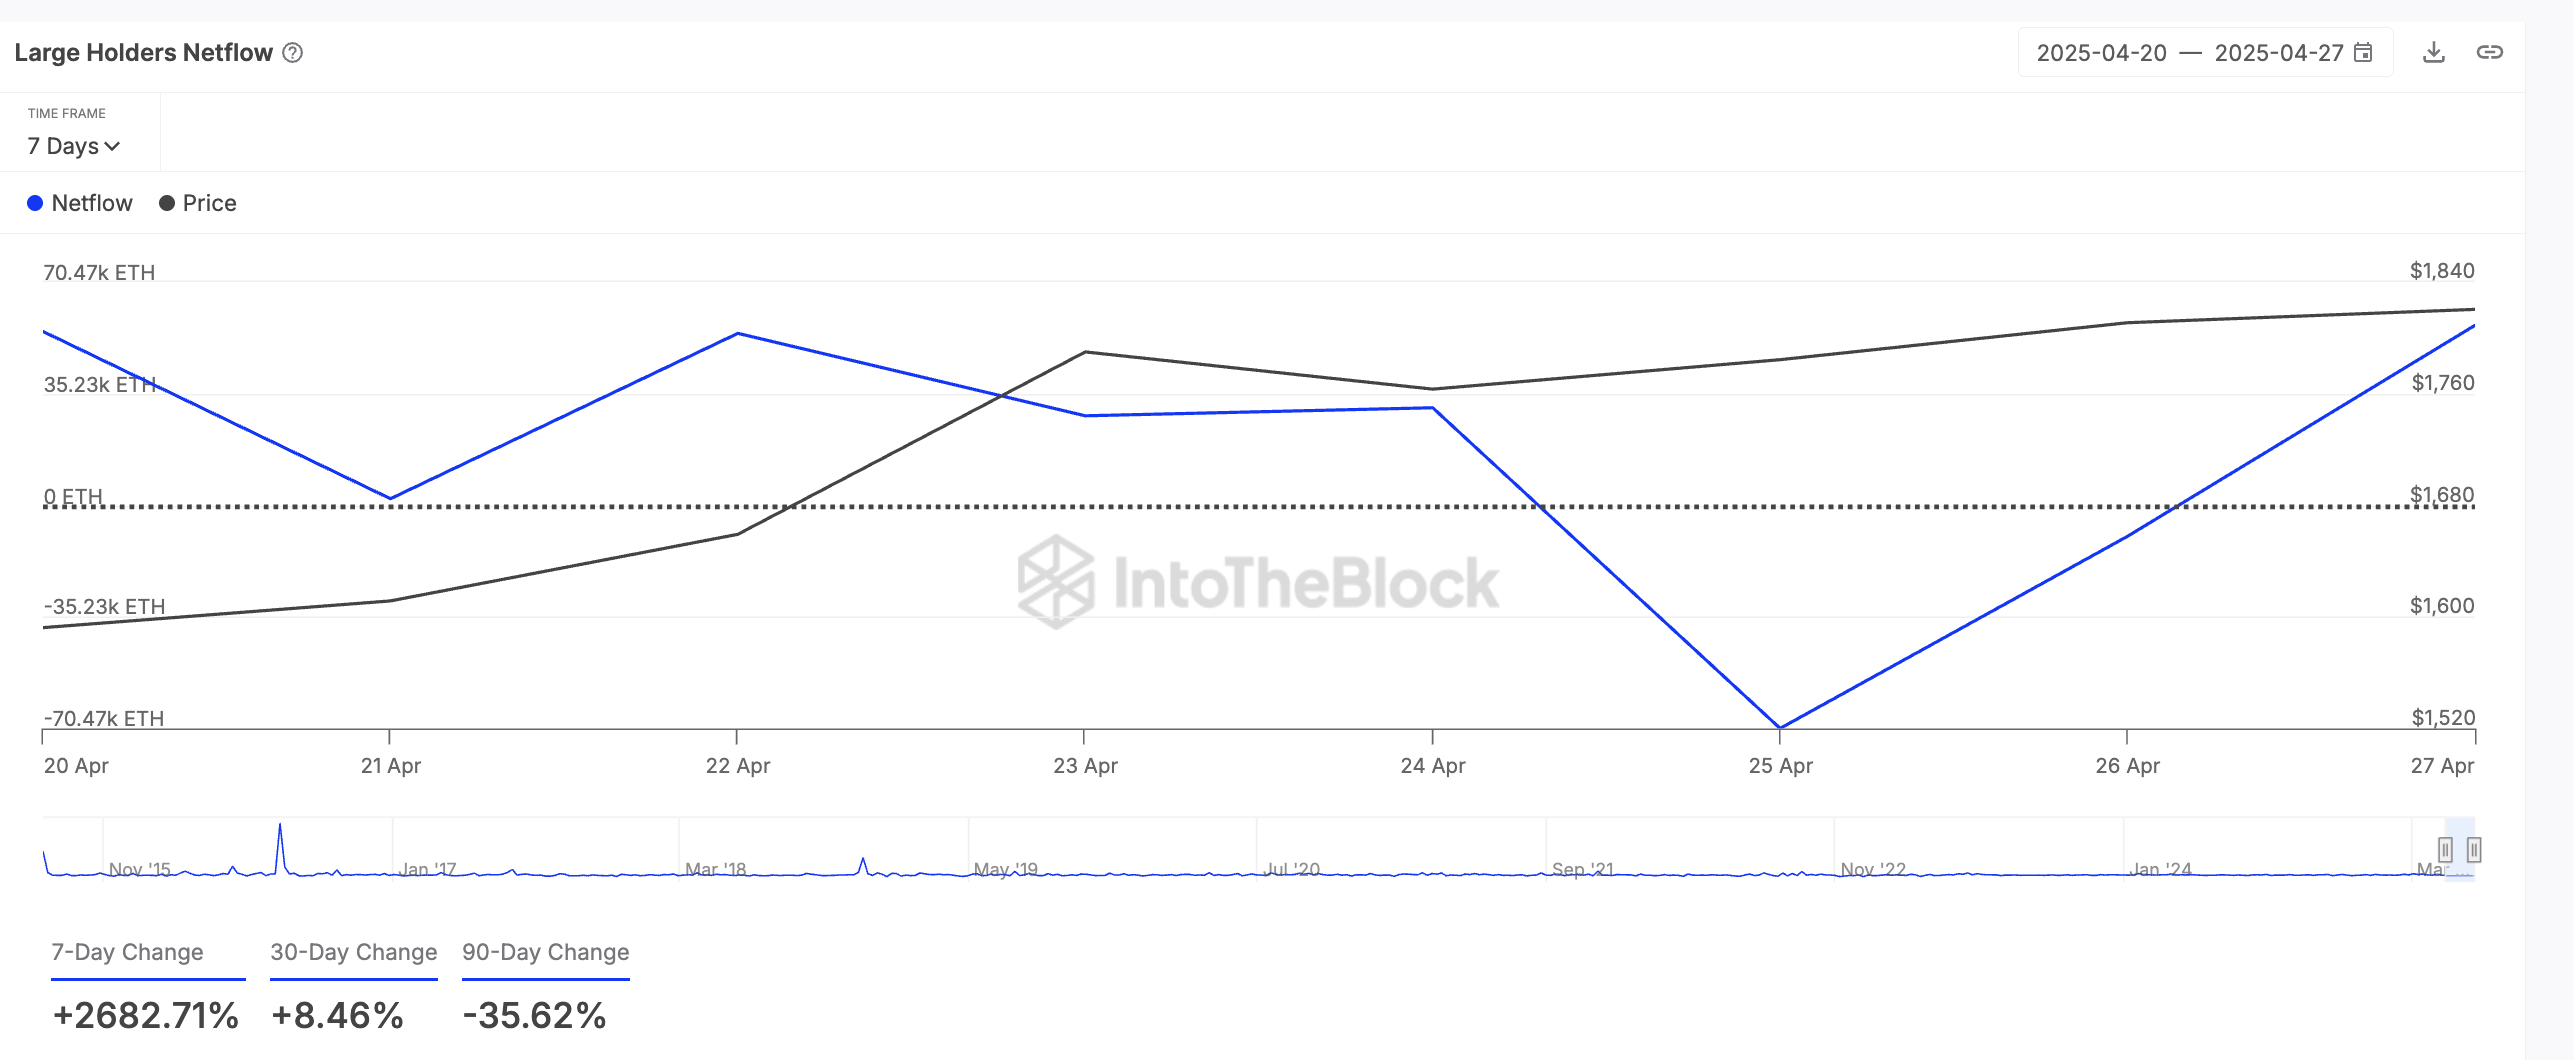
According to on-chain data, leading altcoin ETH has noted a significant spike in its large holders’ netflow over the past week. According to the on-chain data provider, this has rocketed 2682% in the past seven days.
Large holders of an asset refer to whale addresses holding more than 0.1% of its circulating supply. The large holders’ netflow metric tracks the difference between the coins these investors buy and the amount they sell over a specific period.
When an asset’s large holders’ netflow surges, its whale investors are ramping up their coin accumulation. This accumulation trend suggests a belief in ETH’s future upside, as major holders tend to act when they see value at current price levels.
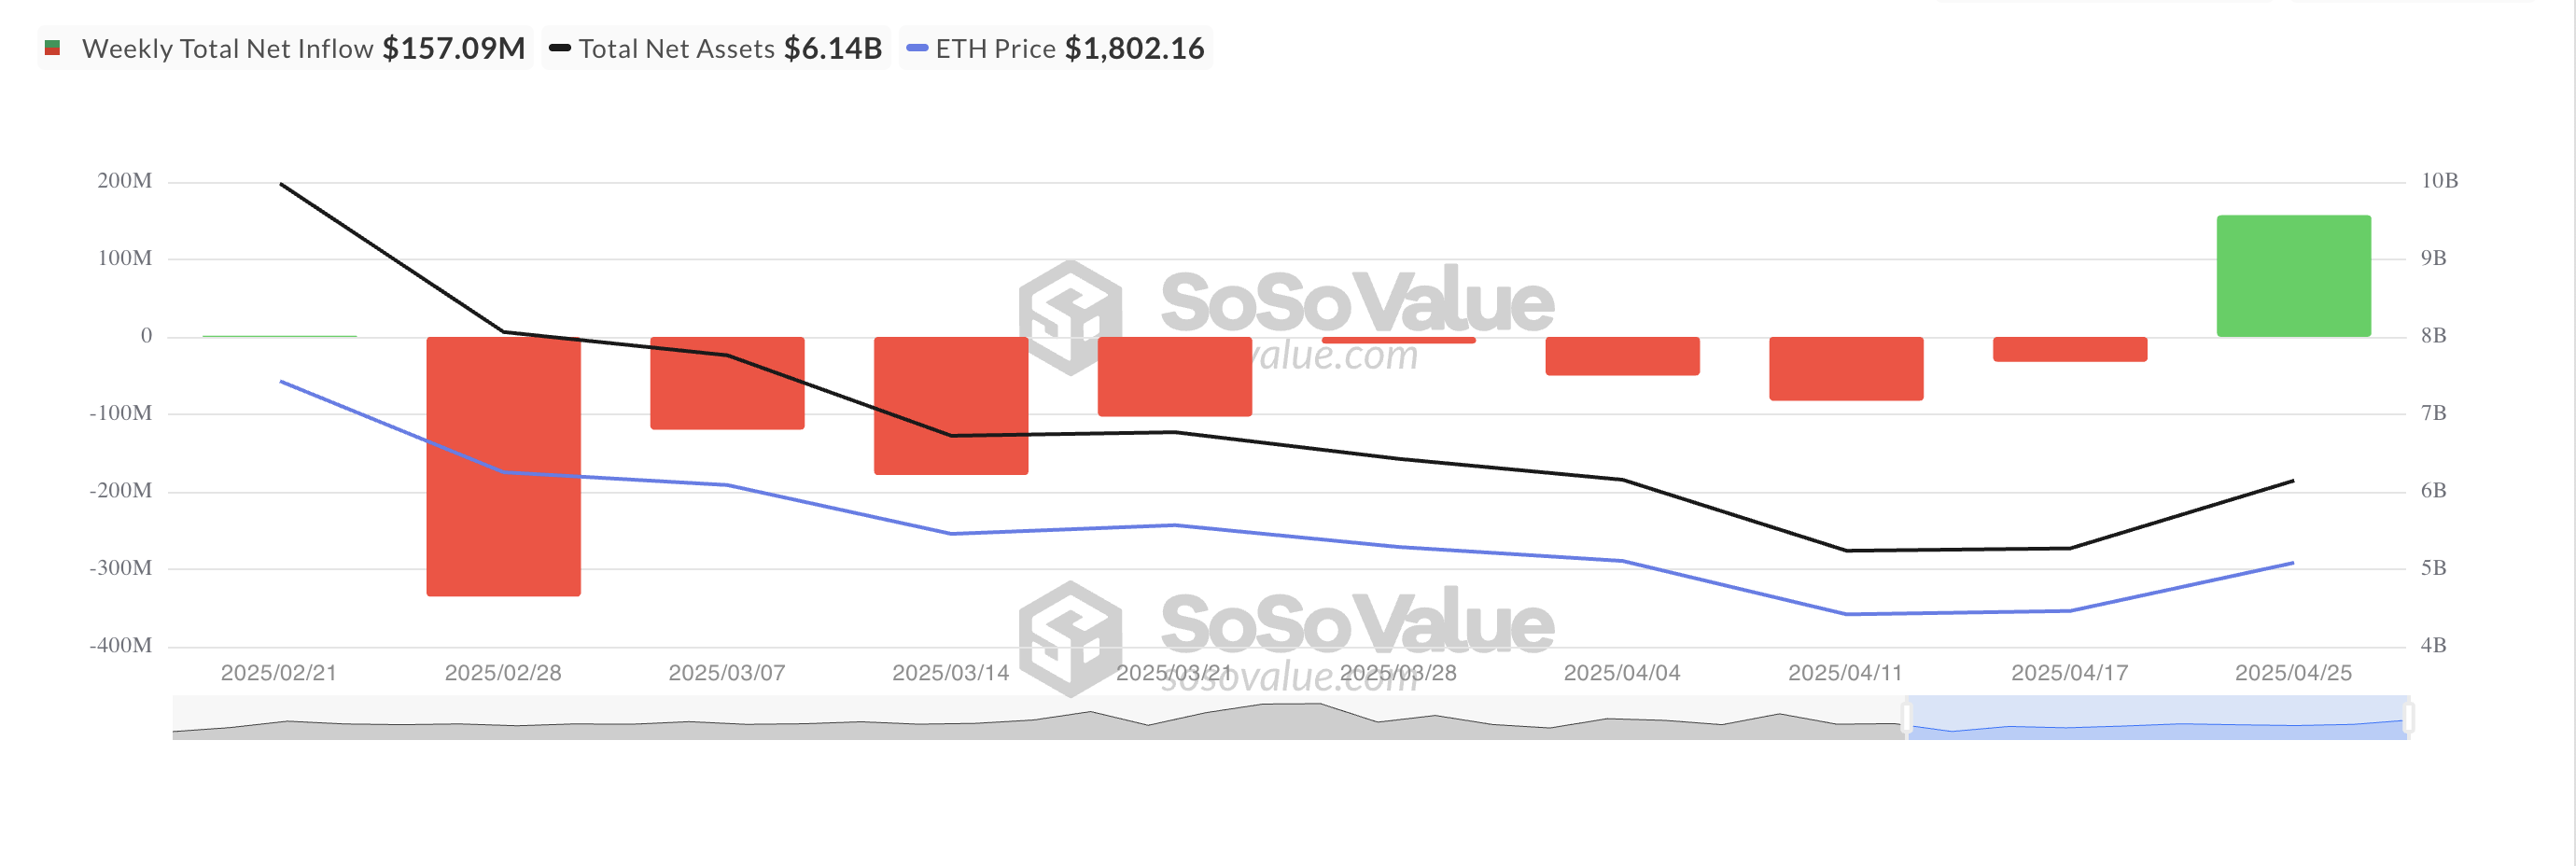
Adding to the bullish narrative, ETH-backed ETFs recorded their first weekly net inflow in eight weeks. According to SosoValue, net inflows into ETH-backed ETFs reached $157.09 million between April 21 and April 25, reversing an eight-week streak of outflows totaling over $700 million.
Total Ethereum Spot ETF Net Inflow. Source: SosoValue
With major players re-entering the market, ETH could be poised for further upside in the near term.
Ethereum Sees Bullish Momentum
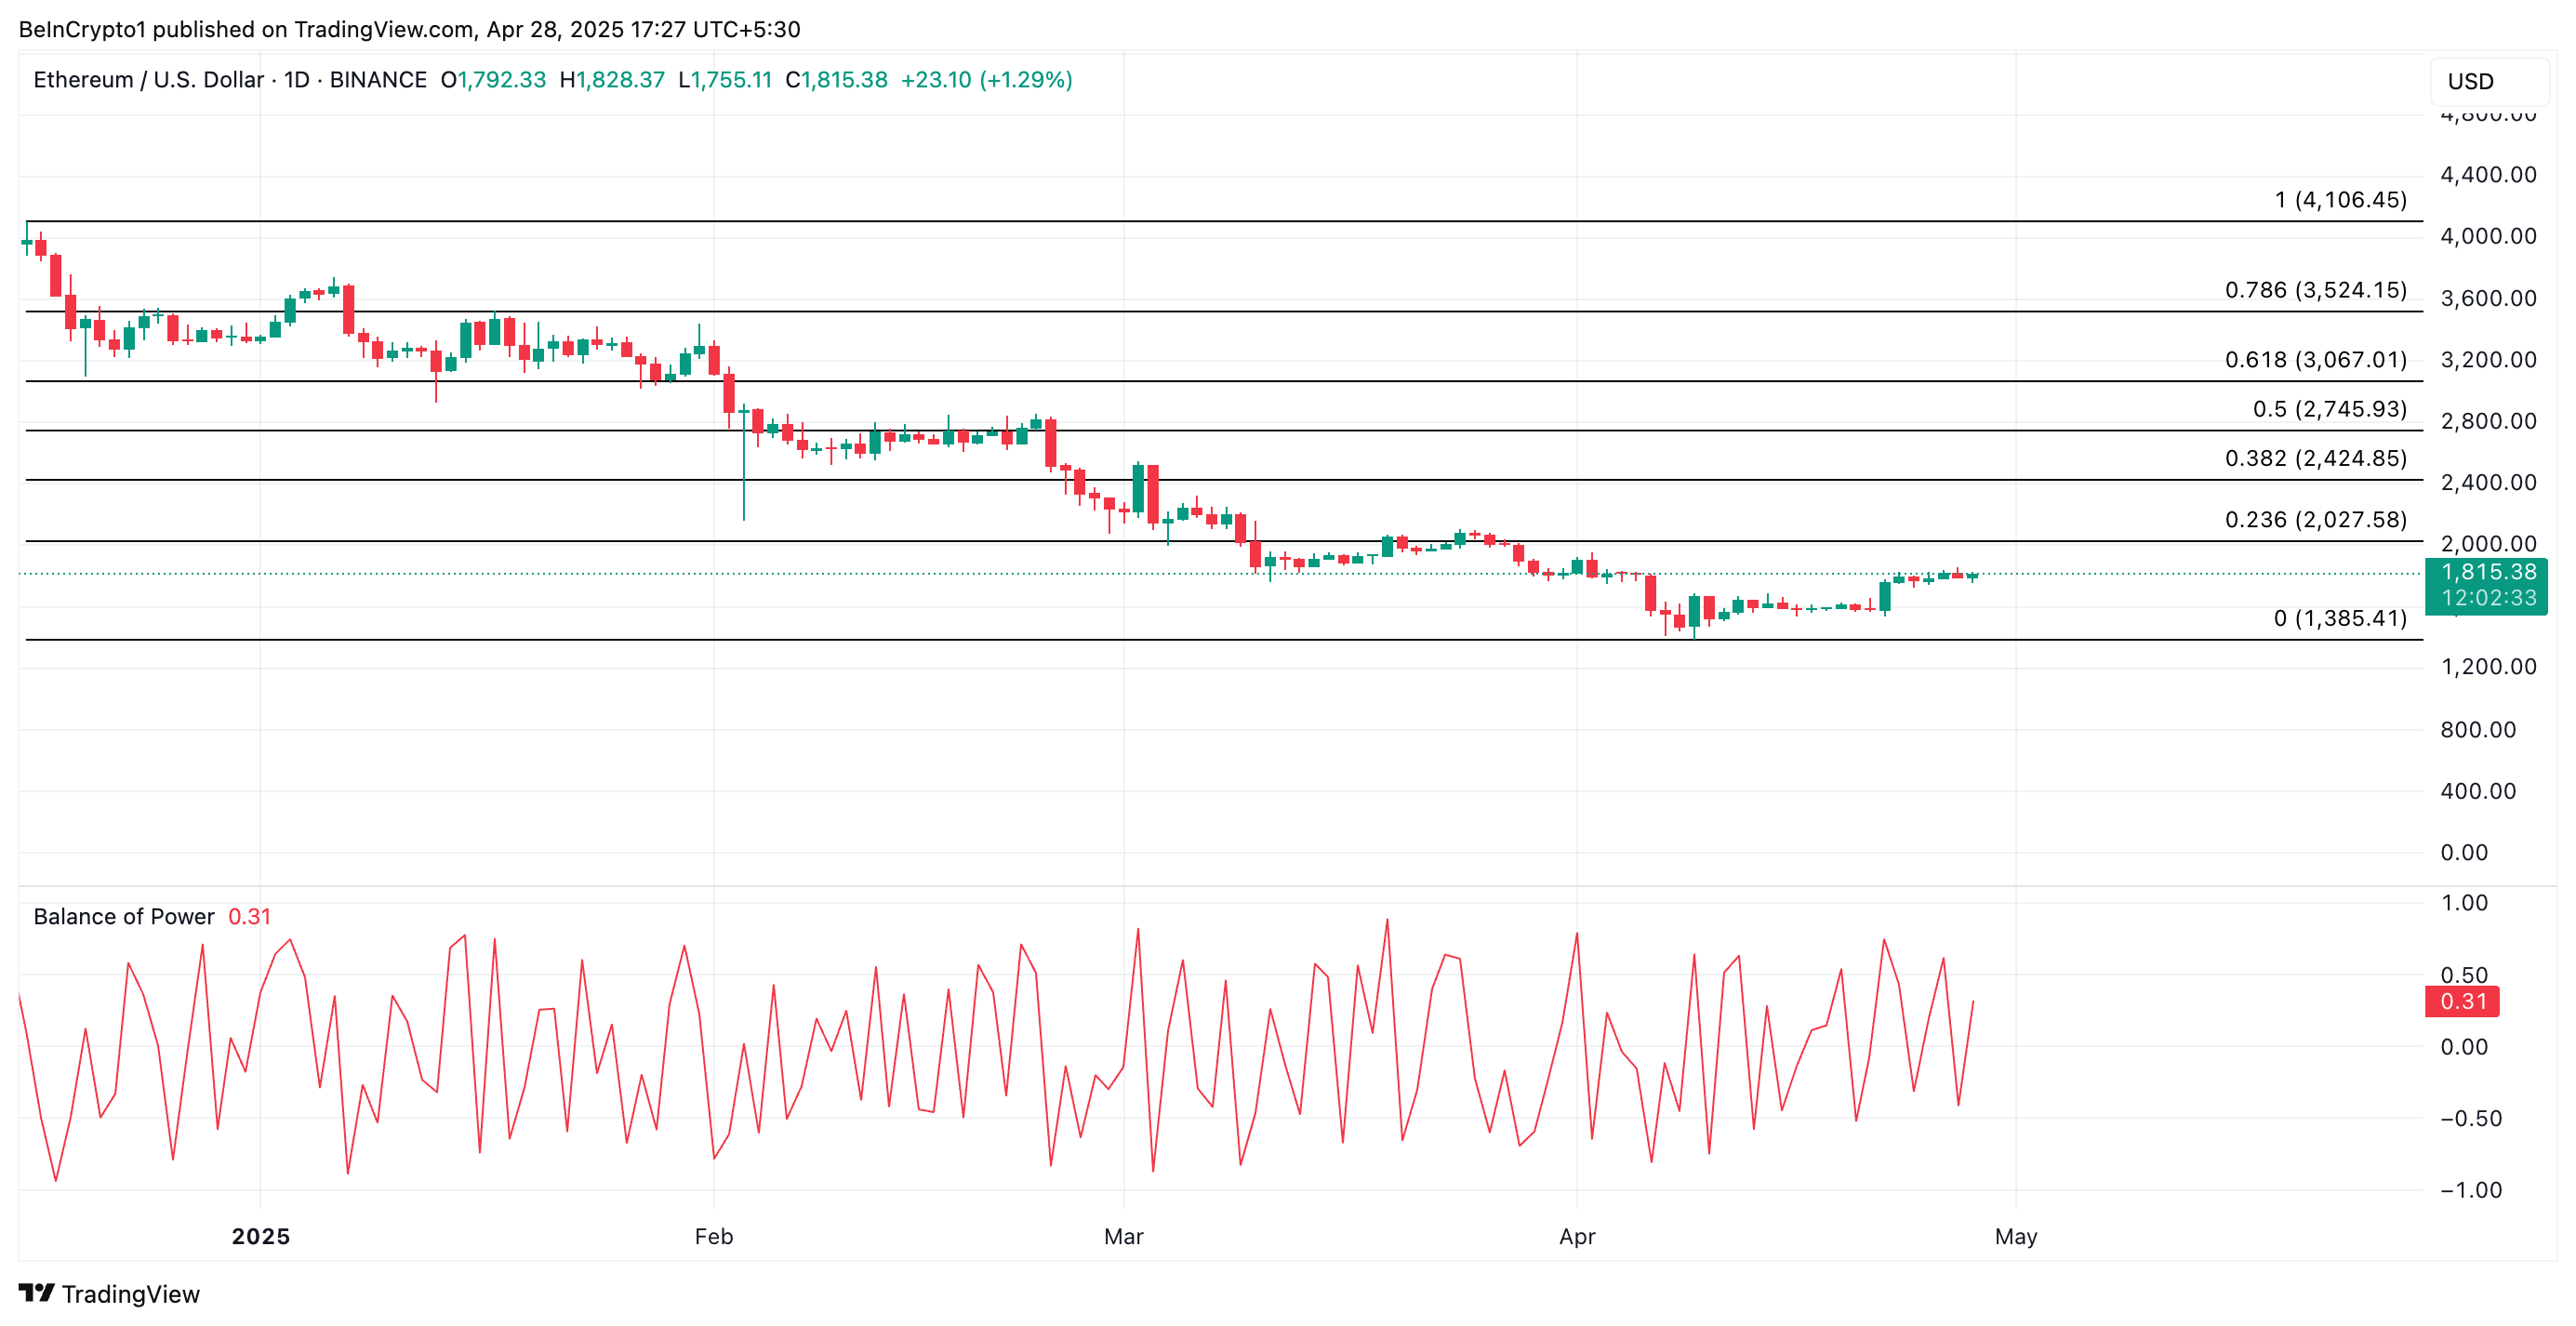
On the technical side, ETH’s positive Balance of Power (BoP) highlights the resurgence in demand for the leading altcoin. This is currently at 0.31.
This indicator measures the buying and selling pressure of an asset. When its value is positive, pressure outweighs selling pressure. This indicates strength in the ETH’s price movement and signals further potential upward momentum. If this happens, ETH could rally back above $2,000 to exchange hands at $2,027.
Bitcoin (BTC) broke above the $90,000 mark for the first time since March 5, as momentum indicators flash increasingly bullish signals. The latest surge comes alongside a sharp rise in ADX, a bullish Ichimoku Cloud formation, and EMA alignment favoring continued upside.
With buying pressure outweighing selling activity and ETF inflows hitting a three-month high, market sentiment is leaning in favor of the bulls. If resistance is breached, BTC could open the path toward $100,000, reinforcing its role as a hedge amid broader market uncertainty.
Bitcoin Bulls Regain Control as ADX Signals Strengthening Uptrend
Bitcoin’s Directional Movement Index (DMI) is signaling a significant shift in momentum, with its ADX rising sharply to 29.48 — up from just 15.3 two days ago.
The ADX, or Average Directional Index, measures the strength of a trend regardless of its direction. Readings below 20 indicate a weak or sideways market, while values above 25 suggest a strong trend is forming.
Looking deeper into the DMI components, the +DI (positive directional indicator) currently stands at 30.99 — nearly doubling from 15.82 two days ago, though slightly down from its 37.61 peak yesterday.
This suggests that while buying pressure surged recently, it has eased slightly in the last 24 hours. Meanwhile, the -DI (negative directional indicator) has dropped sharply to 10.86 from 22.48, indicating a clear weakening of selling pressure.
The combination of a strong ADX and a high +DI versus a declining -DI implies that bulls are currently in control. If the trend holds, Bitcoin may continue its upward trajectory in the short term.
Bitcoin Trend Strengthens With Clear Bullish Momentum Signal
Bitcoin’s Ichimoku Cloud chart is showing clear bullish signals. Price action is well above the Kumo (cloud), indicating strong upward momentum.
The Tenkan-sen (blue line) remains above the Kijun-sen (red line), reinforcing the short-term bullish bias. The gap between them continues to widen, a sign of strengthening momentum.
Additionally, the future cloud (Senkou Span A and B) is angled upward. This suggests that the bullish trend could persist if current conditions hold.
The Chikou Span (green lagging line) is also positioned above the price candles and the cloud, confirming trend alignment from a lagging perspective.
Together, these elements point to a healthy uptrend, with no immediate signs of reversal unless a strong breakdown below the Tenkan-sen or the cloud emerges.
Bitcoin Eyes New Breakouts as Bullish Momentum Builds
Bitcoin’s EMA lines are bullish, with short-term averages positioned above the longer-term ones, signaling strong upward momentum.
Bitcoin’s price is approaching a key resistance level at $92,920. A breakout above this zone could open the door for further gains.
The current structure suggests that bulls remain in control, as long as support levels are respected and upward momentum persists.
According to Tracy Jin, COO of crypto exchange MEXC, Bitcoin’s recent performance has been reviving its label as “digital gold”:
“Bitcoin’s recent strength in the face of market-wide volatility is reviving its long-dormant status as a “digital gold.” With U.S. equities slipping back to tariff-era lows and the dollar plunging to a three-year nadir, Bitcoin’s ability to post gains is reshaping investor perception.” Jin told BeInCrypto.
A break below this level would weaken the structure and increase the chances of deeper corrections. The next key areas to watch are $86,532 and $83,133.
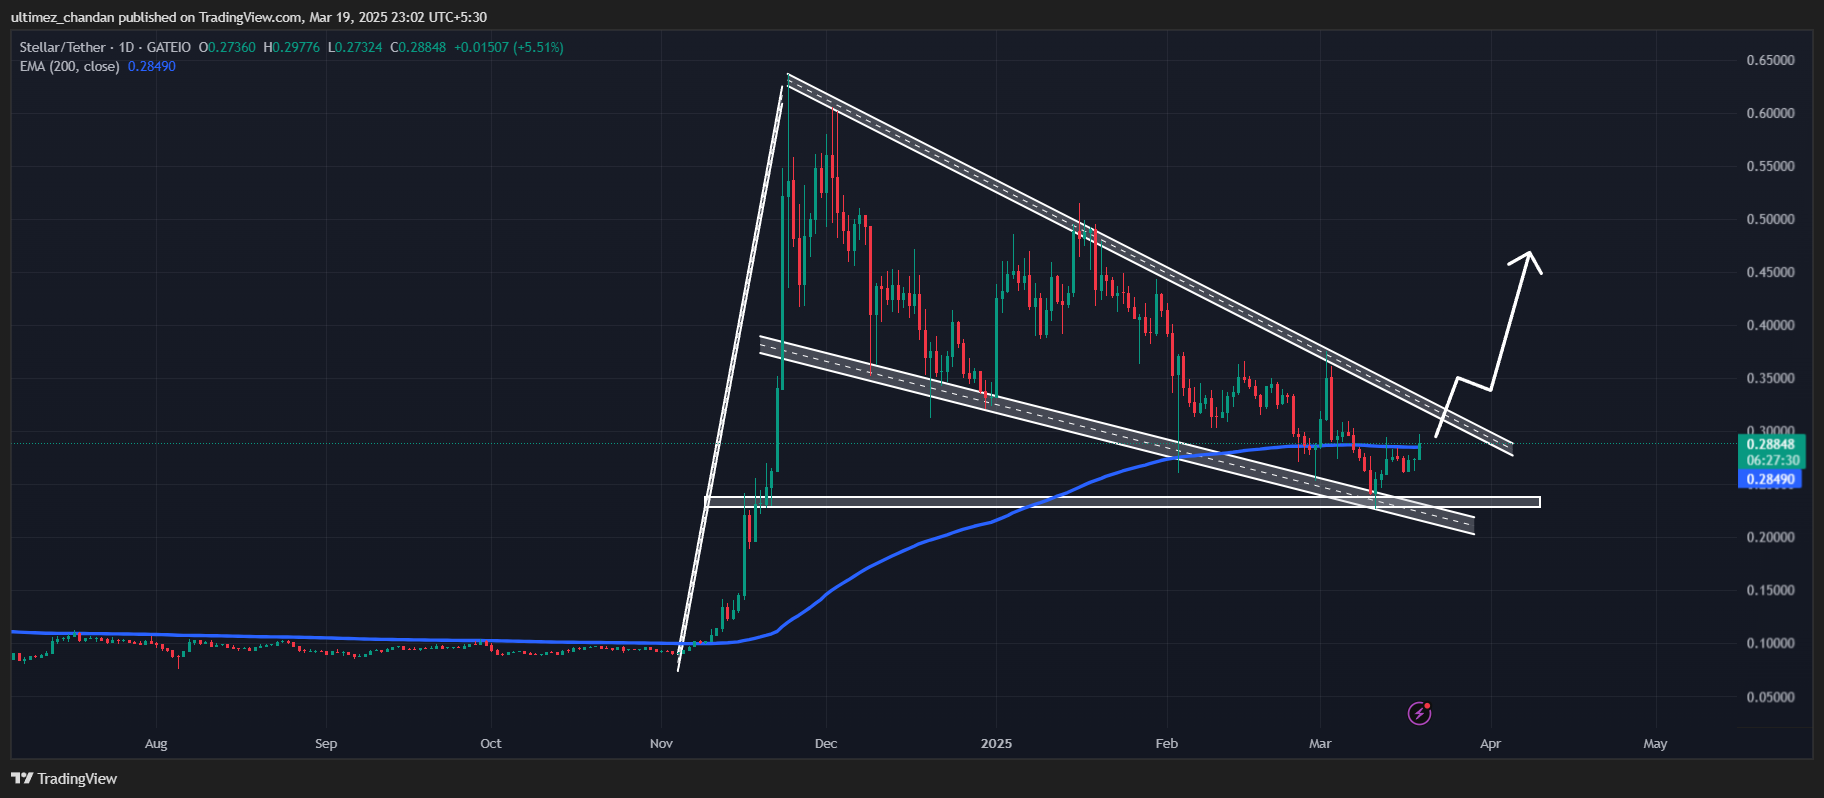
Ripple rival Stellar Lumen (XLM) is poised for massive upside momentum as it has formed a bullish price action pattern on the daily timeframe and is now garnering significant attention from traders and investors. On March 19, 2025, as sentiment across the crypto landscape shifts, XLM breached the resistance of the 200 Exponential Moving Average (EMA) on the daily timeframe.
Why is XLM Price RIsing?
This breakout of the resistance level and the shift in sentiment began after the United States Securities and Exchange Commission (SEC) dropped its lawsuit against Ripple Labs.
XLM is currently trading near $0.29 and has surged over 11% in the past 24 hours. This price jump suggests that it is mirroring its rival’s upside momentum. Meanwhile, its trading volume has increased by 135% during the same period, indicating heightened participation from traders and investors following the end of the legal battle.
XLM Price Analysis and Upcoming Levels
Since November 2024, XLM has been on a downward trajectory, forming a falling wedge price action pattern on the daily timeframe. However, with the recent price jump, the asset is approaching the breakout area.
Based on its recent price action and historical patterns, if XLM closes a daily candle above the $0.29 level, there is a strong possibility it could initially soar by 30% to reach $0.37 in the coming days. Furthermore, if XLM sustains this rally and closes a daily candle above $0.35, it could witness another 40% surge, reaching $0.488.
Source: Trading View
XLM’s Over-Leveraged Levels
With this positive development and bullish price action, traders have begun betting on the long side, as reported by the on-chain analytics firm Coinglass.
Data reveals that traders are currently over-leveraged at $0.2725 on the lower side, with bulls having built $5 million worth of long positions, while $0.3025 is another over-leveraged level where bears hold $2.20 million worth of short positions.
When combining this on-chain metric with technical analysis, it appears that bulls are back and will support the asset in reclaiming its all-time high in the coming days.
The post Stellar Lumen (XLM) Price Prediction for March 19 appeared first on Coinpedia Fintech News
Ripple rival Stellar Lumen (XLM) is poised for massive upside momentum as it has formed a bullish price action pattern on the daily timeframe and is now garnering significant attention from traders and investors. On March 19, 2025, as sentiment across the crypto landscape shifts, XLM breached the resistance of the 200 Exponential Moving Average …