Asset manager Bitwise has made its next move in a bid to offer a NEAR ETF, filing its S-1 form with the US Securities and Exchange Commission (SEC). This development provides a bullish outlook for the Near Protocol price, with institutional investors gaining exposure to the altcoin through this fund.
Bitwise Registers NEAR ETF Filing With US SEC
A SEC filing shows that Bitwise has registered its proposed NEAR ETF with the US SEC. This move is part of the plans to launch a fund that will directly track the value of the Near Protocol price and provide investors with exposure to the altcoin.
This comes following the asset manager’s registration of the Near Protocol ETF in Delaware. Following this filing, the firm will now move to file a 19b-4 form for the ETF with the Commission through an exchange. This will officially kickstart the approval process as the exchange declares its intention to list and trade the fund on its platform.
The Commission already has several filings for other altcoin ETFs on its desk, including ones from Bitwise. Bitwise has already filed for Solana, XRP, Dogecoin, and Aptos ETFs.
However, the SEC has shown it is in no hurry to approve these funds despite the regulatory-friendly environment that the Commission has created under this new administration. The agency has so far delayed its decision on all other crypto ETFs, with the latest being Canary Capital’s Litecoin ETF filing.
Insight Into The Altcoin’s Current Price Action
Amid Bitwise’s NEAR ETF filing, crypto analyst Lycus has provided insights into the Near Protocol’s current price action. He remarked that the altcoin’s price appears to be stabilizing above the $1.75 support zone.
The analyst added that if it can reclaim the $3.70 resistance, there could be a price surge towards the $5 level. Lycus affirmed that the NEAR price is showing strong support and advised market participants to wait for a small wick around $2.65 if they are planning to accumulate.
Several US economic signals are in the pipeline this week, although not as hot as the ones witnessed in the past week.
By frontrunning the following events, traders and investors can buffer their portfolios against sudden impact.
Initial Jobless Claims
This US economic signal, due every Thursday, will indicate the number of United States citizens who filed for unemployment insurance for the first time last week.
Economists surveyed by MarketWatch expect a modest increase to 221,000 after the 218,000 reported in the week ending July 26.
“Initial claims for jobless benefits fell last week [the one ended July 26] and are running below their year-earlier level. Continuing claims continue to point to a slightly less tight labor market compared to a year ago,” economist correspondent Nick Timiraos indicated.
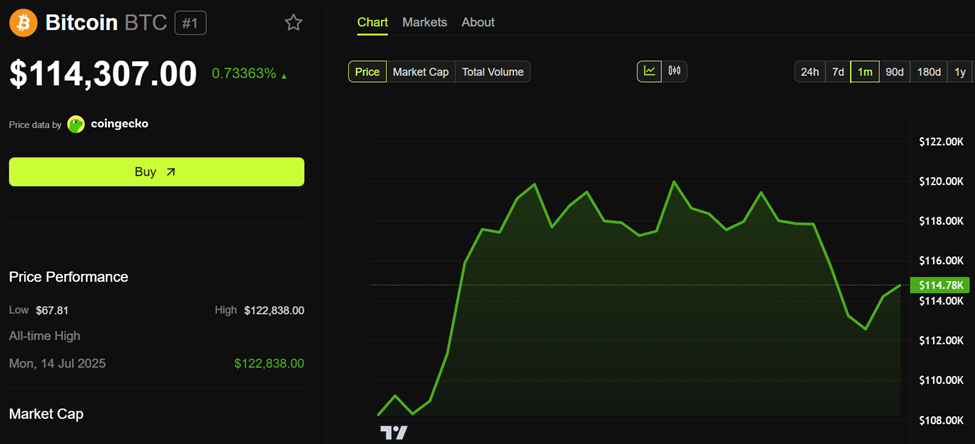
The jobless claims data will follow the nonfarm payroll (NFP) data, released on August 1. The NFP data exacerbated Bitcoin’s recent drop, coming in well below expectations.
With data signaling a deteriorating labor market, potential dollar instability could push retail and institutional investors toward crypto in the long run.
4-week average of initial jobless claims has hooked dramatically lower lately … still nowhere near levels consistent with recession pic.twitter.com/UUfuEeCZpm
If last week’s jobless claims continue the trend of coming in higher than the previous week or, worse, exceeding expectations, the perceived labor market weakness could bode well for Bitcoin as investors pivot against economic uncertainty.
For perspective, a surprise increase in jobless claims would signal economic weakness, potentially supporting looser Fed policy. Such an outcome would be bullish for risk assets like crypto.
ISM Services PMI
Beyond labor market data, crypto markets will also be watching the ISM Services PMI (Purchasing Managers’ Index).
This economic indicator, derived from monthly surveys of private sector companies, measures business activity in areas such as new orders, inventory levels, production, supplier deliveries, and employment.
After a reading of 50.8% in June, economists project a modest increase to 51.1% in July. If the ISM Services PMI rises above the expected 51.1%, it signals stronger economic activity and could dampen hopes for Fed rate cuts. Such an outcome is potentially bearish for Bitcoin as tighter liquidity persists.
However, a lower-than-expected reading, especially below 50, would suggest economic weakness and raise expectations of monetary easing, likely boosting crypto prices.
If the data meets forecasts, markets may tread water, with traders awaiting more decisive indicators like jobless claims.
In Tuesday’s run-up to this particular US economic signal, Bitcoin’s next move hinges on whether the services sector shows signs of overheating or slowdown, key elements to the Fed’s inflation and policy stance.
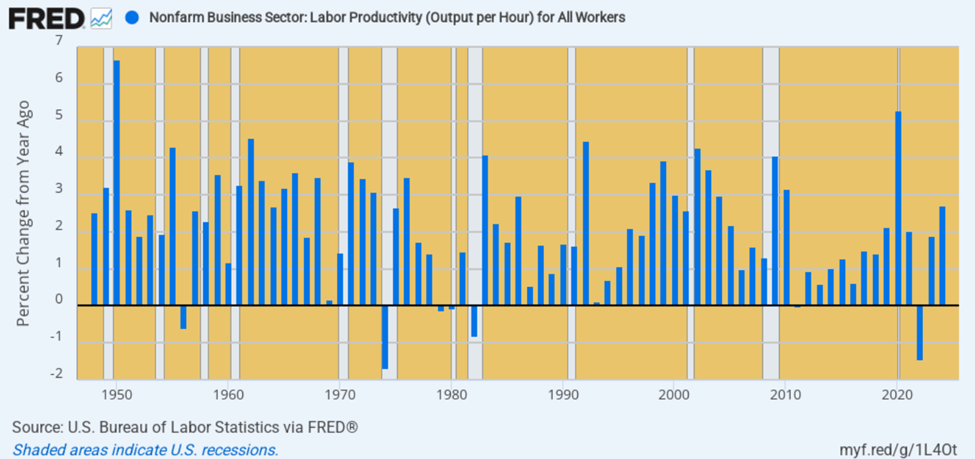
Further, the US productivity and unit labor costs will be critical watches this week, due Thursday, August 7. Together, they reveal whether wage growth is inflationary.
These data points indicate wage growth in the second quarter (Q2). In Q1, US productivity dropped by 1.5%, but now economists project a 1.9% increase.
Meanwhile, US unit labor costs were 6.6% higher in the first quarter, but economists project a modest surge of 1.3% in Q2.
Rising labor costs without increasing productivity would indicate sticky inflation, which is expected to bode positively for Bitcoin.
More closely, the mismatch could shift Fed expectations, with crypto known to respond well to signs of disinflation or economic slowdown.
However, if labor costs rise at the same pace as productivity, companies can afford to pay more without raising prices. Such a scenario would support real wage growth without triggering inflation. This is still generally bullish for Bitcoin as it promotes economic growth without tightening liquidity.
With the One Big Beautiful Bill passed and 100% expensing locked in, America is experiencing a CapEx Comeback.
AI is accelerating. Productivity is rising.
If the Fed had any imagination, they’d embrace the Greenspan model—because the Golden Age of America is upon us. pic.twitter.com/es5HB3zDi6
— Treasury Secretary Scott Bessent (@SecScottBessent) July 31, 2025
When labor costs fall while productivity rises, it is a highly disinflationary and business-friendly scenario. This is bullish for the crypto as falling inflation pressures raise the odds of rate cuts or liquidity support, favoring risk assets.
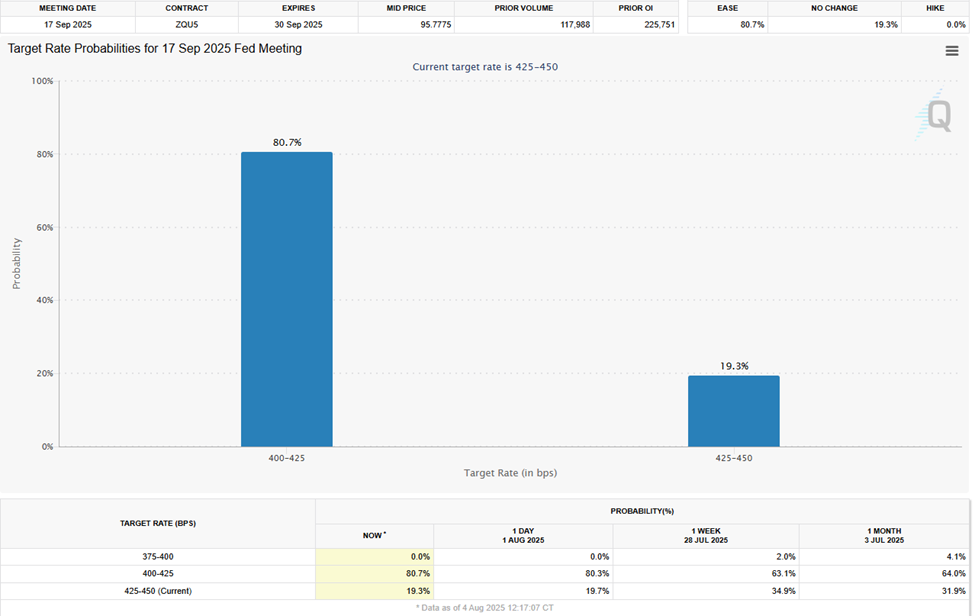
Based on the CME FedWatch Tool, interest rate bettors see an 80.7% chance the Fed will cut interest rates in the September 17 meeting.
Atlanta Fed President Raphael Bostic Speech
Beyond data points among US economic signals, traders and investors also monitor comments from policymakers. This week, the Atlanta Fed President Raphael Bostic will speak on Thursday, and markets will be keen for signals on policymakers’ economic outlook.
Atlanta Fed President Raphael Bostic is known to lean hawkish on monetary policy, favoring a cautious approach to interest rate cuts.
“If you’re hoping for rate cuts, don’t hold your breath. Atlanta Fed President Raphael Bostic recently stated he only supports one rate cut this year, highlighting the Fed’s uncertainty due to tariffs,” one user said recently.
As one of the Fed’s policymakers, Bostic’s tone on inflation, rates, or balance sheet policy can sharply shift market expectations.
If his remarks are hawkish, it would be bearish for Bitcoin. However, a dovish stance would be bullish, especially if it contrasts with Powell’s tone.
Crypto analyst Javon Marks has identified a potential breakout for the Cardano price and forecasts a substantial price increase. The analyst suggests that ADA price could rise by over 260%, with price targets ranging from $2.70 to $2.91.
Cardano Price Eyes 260% Rally To $2.70
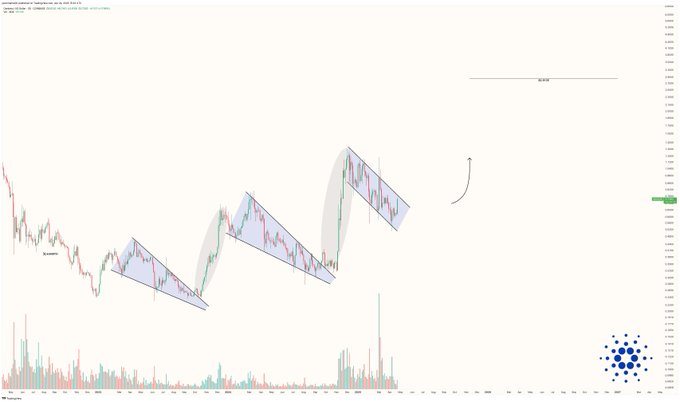
Cardano’s price has shown a steady recovery in recent days, with a notable 2.97% increase in the last 24 hours. Meanwhile, according to crypto analyst Javon Marks, Cardano’s chart shows an ascending triangle pattern, often viewed as a bullish continuation signal. This pattern occurs when the price makes higher lows while the resistance level remains relatively flat.
The consistently higher lows suggest growing buying pressure, indicating buyers are willing to accumulate ADA at higher prices. The breakout probability increases as the ADA price nears the triangle’s upper resistance line.
According to Javon Marks, substantial upward momentum could be seen once ADA breaks through the upper resistance level. A similar breakout in the past resulted in a nearly 300% price increase. If this historical pattern holds, ADA could reach its target price range of $2.70 to $2.91, representing a 261% gain. The consistent testing of the resistance level indicates that the breakout might be imminent, making it a favorable entry point for investors.
Long-Term Holders Show Confidence in Cardano Price
Another factor contributing to the bullish outlook for ADA is the increase in long-term holders (Hodlers). Data from IntoTheBlock shows a steady rise in the number of ADA held for over one year, with the Hodlers’ balance increasing by 1.81%. This data points to a growing investor confidence in Cardano’s long-term potential.
Additionally, the number of medium-term holders (Cruisers) holding for 1-12 months has risen by 7.65%. These increases suggest that more investors are holding onto their ADA rather than engaging in short-term speculative trading.
Cardano Ownership By Time Held (Source: IntotheBlock)
Long-term holders tend to accumulate assets during bullish market phases. The rise in Hodlers’ balance, which has seen an increase in holding time of 77.53% in the last 7 days, suggests that ADA’s investors believe in the project’s future and are willing to lock in their positions. This trend aligns with the broader market sentiment that Cardano is on track for a potential breakout, supported by long-term investor commitment. Furthermore, the balance of medium-term holders has also risen, signaling that more people are shifting their ADA into longer-term positions.
Is a Golden Cross Looming for ADA Price?
In addition to the chart pattern and increasing long-term holders, several technical indicators support a positive price outlook for Cardano. One such indicator is the 50-day Simple Moving Average (SMA) nearing a crossing above the 200-day SMA. This crossing, called Golden Cross, often signals the start of a strong upward movement, as it suggests that the short-term trend is gaining strength. Moreover, the open interest for Cardano’s derivatives is currently at $879.32 million, reflecting a 13.78% increase. This uptick in open interest further supports Cardano’s bullish outlook.
ADAUSD 4hr price chart (Source: TradingView)
Moreover, the Relative Strength Index (RSI) is currently near 70.79 in the overbought zone. While this typically signals an overbought condition, the price can continue rising even with high RSI levels during a strong uptrend. The RSI’s upward trajectory indicates that ADA still has momentum, supporting Marks’ forecast of a potential breakout.
The Chaikin Money Flow (CMF) is another positive indicator currently at +0.11. This suggests that more money flows into Cardano, reflecting increased buying pressure and continued demand for ADA. As the CMF remains positive, the bullish sentiment surrounding Cardano will likely persist.
XRP gained only 2% in the past week, signaling weak momentum and fading interest from buyers in the short term.
Technical indicators like the RSI, Ichimoku Cloud, and EMA lines are all starting to reflect increased bearish pressure. Here’s a breakdown of what the charts are saying and what could come next for XRP.
When the RSI drops this quickly, it can often indicate that traders are taking profits or beginning to rotate out of a position, especially after a period of modest gains.
While XRP hasn’t entered oversold territory yet, the drop below the 50 mark is typically viewed as a bearish signal, pointing to a potential shift in sentiment from bullish to neutral or bearish.
The RSI, or Relative Strength Index, is a widely used technical indicator that helps traders gauge the strength of a price trend. It ranges from 0 to 100, with readings above 70 considered overbought and readings below 30 considered oversold.
When the RSI is above 50, momentum is typically bullish, while levels below 50 reflect increasing bearishness. With XRP now sitting at 46.34, it suggests the asset is losing upward momentum and may be at risk of further downside unless buying interest returns soon.
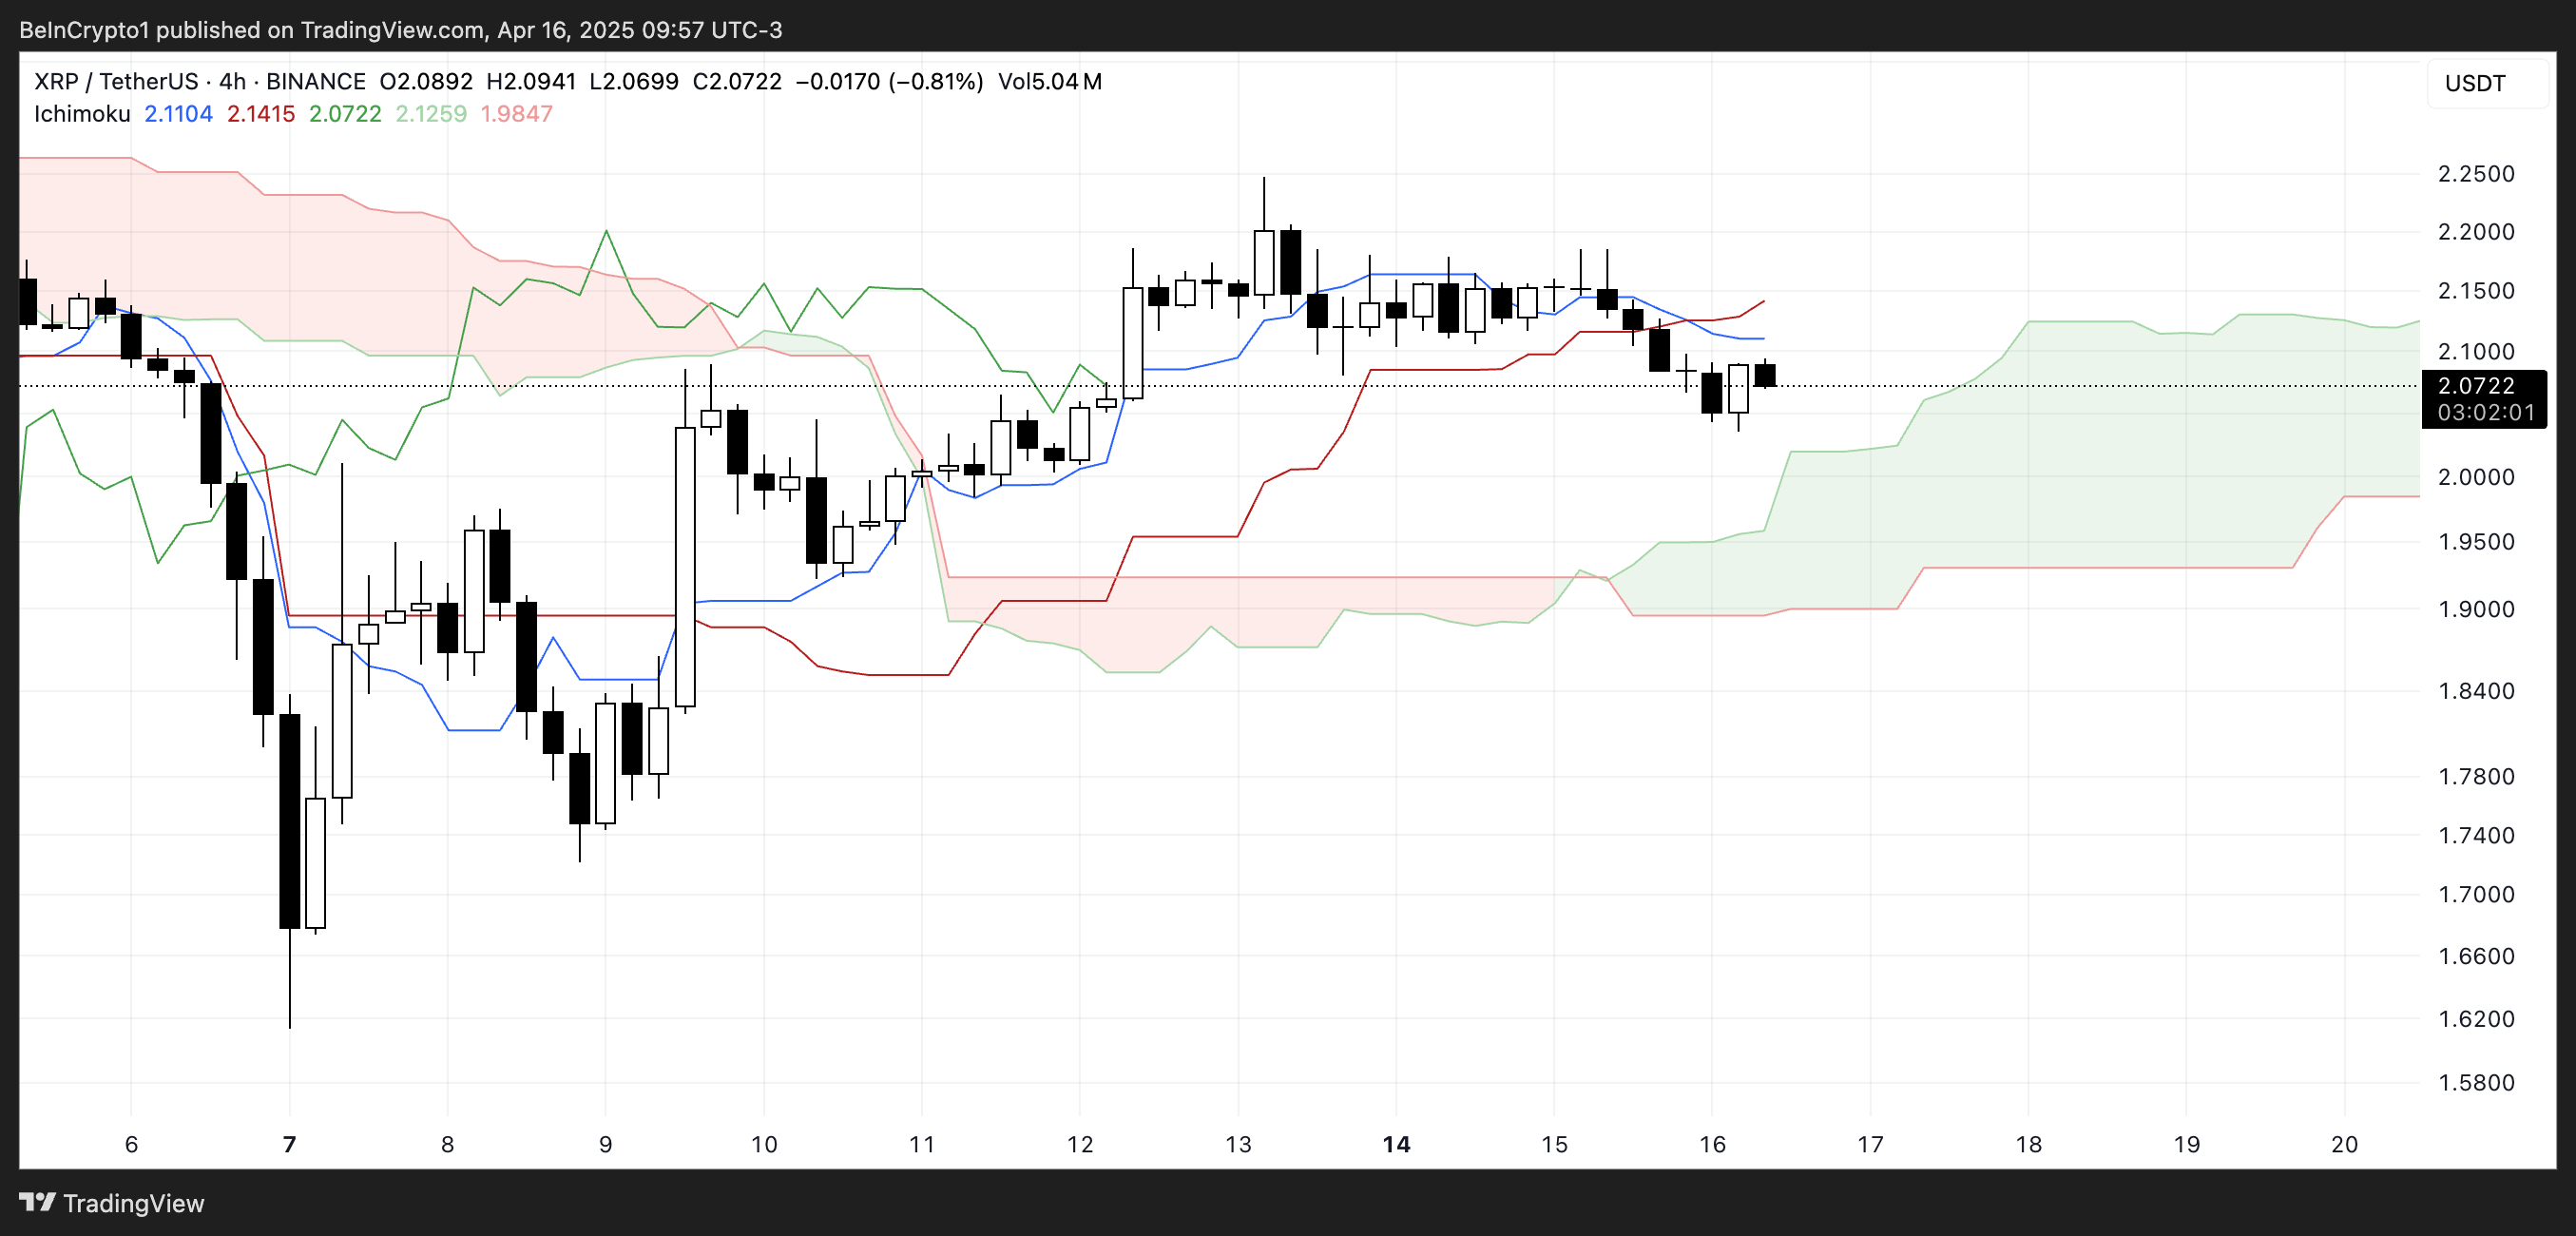
Additionally, the price is now entering the green cloud (Kumo), which represents a zone of uncertainty or consolidation. The cloud ahead is relatively flat and wide, indicating potential support but also a lack of strong upward momentum.
The green Senkou Span A (leading span A) remains above the red Senkou Span B (leading span B), signaling that the broader trend is still slightly bullish—but if price action stays inside or breaks below the cloud, that trend may begin to reverse.
Overall, the Ichimoku setup points to caution for bulls unless XRP reclaims the Tenkan and Kijun lines convincingly.
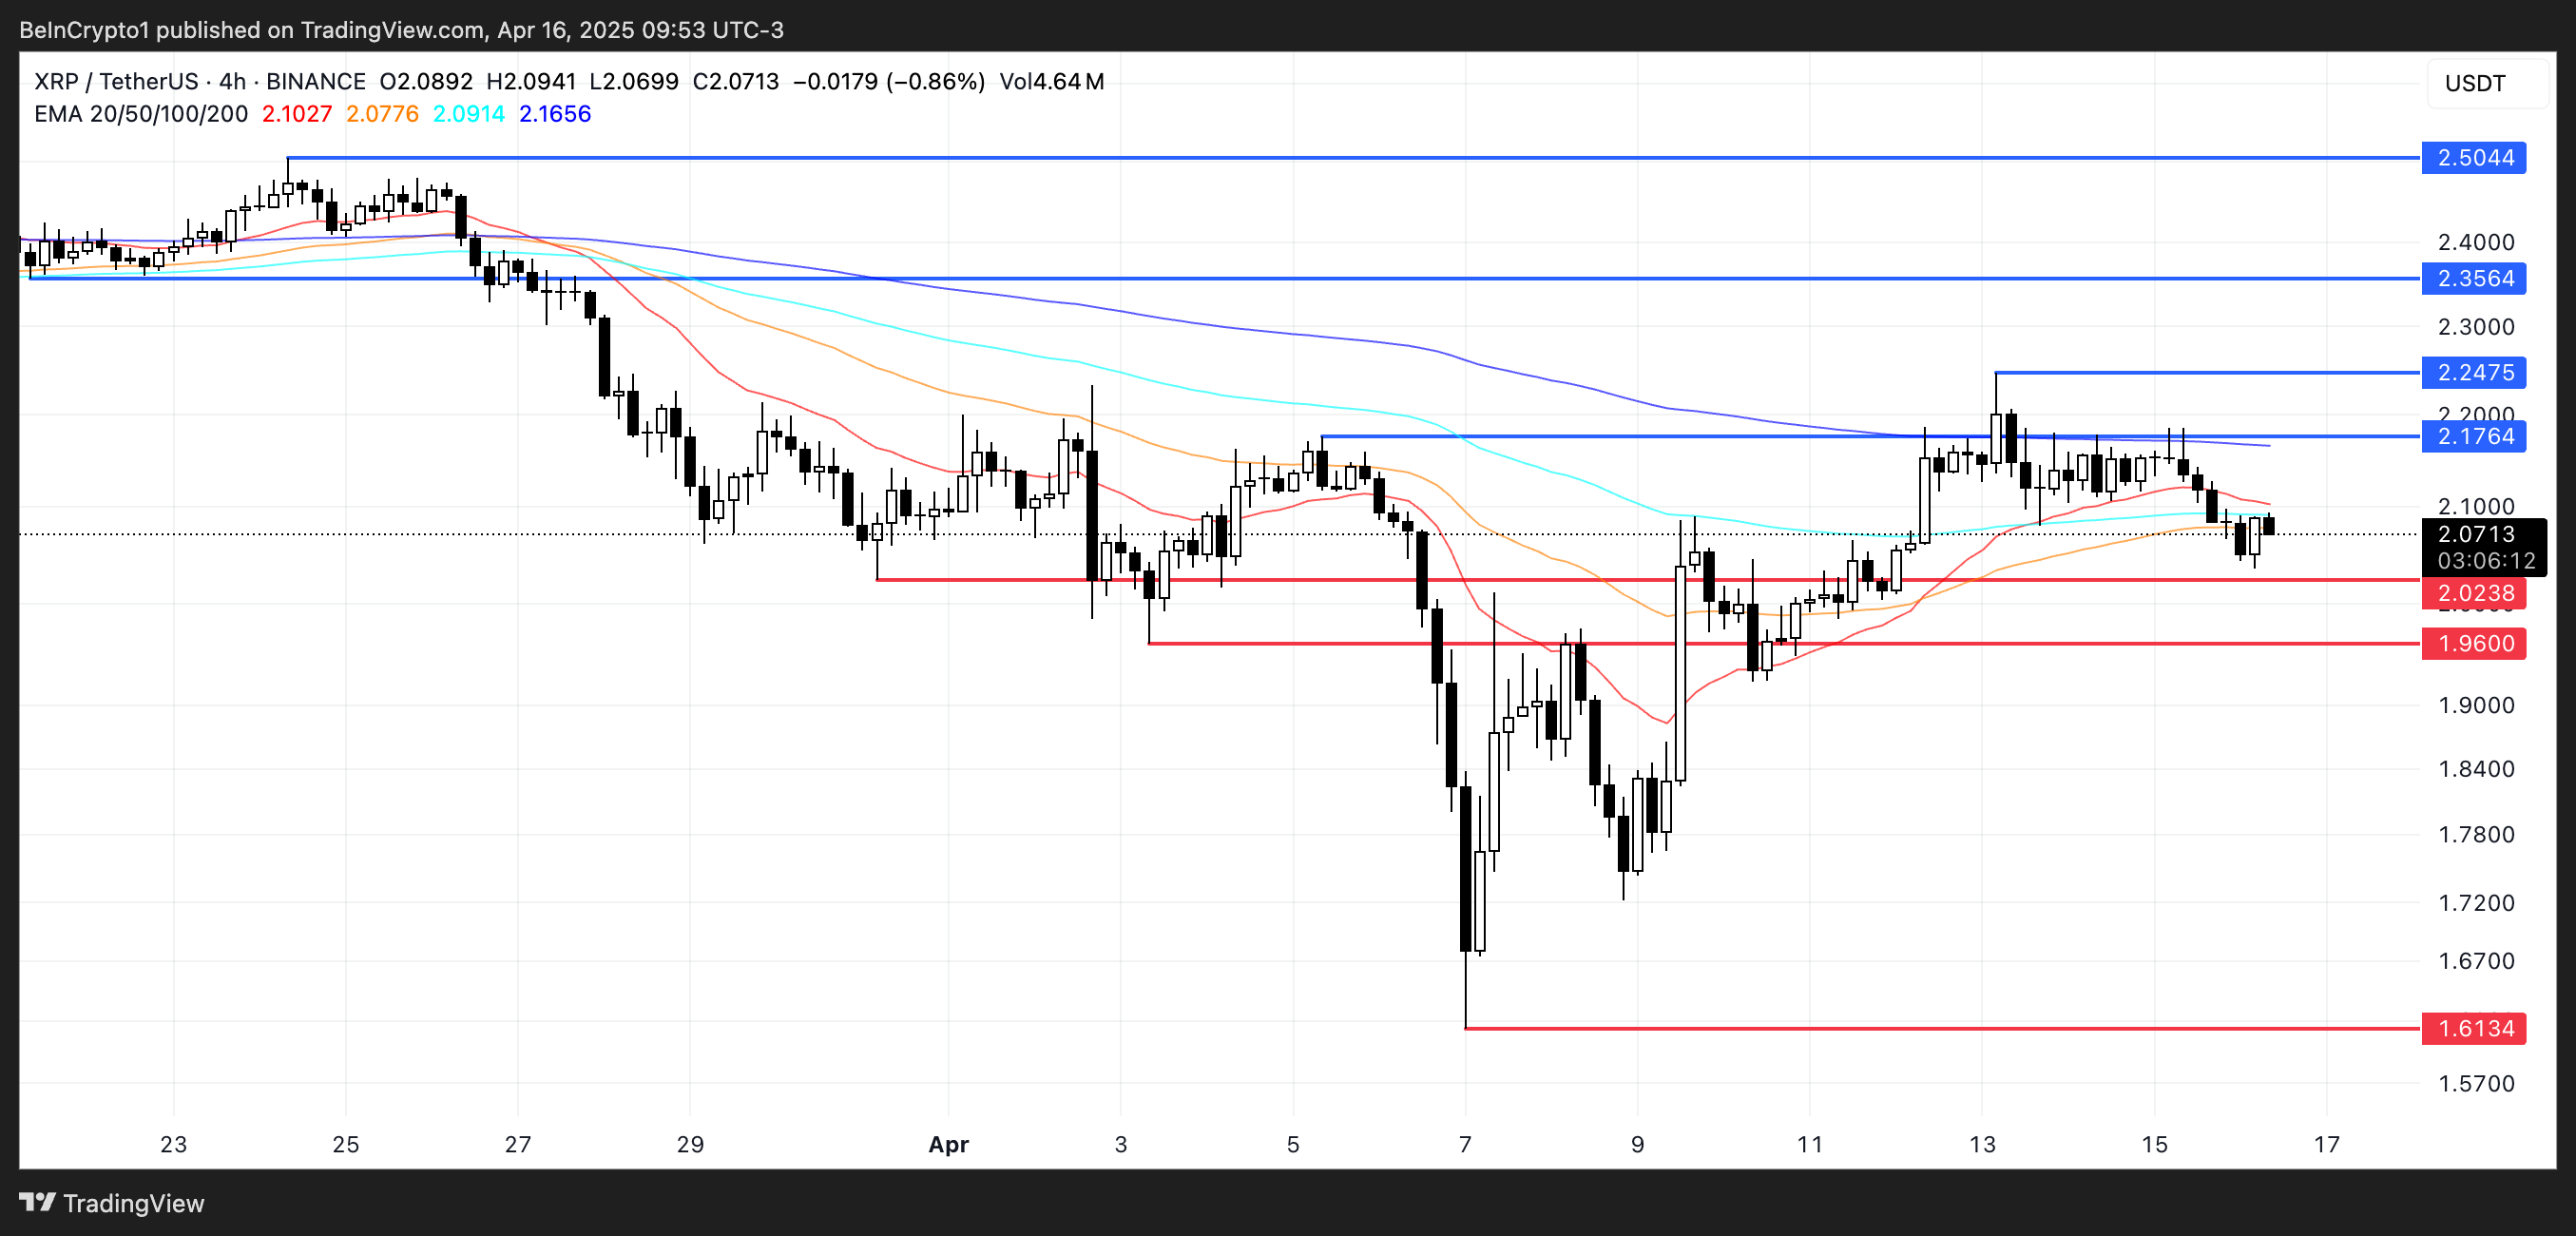
This repeated rejection at the same level indicates strong selling pressure. The EMAs suggest momentum is fading as the shorter-term average is beginning to bend downward.
A potential death cross, where the short-term EMA crosses below the long-term EMA, appears to be forming. If confirmed, it could signal a deeper correction ahead, with XRP possibly retesting support levels at $2.02 and $1.96.
A breakdown below these levels could lead to a drop toward $1.61. However, if bulls manage to reclaim $2.17, the next resistance at $2.24 becomes the key target.
A clean break above that could trigger a stronger rally, potentially pushing XRP to $2.35 or even $2.50 if momentum accelerates.