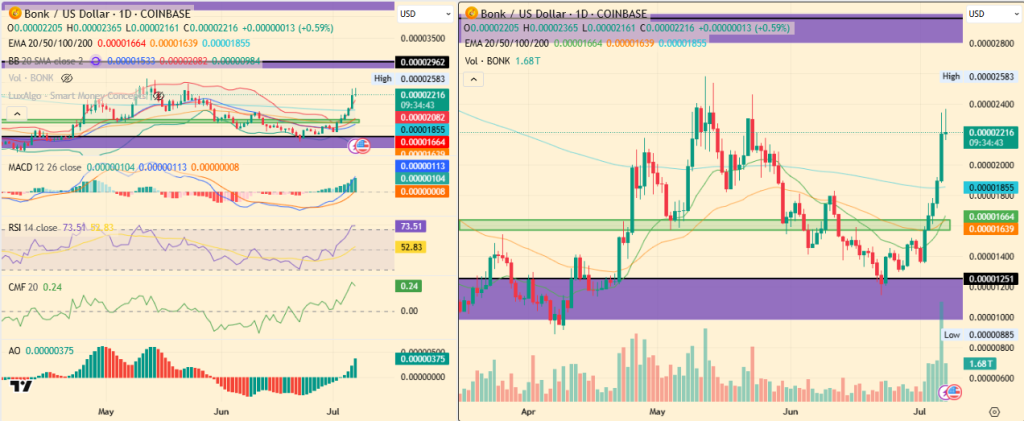
The Bonk price has surged recently which seems like it is fueled by increased excitement around its Solana-based ecosystem and heightened market activity. In just five days, the meme-token skyrocketed over 70% gains from $0.000013 to a peak of $0.000022, showing bullish strength.
More precisely, the impressive rise can be attributed to the growing popularity of LetsBonk. More recently, Dune analytics revealed that LetsBonk deployed significantly higher meme coins today, surpassing Pump.fun’s.
Similarly, the anticipation of an ETF filing and a planned one trillion token burn in December has also exploded investor confidence. As a result, the Bonk price is witnessing an explosion, with the market cap hitting $1.76 billion, which has even flipped the TrumpCoin market cap of $1.70 billion.
BONK Crypto To Rise 35%?
Currently, Bonk price can be seen exchanging hands at $0.00002240, comfortably breached above the 200-day dynamic EMA band while its upper boundary of the Bollinger Bands has also expanded upwards.
This bullish trend is further supported by majority of its technical indicators on BONK’s daily chart that reflect short-term strength. Like, the Chaikin Money Flow (CMF) is displaying a strong capital at 0.25. Both MACD and Awesome Oscillator histograms are trending upward.
Moreover, the RSI has peaked 73 to an overbought condition. Despite this, the upward trend suggests that buyers may remain active in the short term. but, a cooldown period towards 60 via a consolidation in BONK crypto price could also occur before another significant rise.
Bullish Scenario
If the support at $0.000022 holds and trading volumes return, Bonk could make a new push towards the relative highs around $0.000029, potentially yielding gains of 35%.
Bearish Scenario
Conversely, a clear breakdown below $0.0000190 would signal a return to previous trading ranges, increasing the risk of downward pressure towards the May lows and possibly down to the volume cluster at $0.0000158.
Yesterday, Bitcoin exchange-traded funds (ETFs) saw significant inflows, marking the third consecutive day of net positive flows.
With BTC now trading back above the $90,000 mark, signs point to renewed institutional interest, as major players appear to be piling back into the market after weeks of caution.
BTC ETF Inflows Jump 146% in a Day
On Wednesday, net inflows into US-based spot Bitcoin ETFs surged to $936.43 million, a 146% jump from the $381.40 million recorded the previous day.
Total Bitcoin Spot ETF Net Inflow. Source: SosoValue
This also represented the largest single-day inflow since January 17, signaling a notable resurgence in institutional demand for BTC exposure.
Ark Invest and 21Shares’ ETF ARKB led the inflow charge, recording the highest daily net inflow of $267.10 million, bringing its total cumulative net inflows to $2.87 billion.
Fidelity’s ETF FBTC followed with a net inflow of $253.82 million. The ETF’s total historical net inflows now stand at $11.62 billion.
BTC’s Price Pumps, But Derivatives Traders Bet on a Fall
On the derivatives side, open interest in BTC futures has also climbed, reflecting the increased trading activity and speculative positioning as the coin attempts to stabilize above $90,000.
BTC trades at $93,548 at press time, noting a 6% price surge over the past day. During the same period, its futures open interest has also risen by 16%. As of this writing, it stands at $67.19 billion, its highest level since January 24.
When an asset’s price and open interest rise simultaneously, it signals strong conviction behind the move. It means more capital is entering the market to support the uptrend.
However, not all indicators point to bullish sentiment.
Despite BTC’s price surge over the past day, the funding rate remains negative, suggesting that traders are paying a premium to short the coin in the futures markets. The coin’s funding rate is currently at -0.01%.
BTC’s negative funding rate means that shorts are paying longs to keep their positions open. This indicates that more traders are betting against BTC’s current rally and are anticipating a bearish reversal.
Additionally, the put-to-call ratio leans bearish. This confirms waning investor confidence and expectations of downward price movement among BTC options traders.
As July comes to an end, several significant developments in the Bitcoin (BTC) market have emerged. Notably, profit-taking pressure has resurfaced in the final week of the month, raising concerns about a potential turning point in August.
Based on analysis from market experts and on-chain data, four main sources of selling pressure could soon shape Bitcoin’s trajectory. Let’s explore each factor in detail.
1. Profit-Taking from Reawakened “Dormant Whale” Wallets
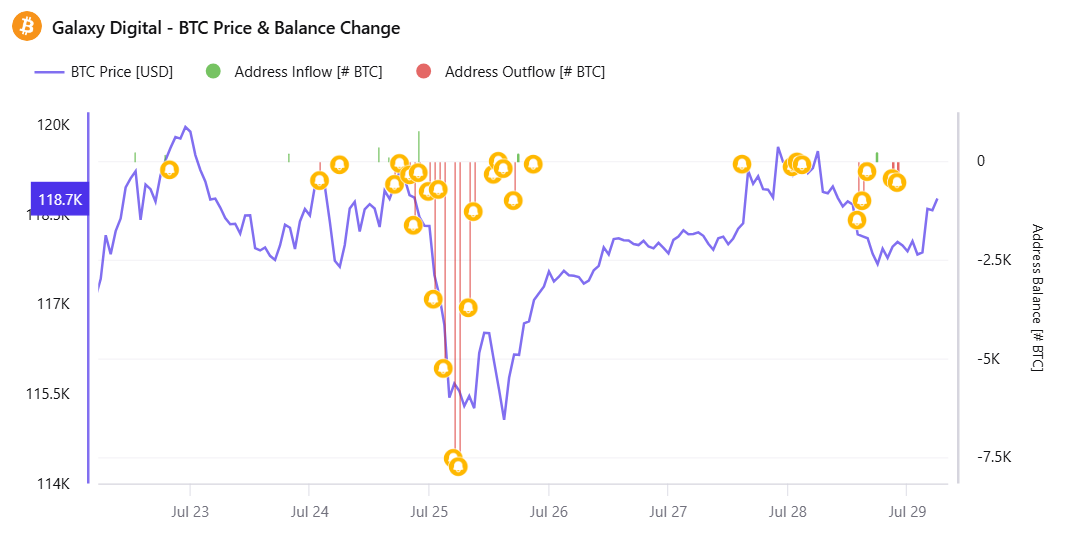
Bitcoin price and inflow/outflow activity from the Galaxy Digital wallet. Source: CryptoQuant
CryptoQuant data shows that large outflows from Galaxy Digital wallets often coincide with Bitcoin price corrections. On July 29, LookonChain continued to detect more outflows, sparking fears of another sell-off.
“Is Galaxy Digital helping clients sell BTC again? In the past 12 hours, Galaxy Digital has transferred out another 3,782 BTC ($447 million), most of which went to exchanges,” LookonChain reported.
Moreover, BeInCrypto reported that two additional dormant wallets—inactive for 6 to 14 years—have become active. SpotOnChain recently reported three dormant whale wallets, possibly tied to a single entity, that moved 10,606 BTC ($1.26 billion) after 3–5 years of inactivity.
An increasing number of awakened whale wallets appear to add selling pressure heading into August.
2. Signs of Selling Pressure from Long-Term Holders
The second source of selling pressure is from Long-Term Holders (LTHs), who are often considered the backbone of the Bitcoin market.
According to a CryptoQuant report, LTHs began withdrawing funds as BTC hovered around the $120,000 mark at the end of July. This behavior may reflect a cautious mindset, where many investors prefer to lock in profits rather than continue holding through potential volatility.
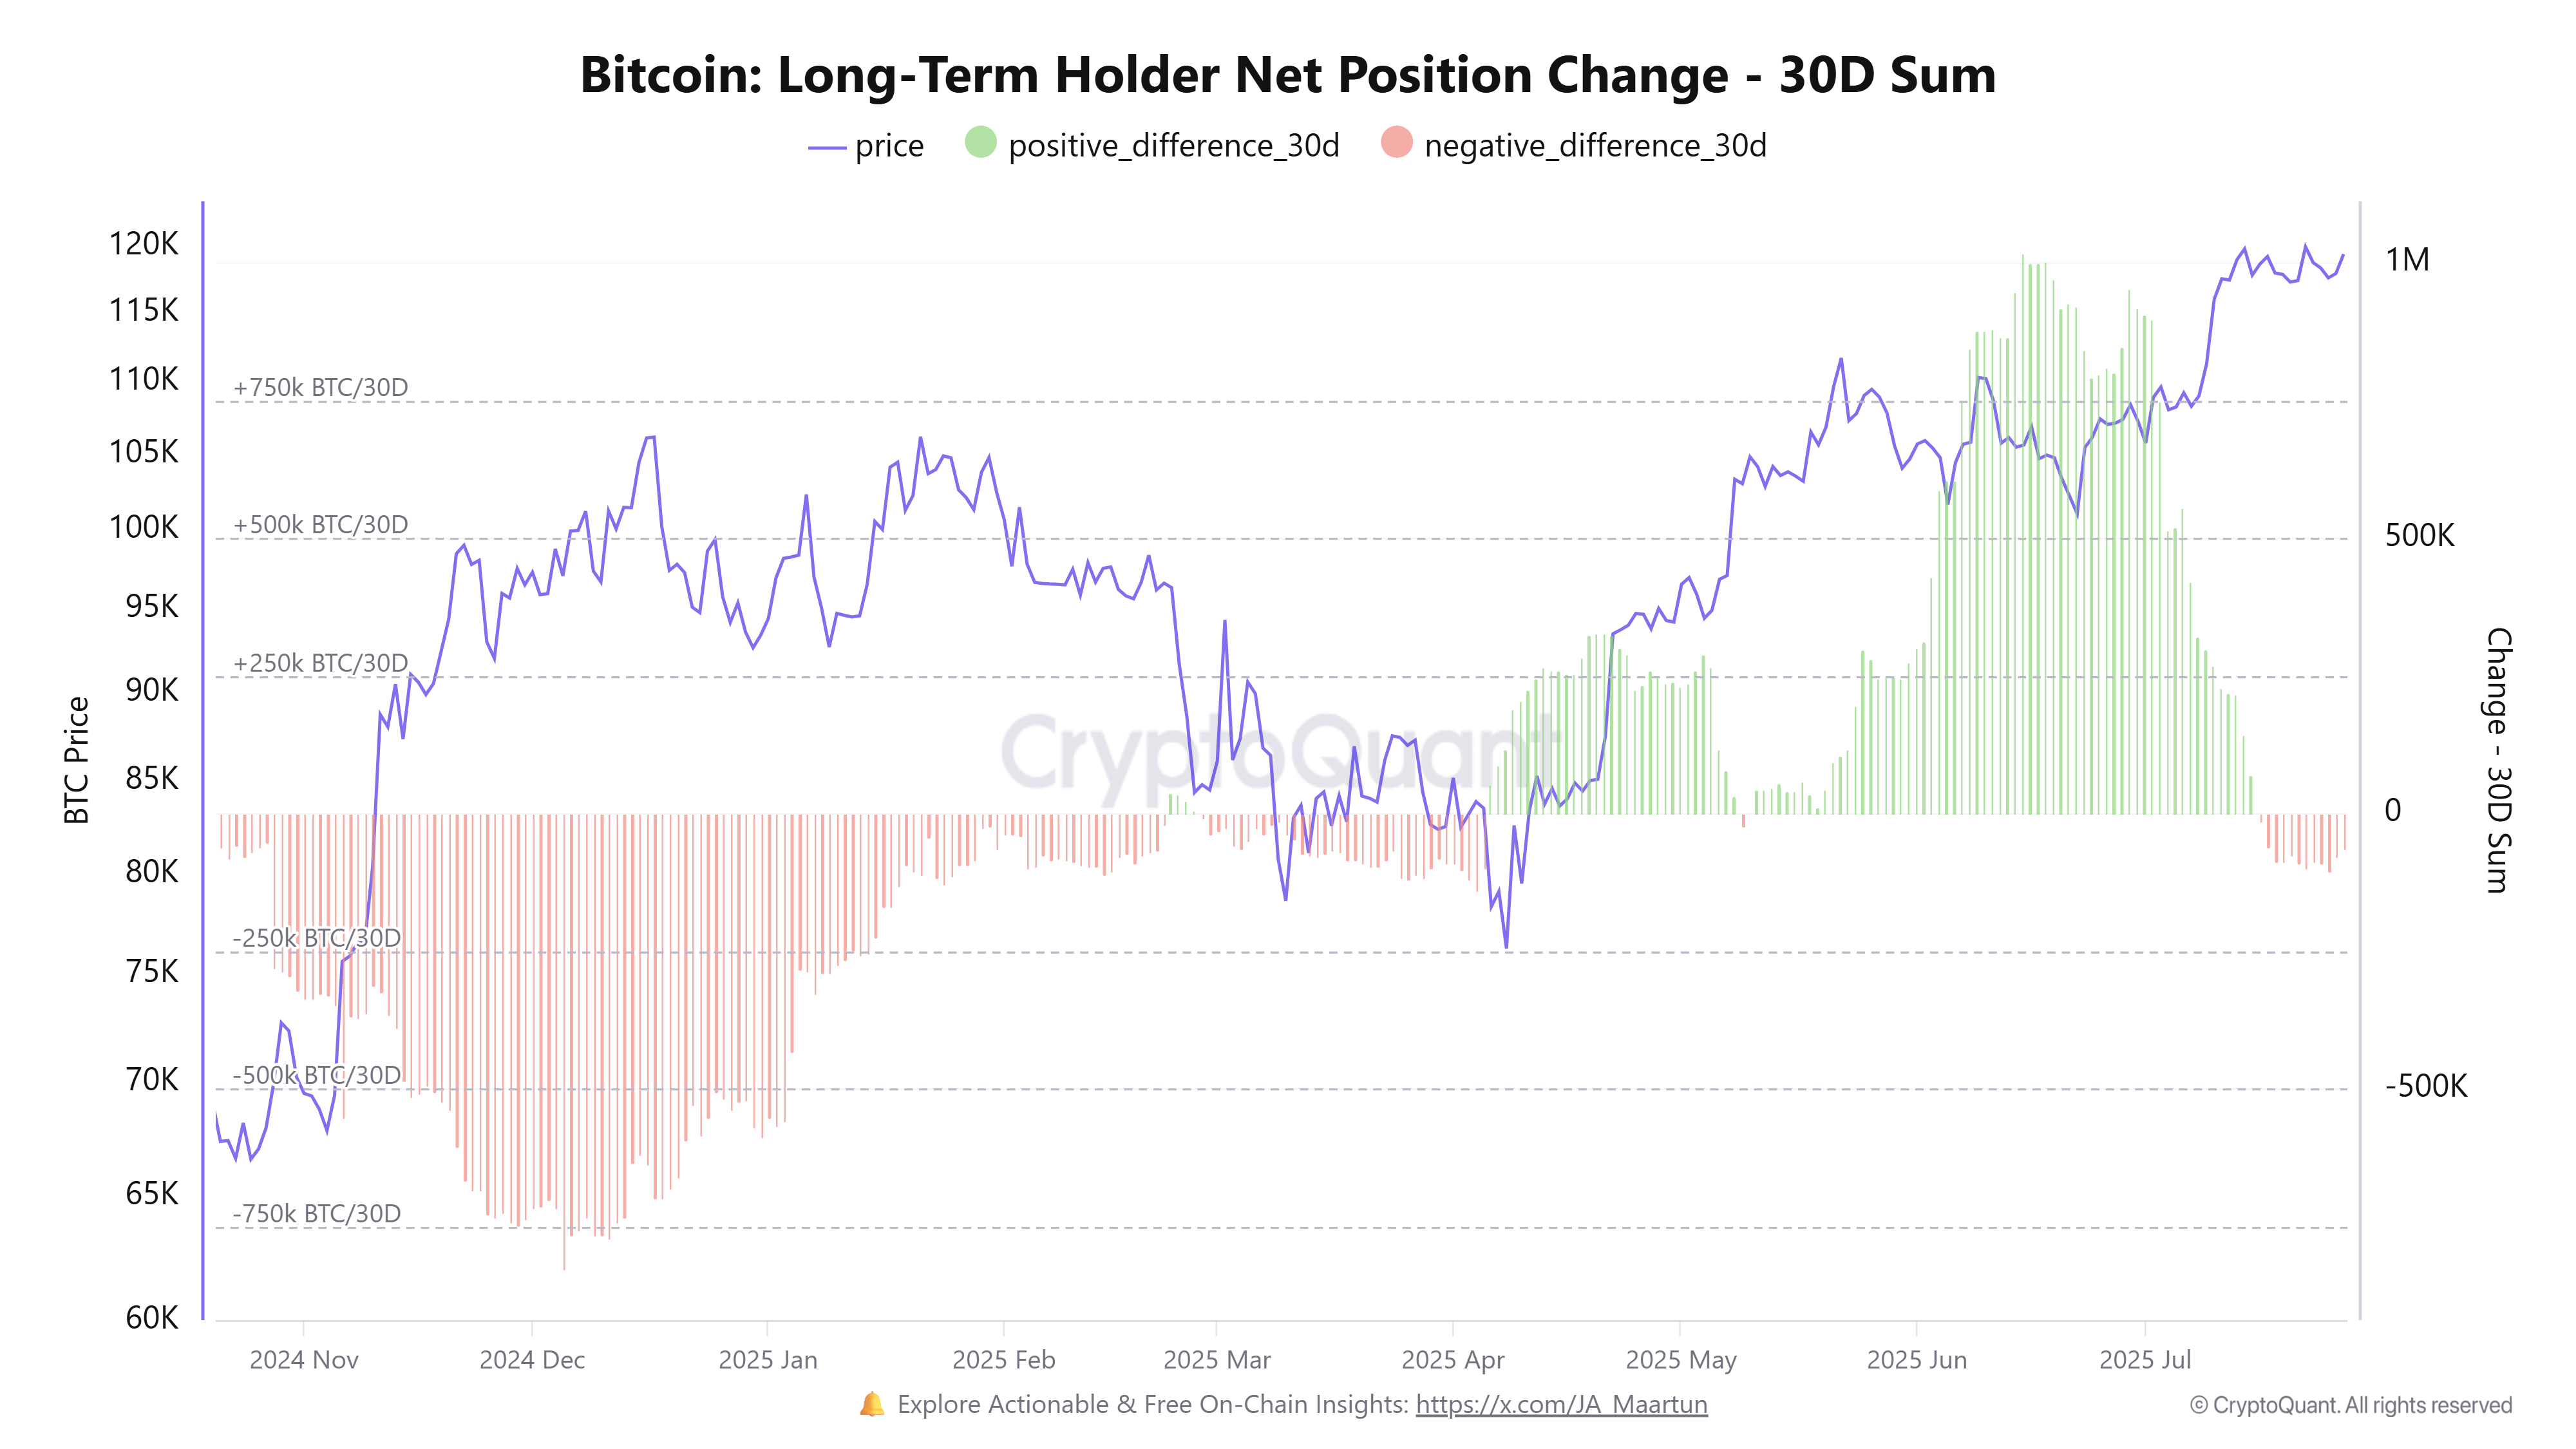
Bitcoin Long-Term Holder Net Position Change. Source: CryptoQuant
“Long-term holders (LTHs) have started to turn net negative right at the $120K resistance — a historically important psychological level. This shift suggests that some investors who’ve held through previous cycles might be starting to realize profits,” analyst Burakkesmeci noted.
In Q1 2025, negative net positions from long-term holders helped drag BTC below $75,000. If this group continues to sell, it could create significant selling pressure, increasing the risk of a strong correction in August.
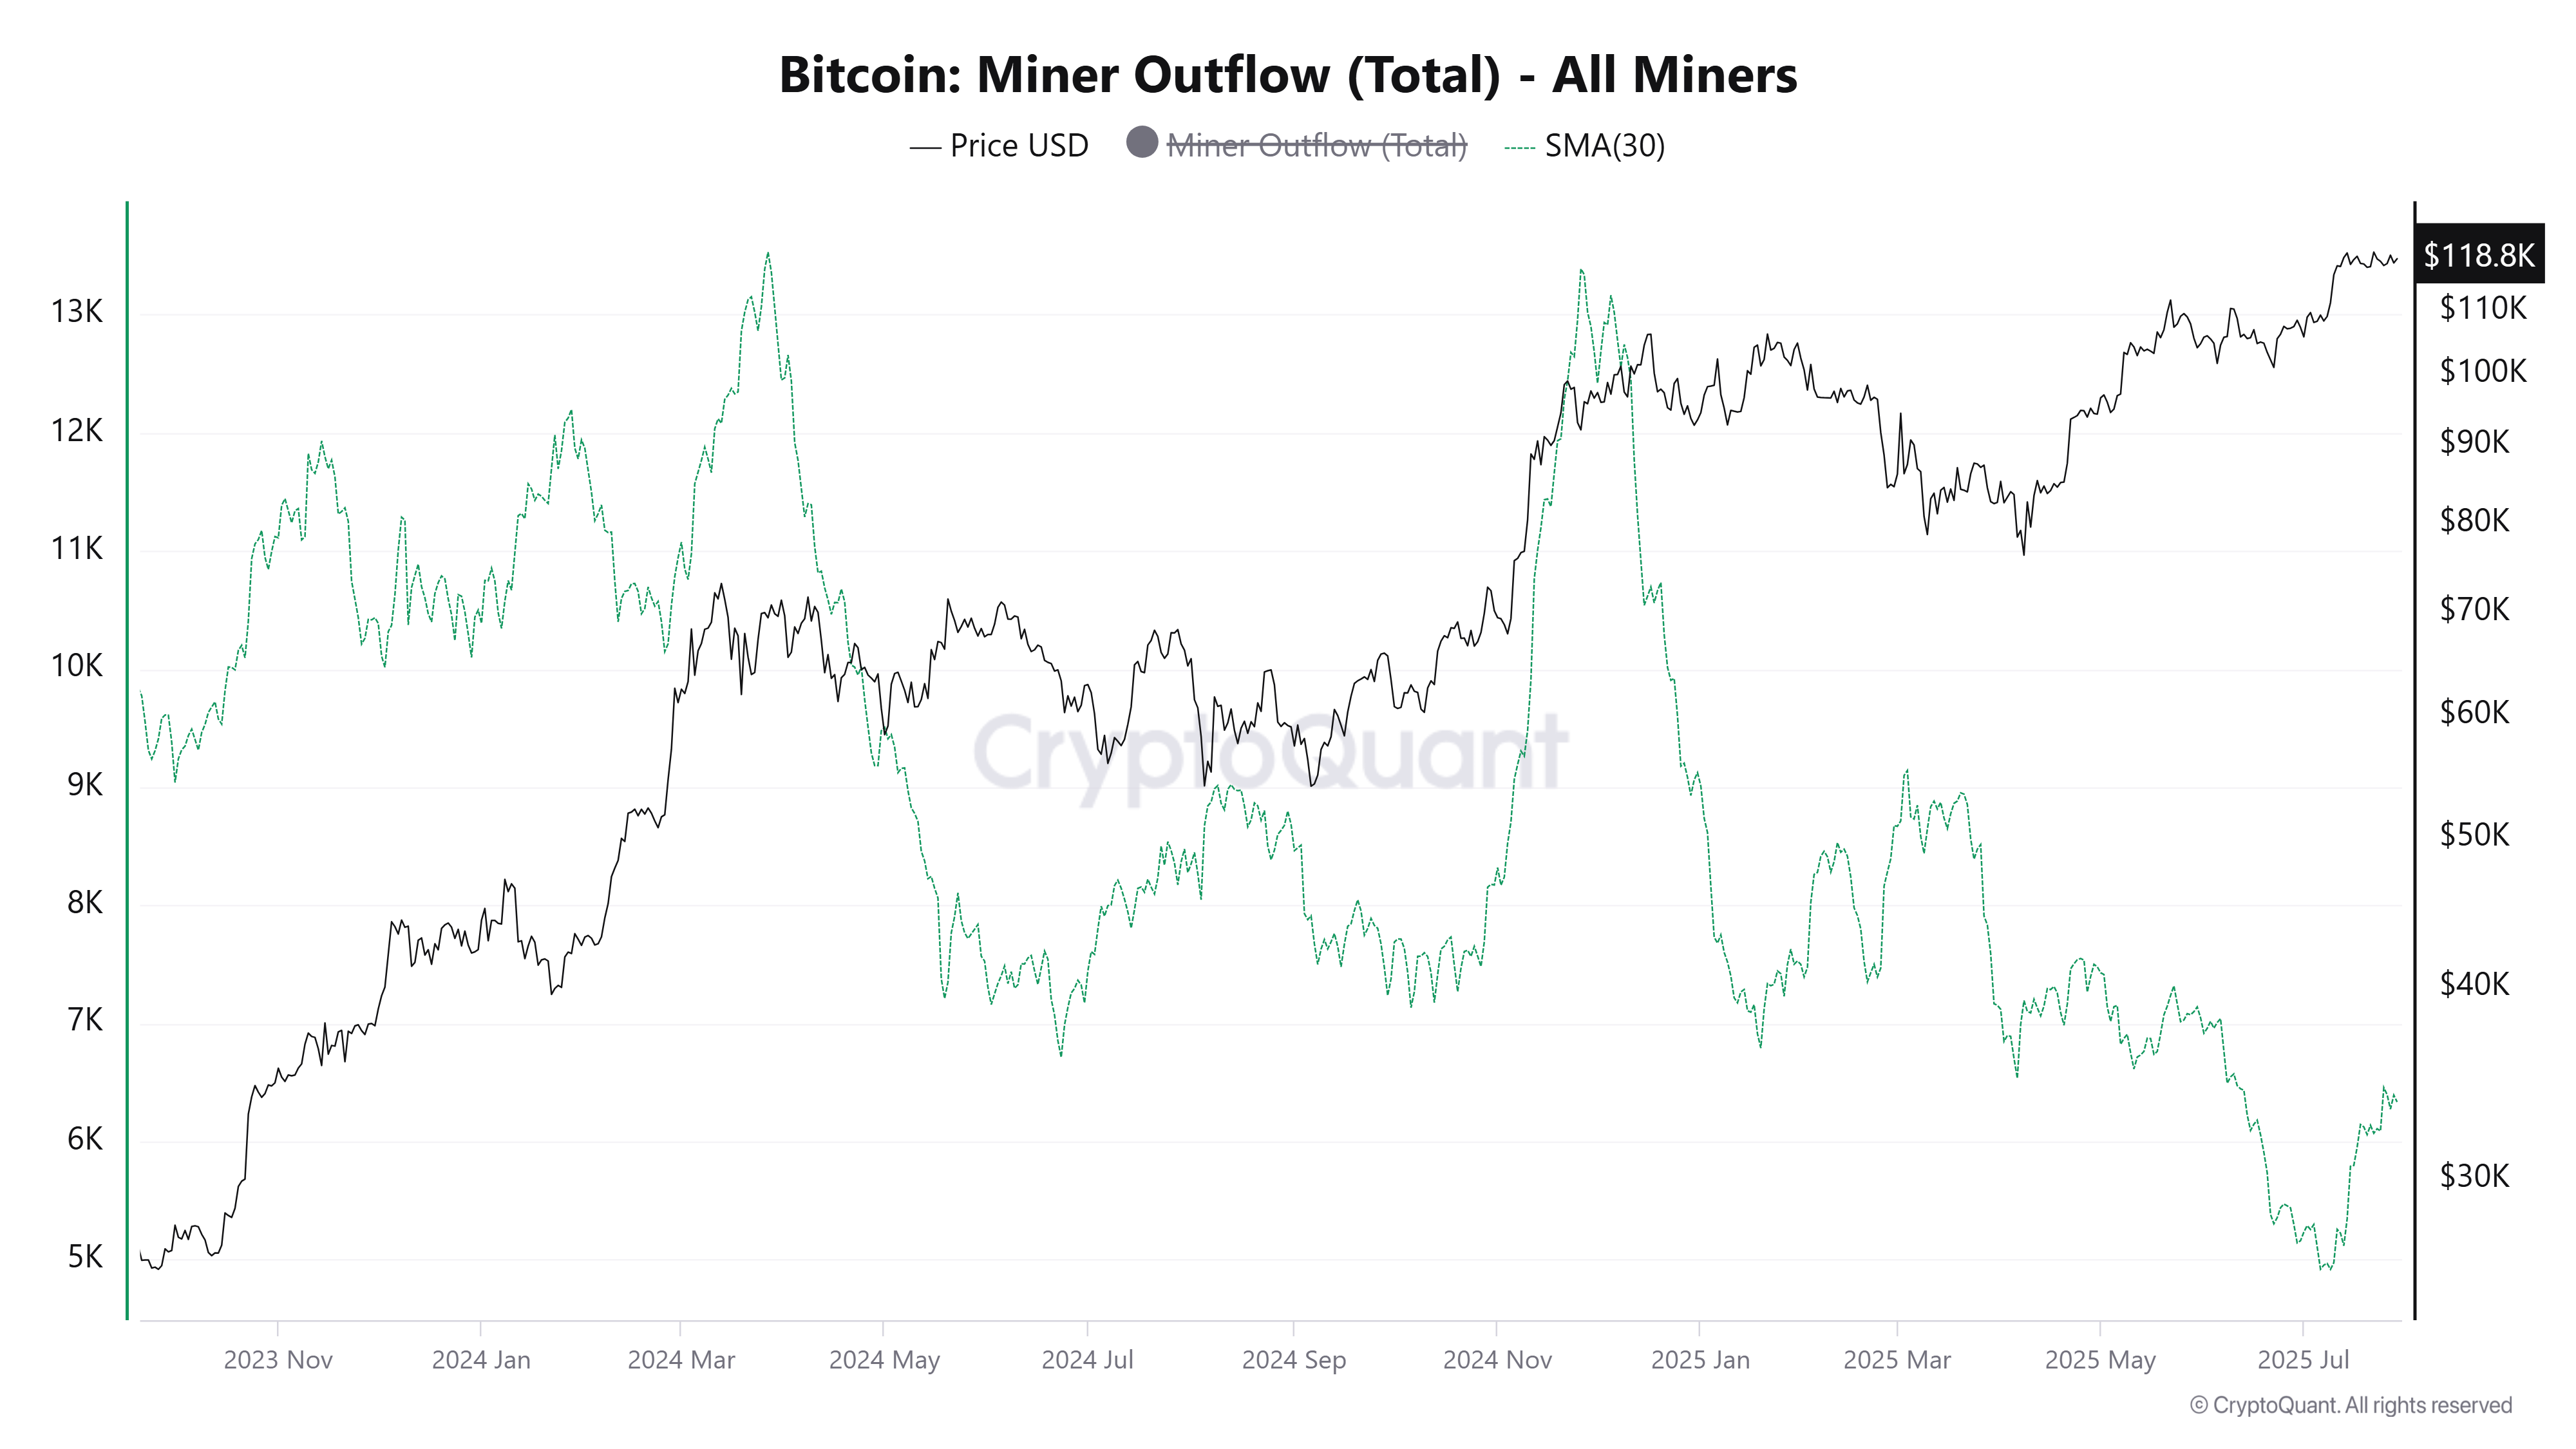
3. Miner Outflows Are Increasing
The third factor is rising miner outflows — a key indicator of selling pressure from Bitcoin miners.
CryptoQuant data shows that throughout July, BTC outflows from miner wallets started climbing again after a period of decline. This shift marks a possible trend reversal.
Miners often sell when they need liquidity to cover operational costs or when they want to lock in profits after a price rally. If this trend continues, it could amplify selling pressure, especially when combined with the activity from whales and long-term holders.
“The mean amount of coins per transaction sent from affiliated miners’ wallets. If miners send some proportion of their reserves at the same time, it could trigger a price drop,” CryptoQuant explained.
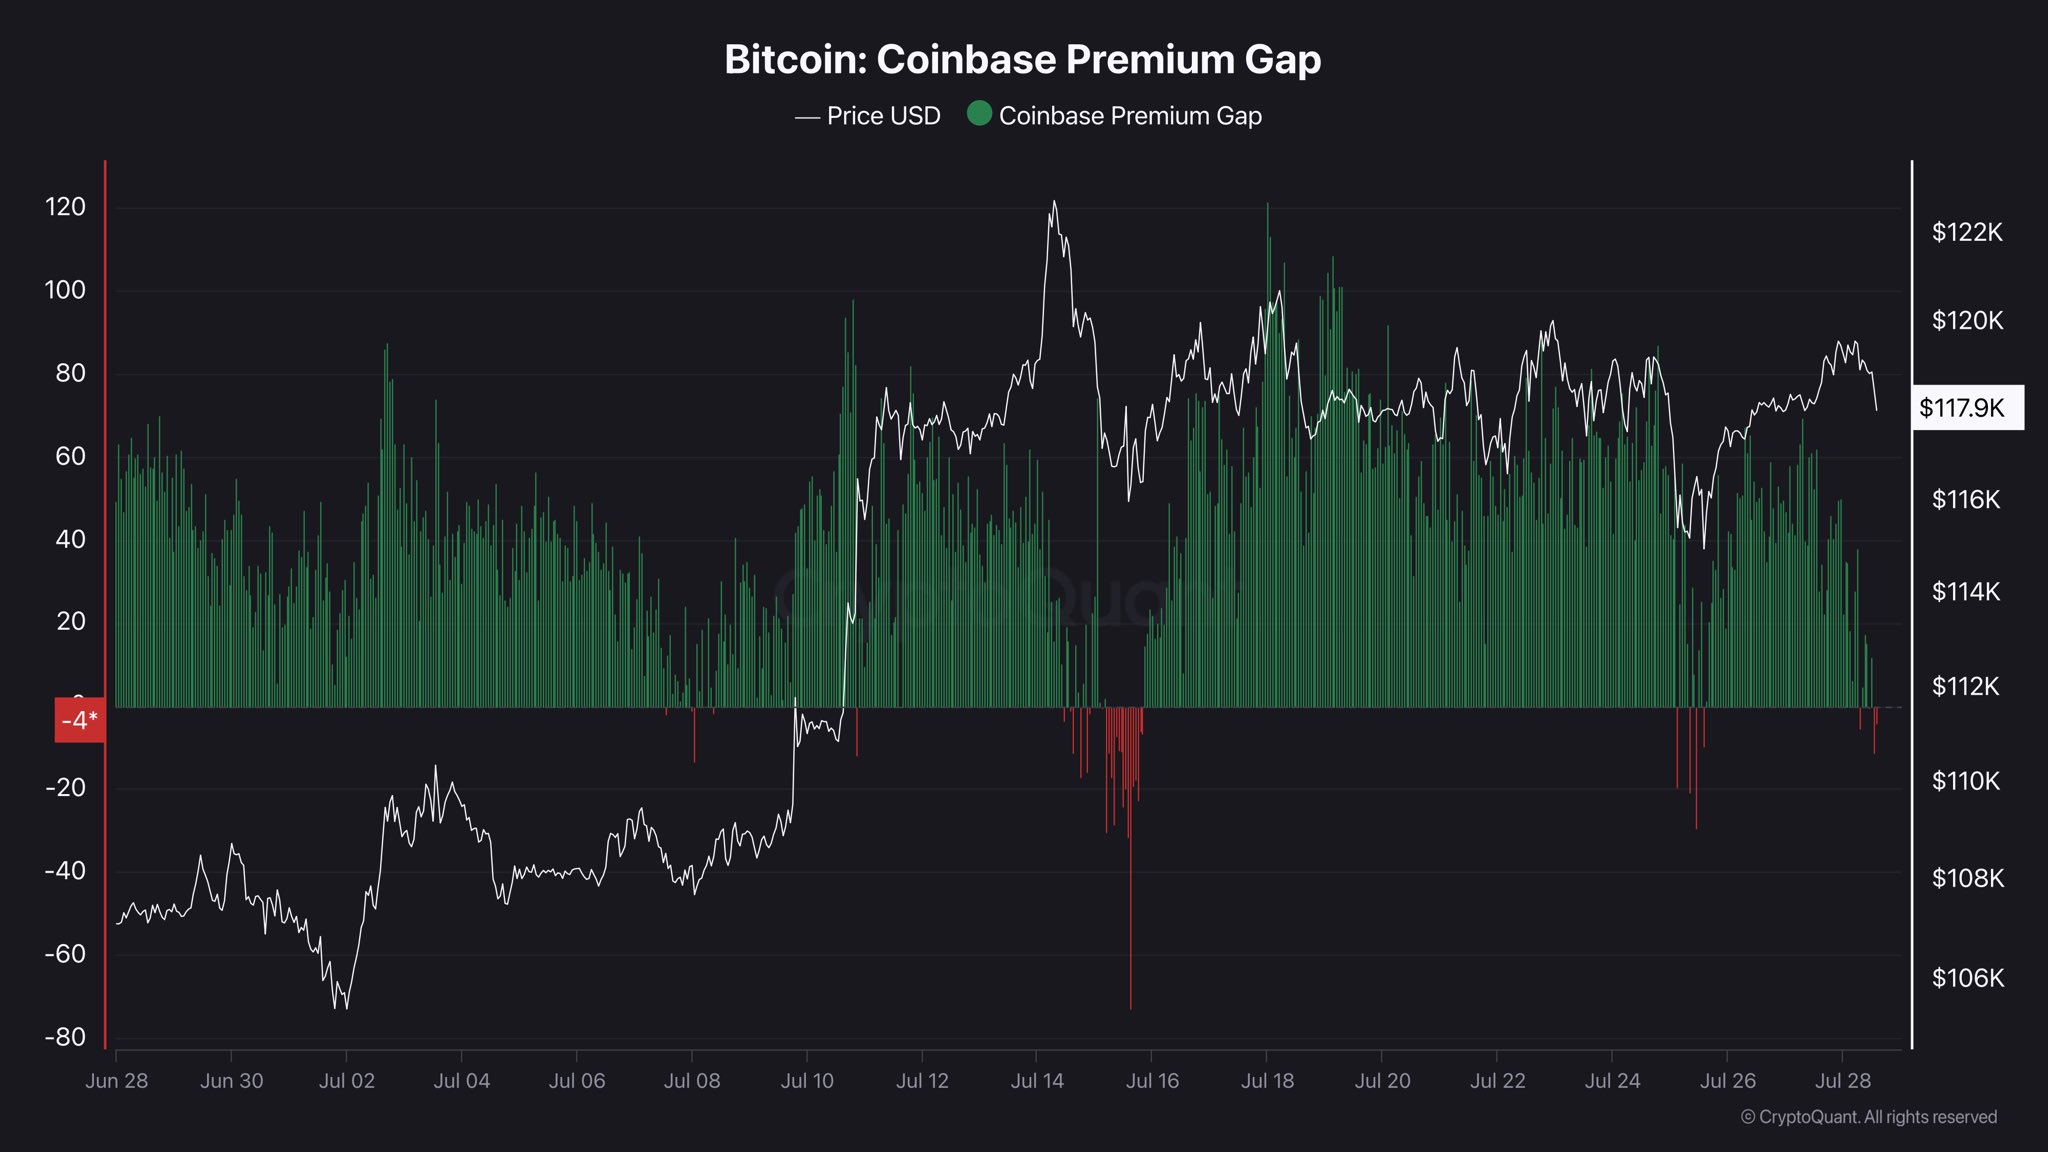
4. Selling Pressure from the US Investors
The Coinbase Premium indicator reflects the price gap between Coinbase and Binance. A negative premium means Bitcoin trades at a lower price on Coinbase, indicating weaker demand or stronger selling pressure in the US market.
This indicator essentially represents the behavior of US investors. Although it remained mostly positive, it turned negative at the end of July.
“Bitcoin Coinbase Premium Gap turned negative again. What does it mean? The demand in the US market is weakening. Caution is necessary,” analyst IT Tech commented.
Historically, a negative premium hasn’t always led to a trend reversal. However, it often signals a slowdown in upward momentum. If selling pressure continues to build, a negative outcome could unfold.
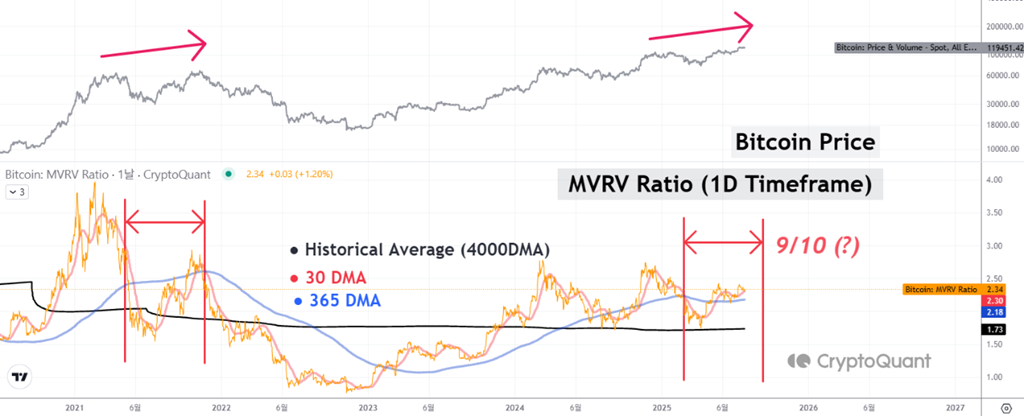
A Reversal Signal from the MVRV Ratio in August
Some analysts are adopting a more cautious stance for August, especially after Bitcoin recorded four straight months of gains.
According to Coinglass statistics, Q3 is historically the weakest quarter of the year. August, in particular, is often the worst-performing month within Q3.
CryptoQuant analyst Yonsei pointed out that the MVRV (Market Value to Realized Value) ratio is approaching a cycle-top threshold. This signal may appear by late August.
During the 2021 cycle, the MVRV ratio formed a double top that accurately predicted the market peak. If history repeats, August could mark Bitcoin’s local top before entering a correction or consolidation phase.
“In short, we’re entering a zone where optimism and caution must coexist. Let on-chain timing guide your strategy — now is the time to tighten risk management and stay nimble,” Yonsei concluded.
“However, the strong liquidity profile, matched with the market’s ability to handle large orders and growing demand from treasury companies, indicates the presence of sophisticated traders. These traders are more price agnostic, which should bode well for BTC’s price action heading into what can be a choppy month,” Kaiko stated.
Although whales, LTHs, and miners may trigger volatility, the current market structure could prevent a severe collapse.
Solana (SOL) has shown limited price movement recently despite a substantial accumulation of the token. The price has remained relatively stable in May, likely due to the altcoin’s overheating.
While this stagnation is a sign of caution, the market is optimistic, which could lead to potential gains for Solana in the near future.
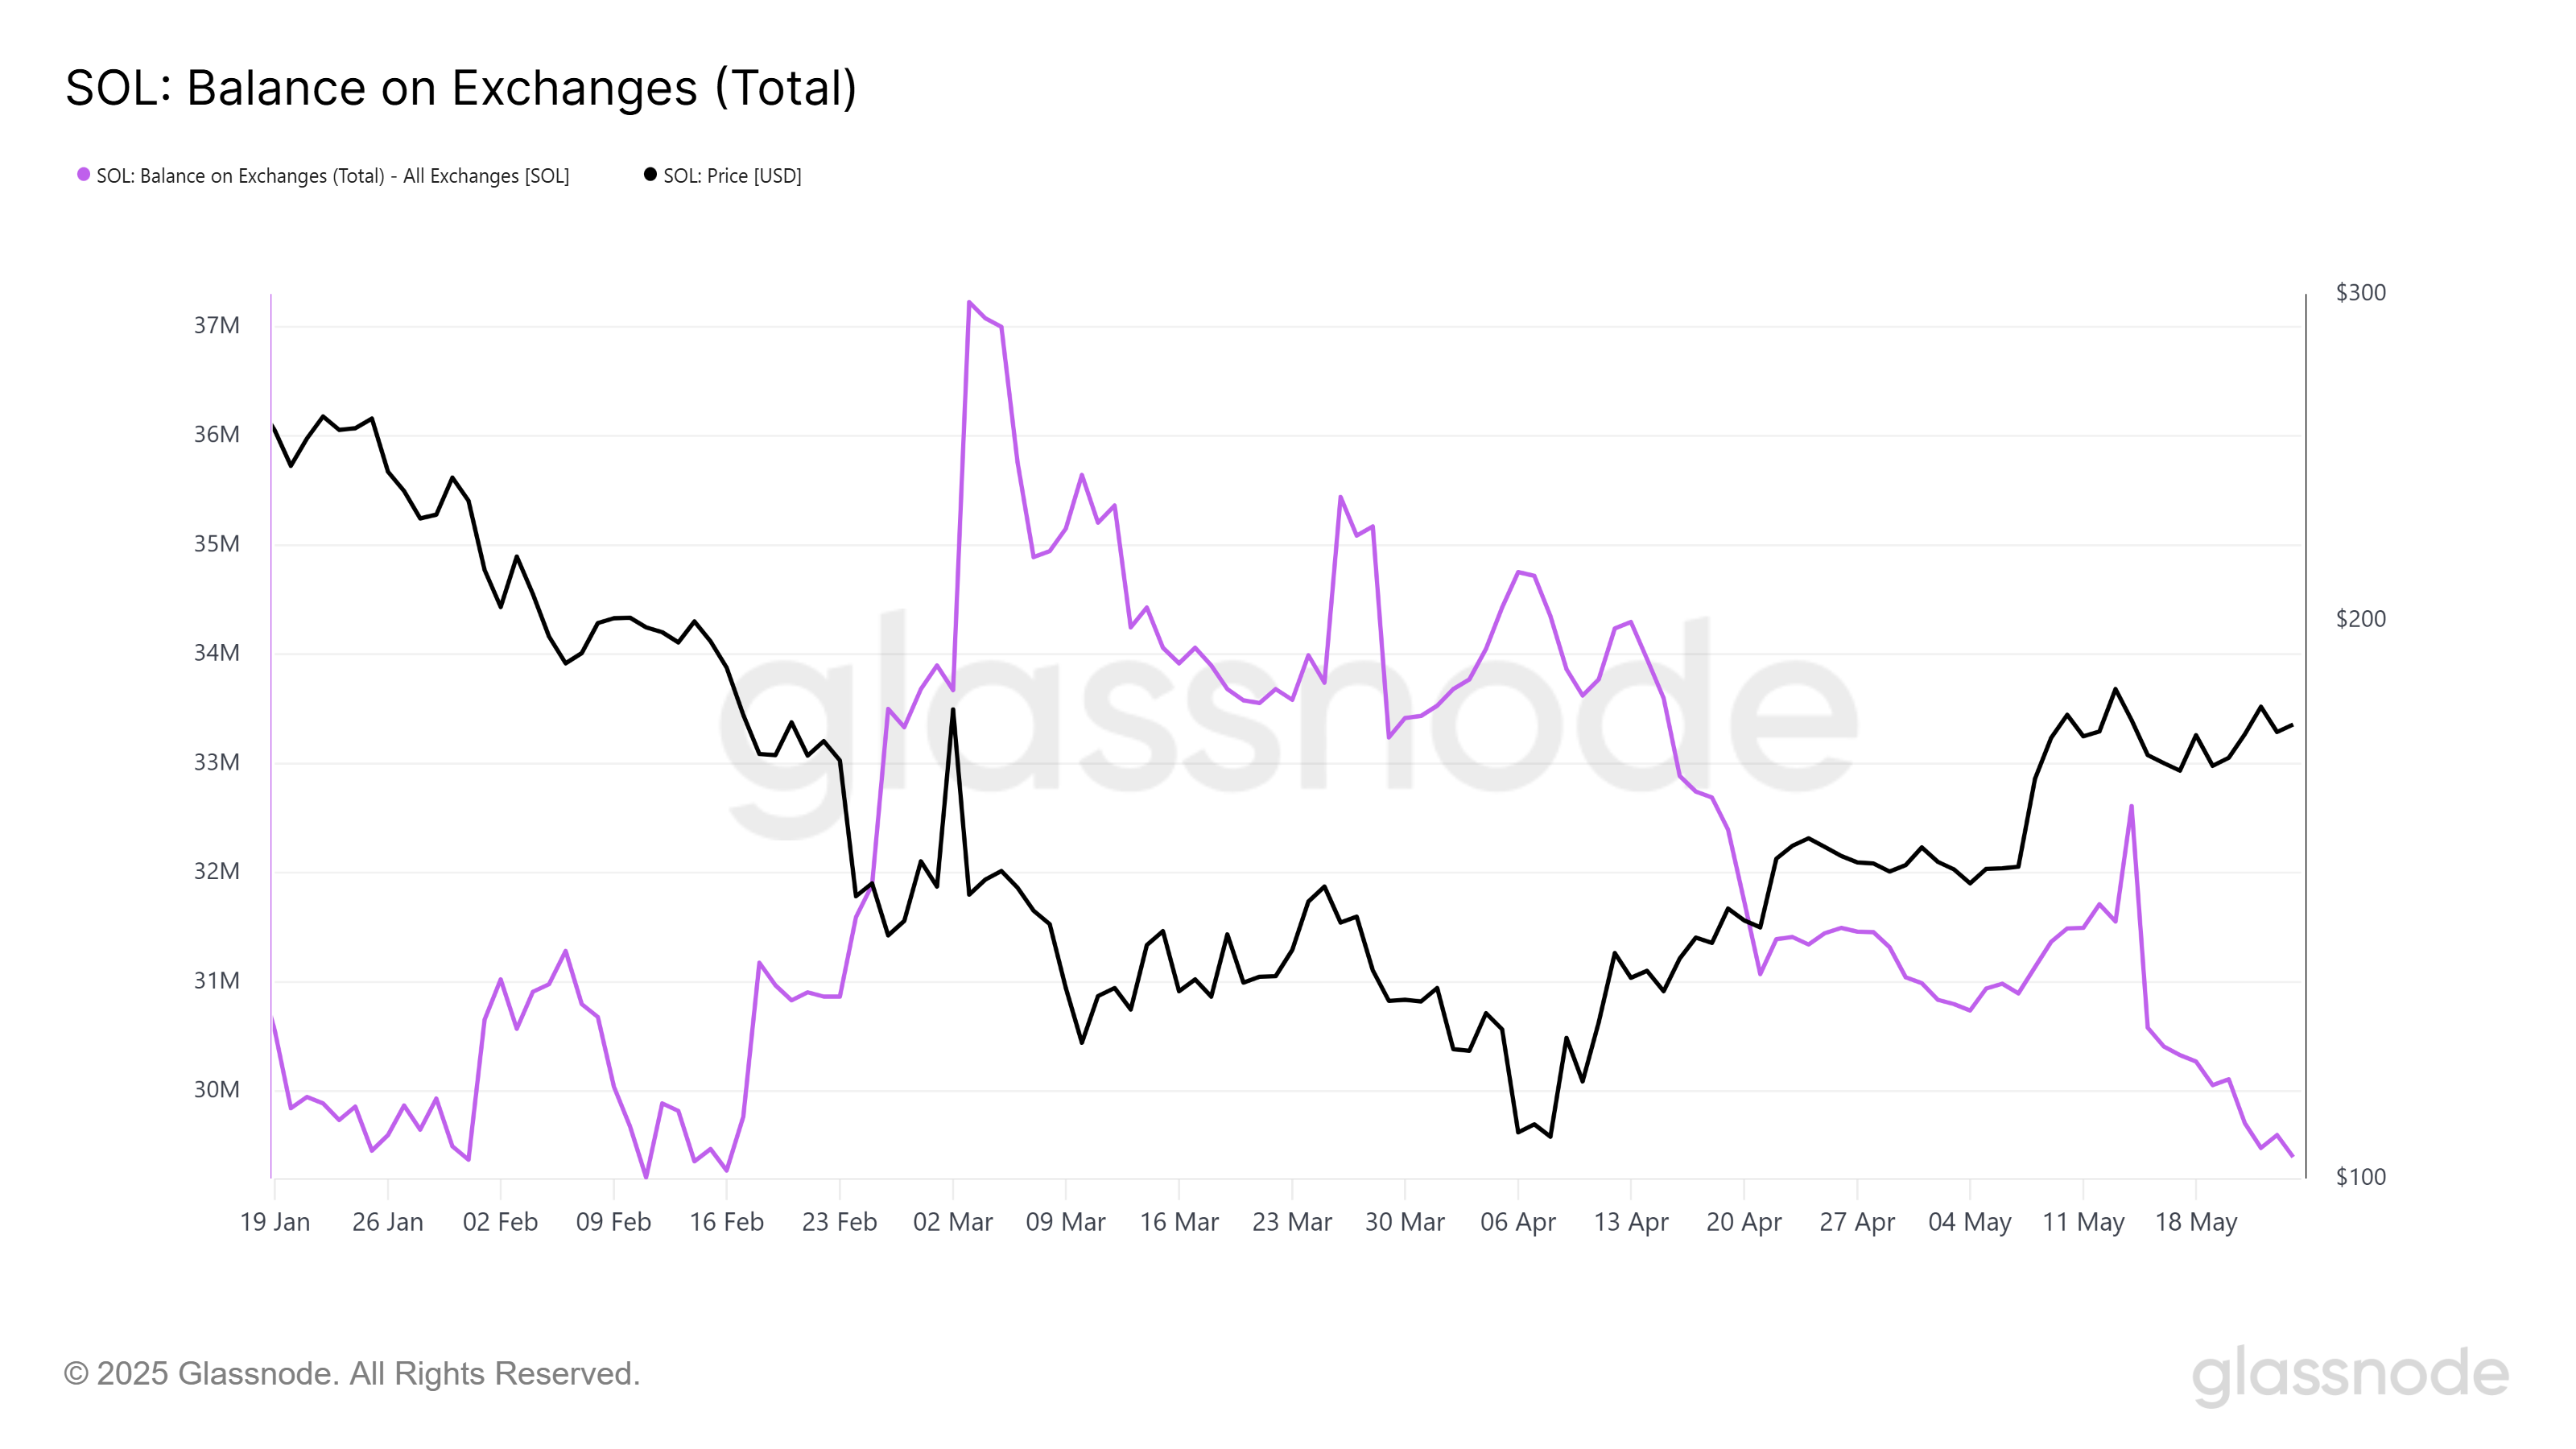
Solana Investors Continue Accumulation
Over the past 10 days, the balance of Solana on exchanges has dropped by 2.2 million SOL, valued at approximately $381 million. This decline in supply indicates that investors have been accumulating Solana during this period.
The ongoing accumulation is likely driven by a mix of factors, including the broader bullish market sentiment, fear of missing out (FOMO), and the expectation of future price appreciation.
This reduction in supply reflects increased investor confidence, with many choosing to hold rather than sell their SOL. As more investors accumulate the token, the supply on exchanges decreases, potentially creating upward pressure on the price in the long run.
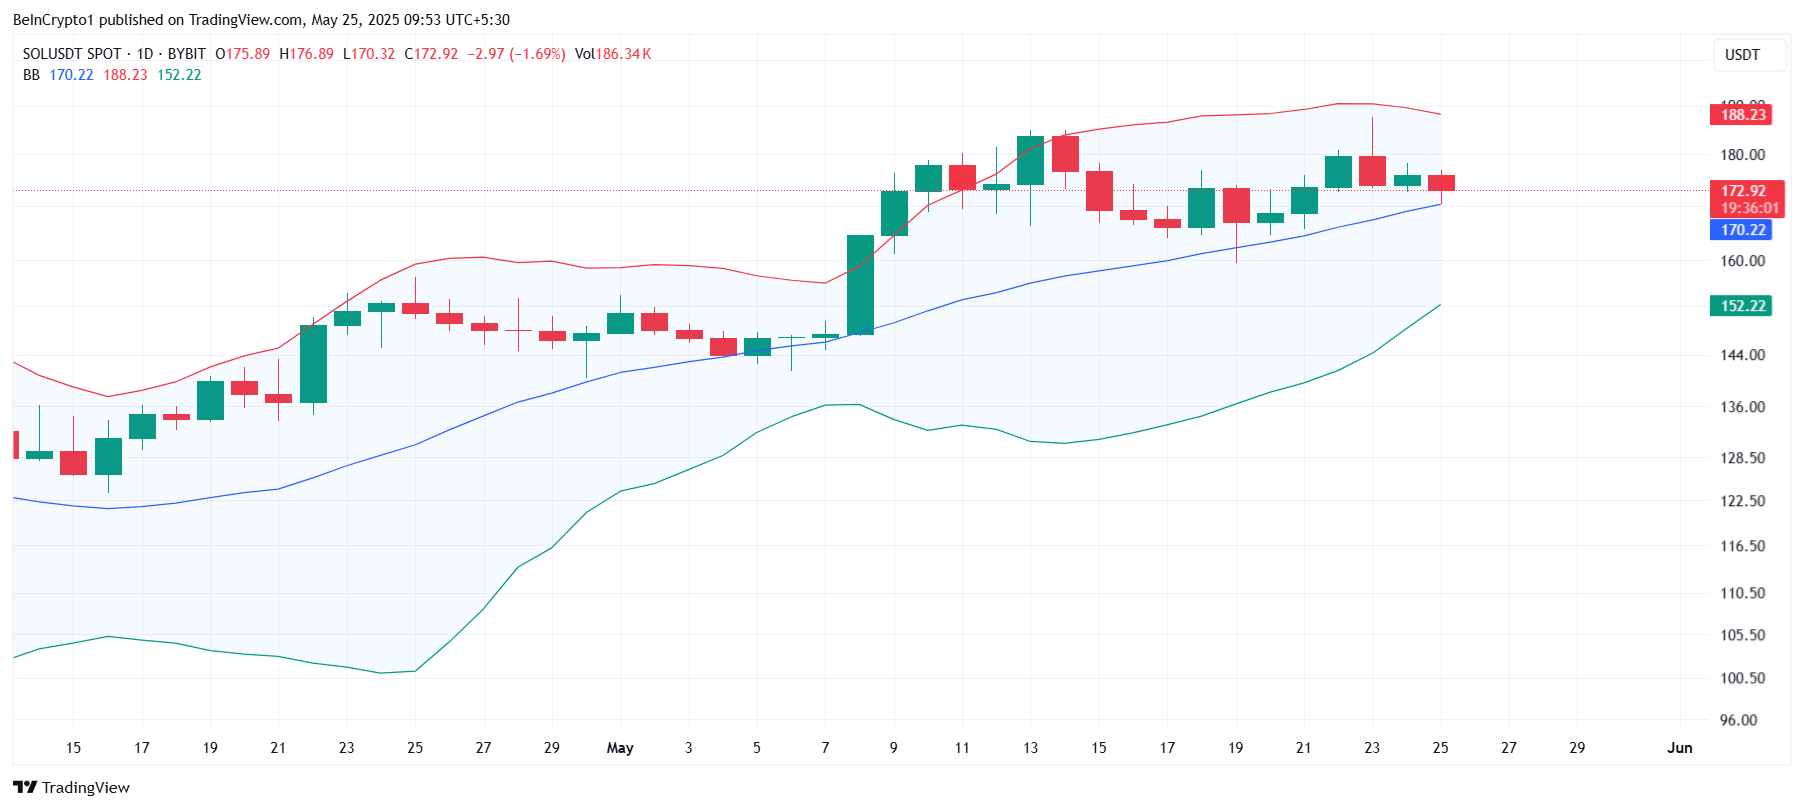
Solana’s overall market momentum shows signs of potential volatility. Technical indicators, such as the Bollinger Bands, reveal that the bands are narrowing.
This tightening of the bands is a classic signal of a potential squeeze, which often precedes a surge in price volatility.
Should the squeeze result in a bullish breakout, Solana could see a rise in price, especially with the broader market showing positive momentum.
However, the narrowing of the Bollinger Bands also suggests that a period of consolidation could occur before any significant move.
Solana’s price has been moving sideways for much of May, likely due to the token overheating in the previous weeks. However, this cooling-off period could create an opportunity for a bullish move.
As the broader market continues to show positive signals and the accumulation trend persists, Solana may rise from its current consolidation phase.
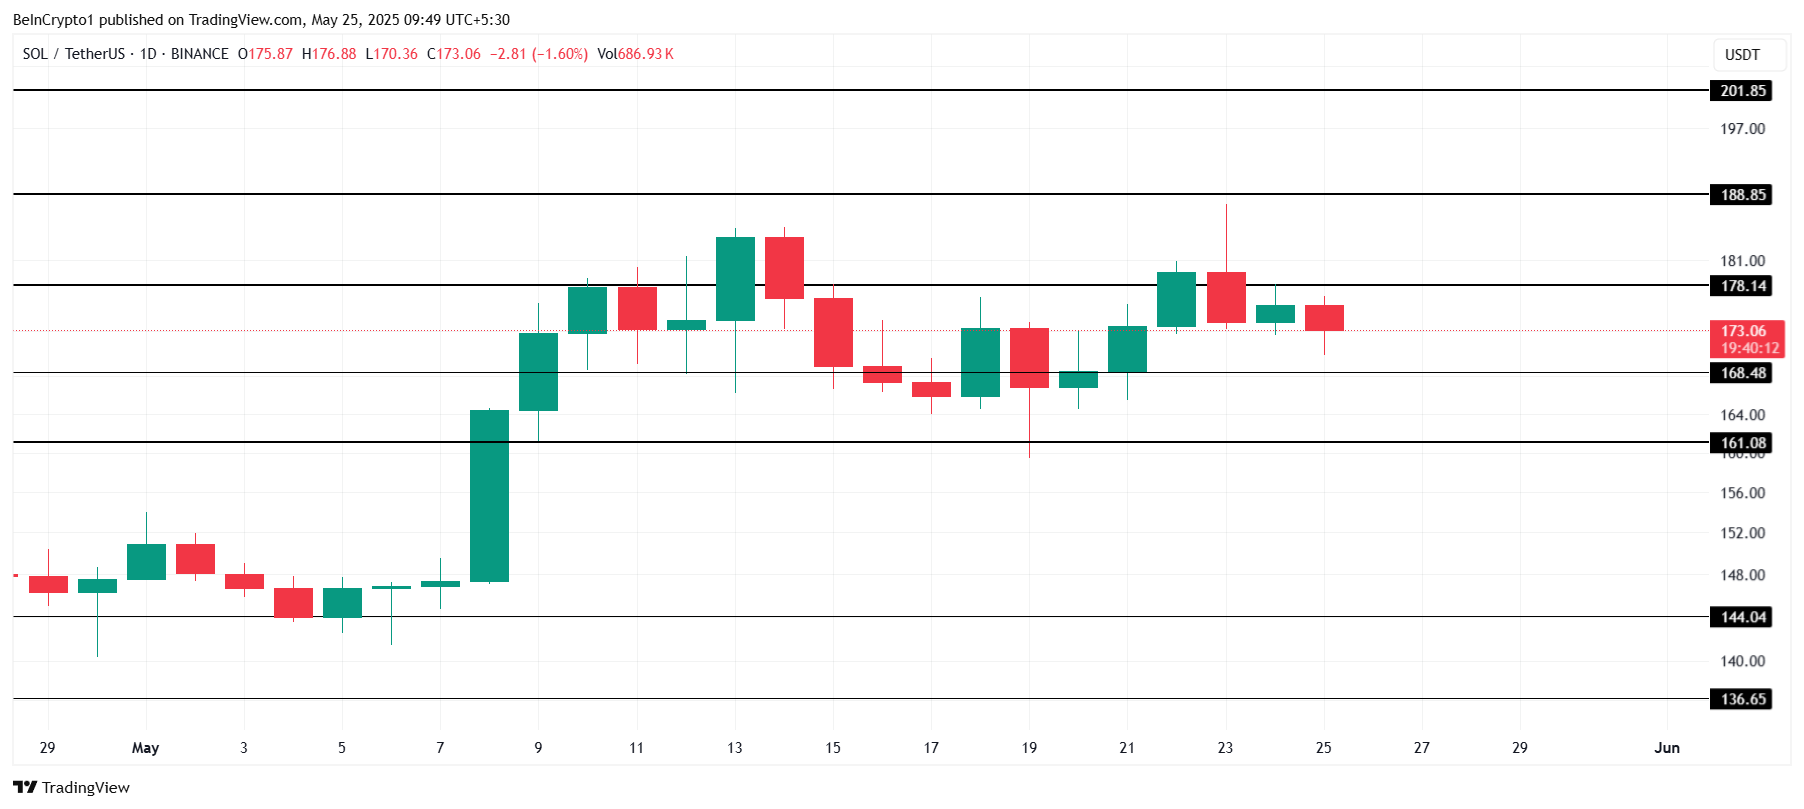
At $173, Solana is testing critical support levels. To initiate a rally, Solana would need to secure $178 as support. If it manages to break above $180 and successfully breaches $188, it could indicate the start of an uptrend.
A successful breakout above these levels would signal further upward potential.
On the other hand, if Solana fails to maintain support at $178, it could fall below the $168 mark, potentially reaching $161. Such a decline would invalidate the bullish thesis and suggest further downside risk for the token.