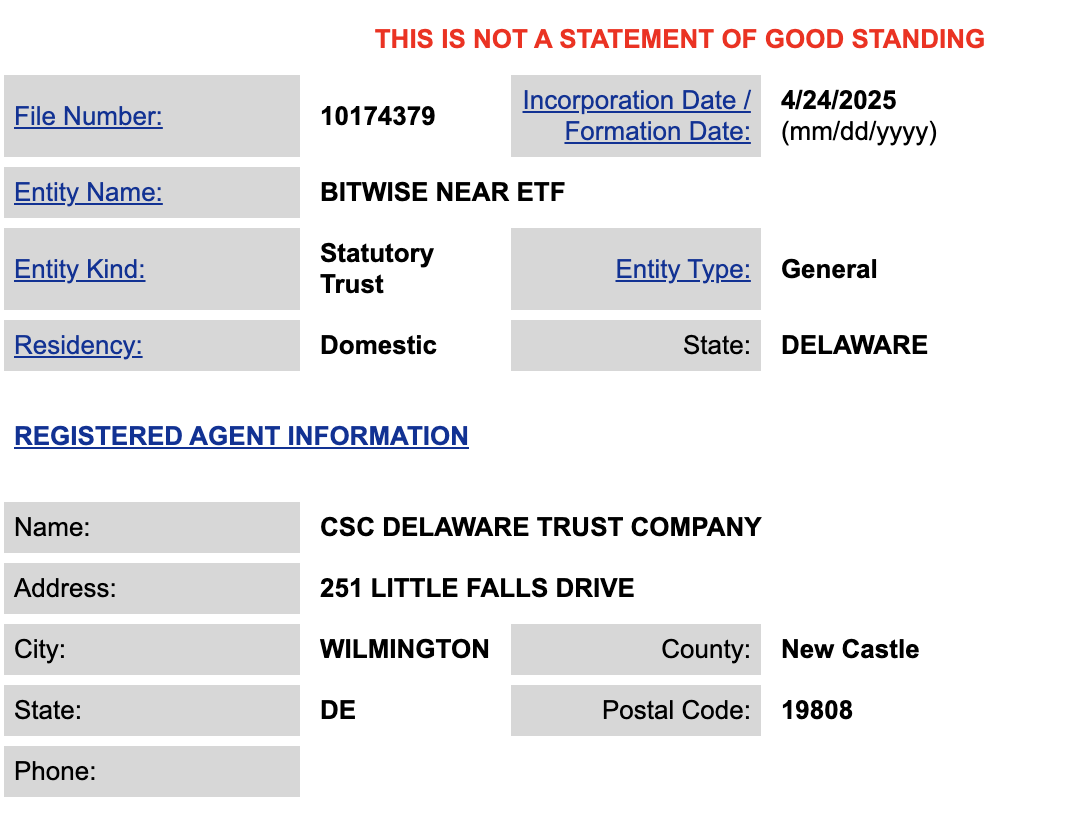
Bitwise just filed for a NEAR ETF, the first such application in the United States. In the last few weeks, the firm has attempted to create several new altcoin ETF products based on DOGE, APT, and others.
NEAR itself has been comparatively quiet in 2025, but this application could attract increased interest in the project.
Presently, the filing is very barebones, and the public has little information. If Bitwise or the SEC posts the full application in the future, that could help clear up a few questions.
For now, it may be safe to assume that the NEAR ETF resembles Bitwise’s other recent altcoin efforts.
NEAR is a Proof-of-Stake L1 blockchain optimized for dApp development. Launched in late 2020, it splits blockchains into sub-chains with independent validators to increase transaction processing efficiency.
The altcoin saw heightened interest at the tail end of last year but has had a relatively smaller presence throughout 2025.
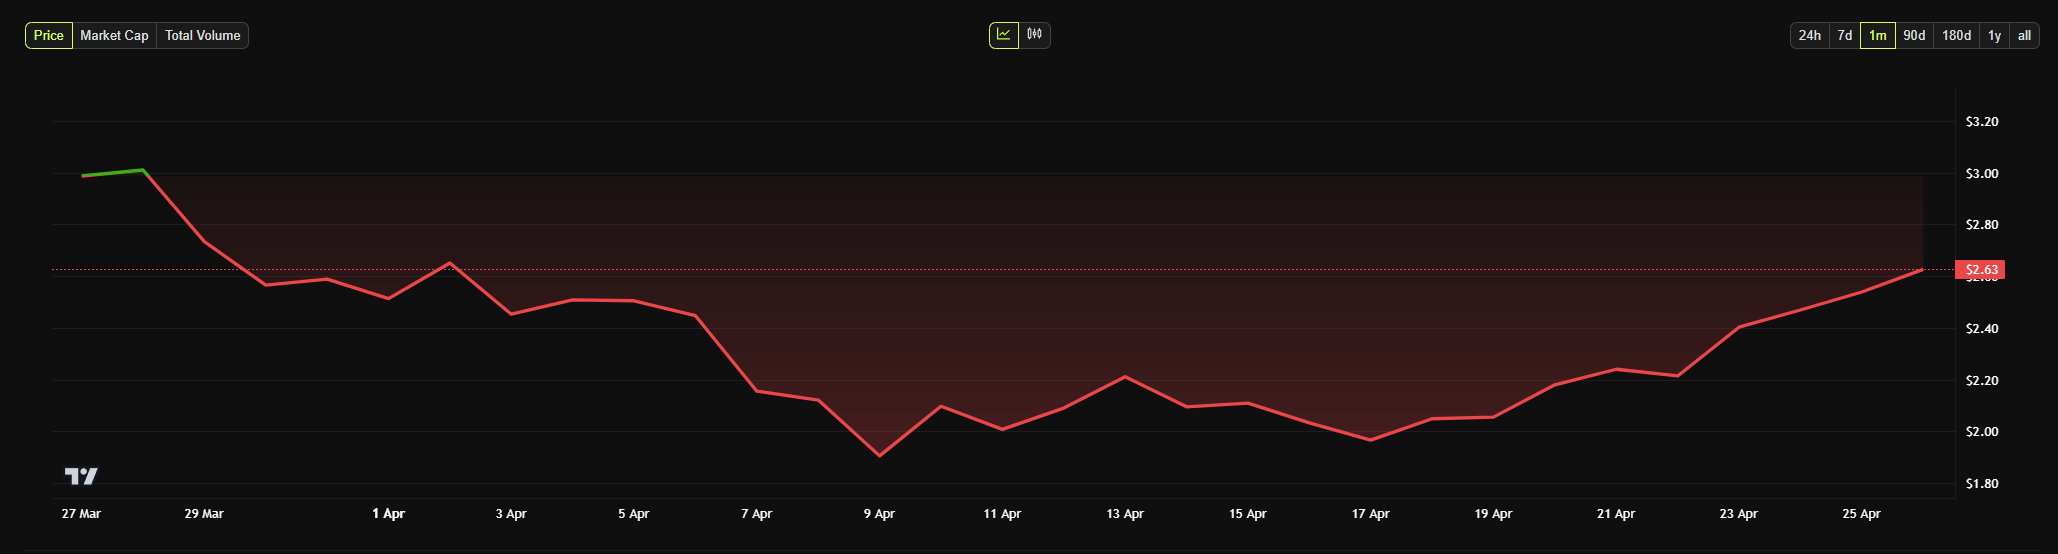
Now that Bitwise wants to create a NEAR ETF, that might attract some attention. The asset’s price has been on the upswing; after a slump in mid-April, it increased over 25% in the last two weeks.
Obviously, these gains have nothing to do with Bitwise’s filing, but the ETF effort might help build forward momentum.
NEAR Protocol Monthly Price Chart. Source: BeInCrypto
Bitwise’s current plan involves several other “first of its kind” ETFs, and a NEAR product might face a crowded market if approved. As the number of altcoin ETFs increases, the law of diminishing returns could have a negative impact.
Bittensor (TAO) has been up 6.5% over the past seven days, and its market cap is now hovering just below $4 billion despite correcting 6.6% in the last three days. The recent pullback has weakened key technical indicators, with both momentum and trend strength showing signs of deterioration.
While TAO has managed to hold key support levels and remains above $440, bearish signals are starting to emerge across multiple charts. Whether bulls can reclaim control or TAO slips below $400 will likely define its next major move.
Bittensor Trend Weakens as Bearish Momentum Overtakes Bulls
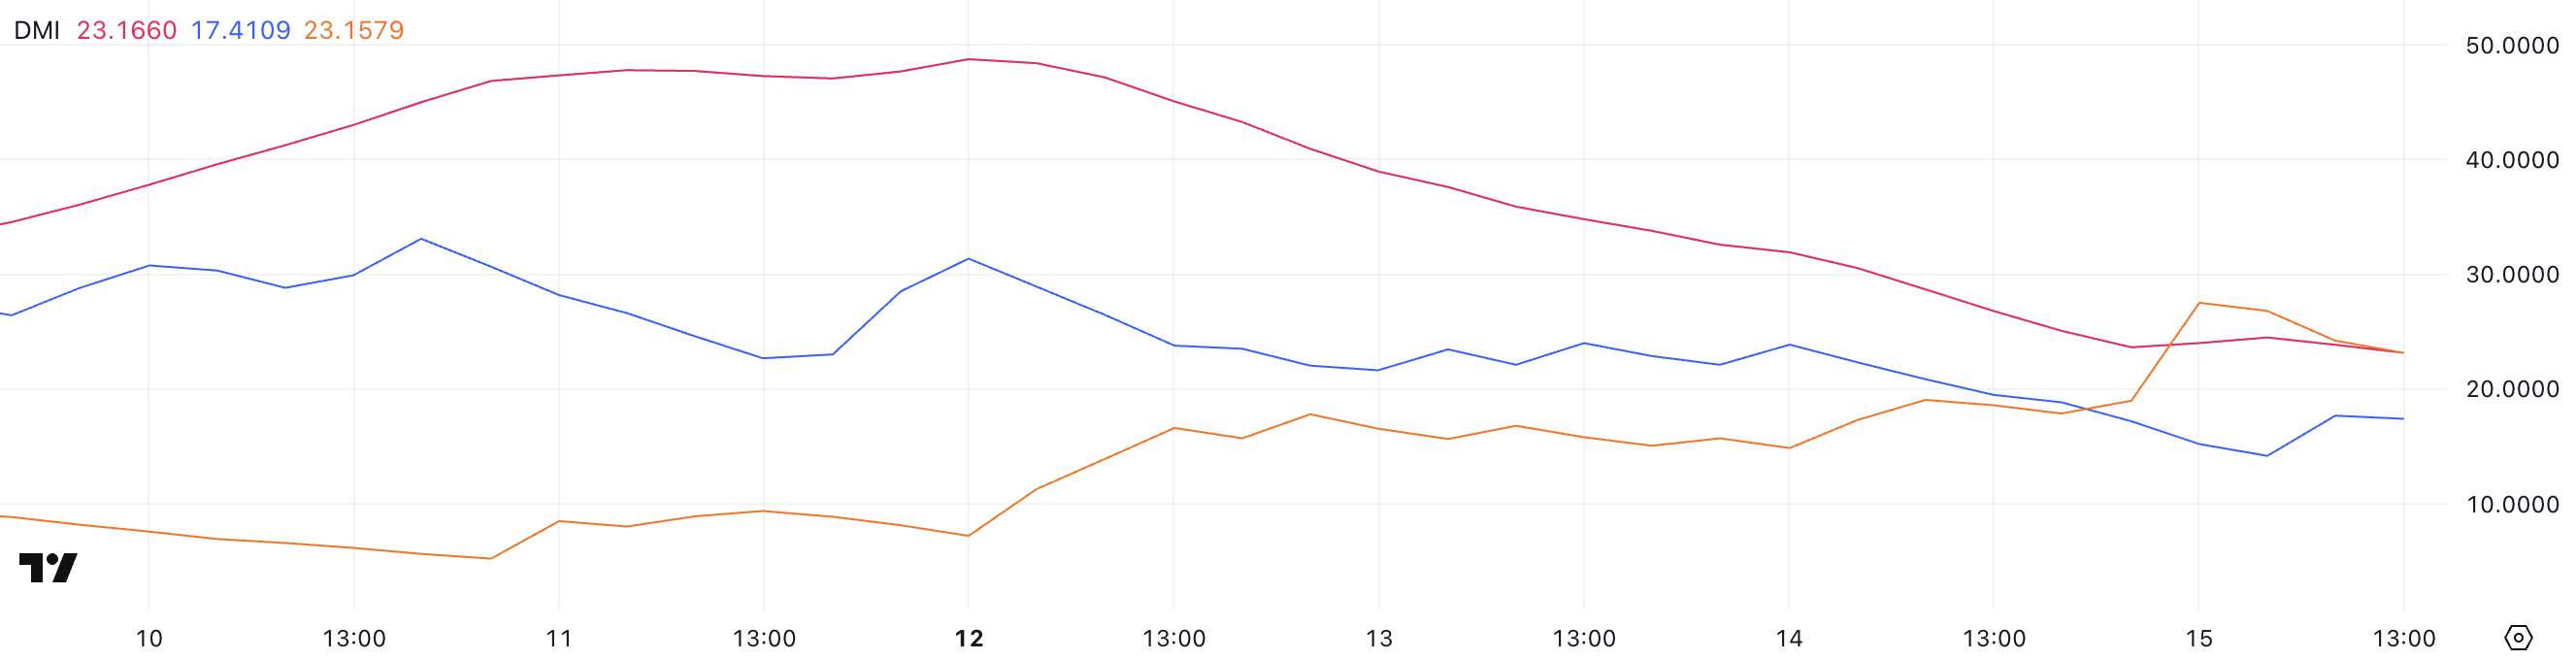
TAO’s DMI (Directional Movement Index) chart shows a weakening trend, with its ADX (Average Directional Index) falling sharply from 47 to 23.16 over the past three days.
The ADX measures the strength of a trend—regardless of direction—on a scale from 0 to 100. Values above 25 typically indicate a strong trend, while readings below 20 suggest a weak or ranging market.
TAO’s current ADX is just above 23, suggesting the recent trend is losing strength and may be nearing a transition phase. Despite that, according to CoinGecko data, Bittensor is the biggest artificial intelligence coin in the market, surpassing players like NEAR, ICP, and RENDER.
Meanwhile, the +DI (Positive Directional Indicator) has dropped from 23.87 to 17.41, signaling a decline in bullish pressure. At the same time, the -DI (Negative Directional Indicator) has risen from 17.86 to 23.15, showing that bearish momentum is gaining control.
This crossover—where -DI moves above +DI—indicates that sellers have overtaken buyers, and with ADX still above 20, the downtrend may continue to develop.
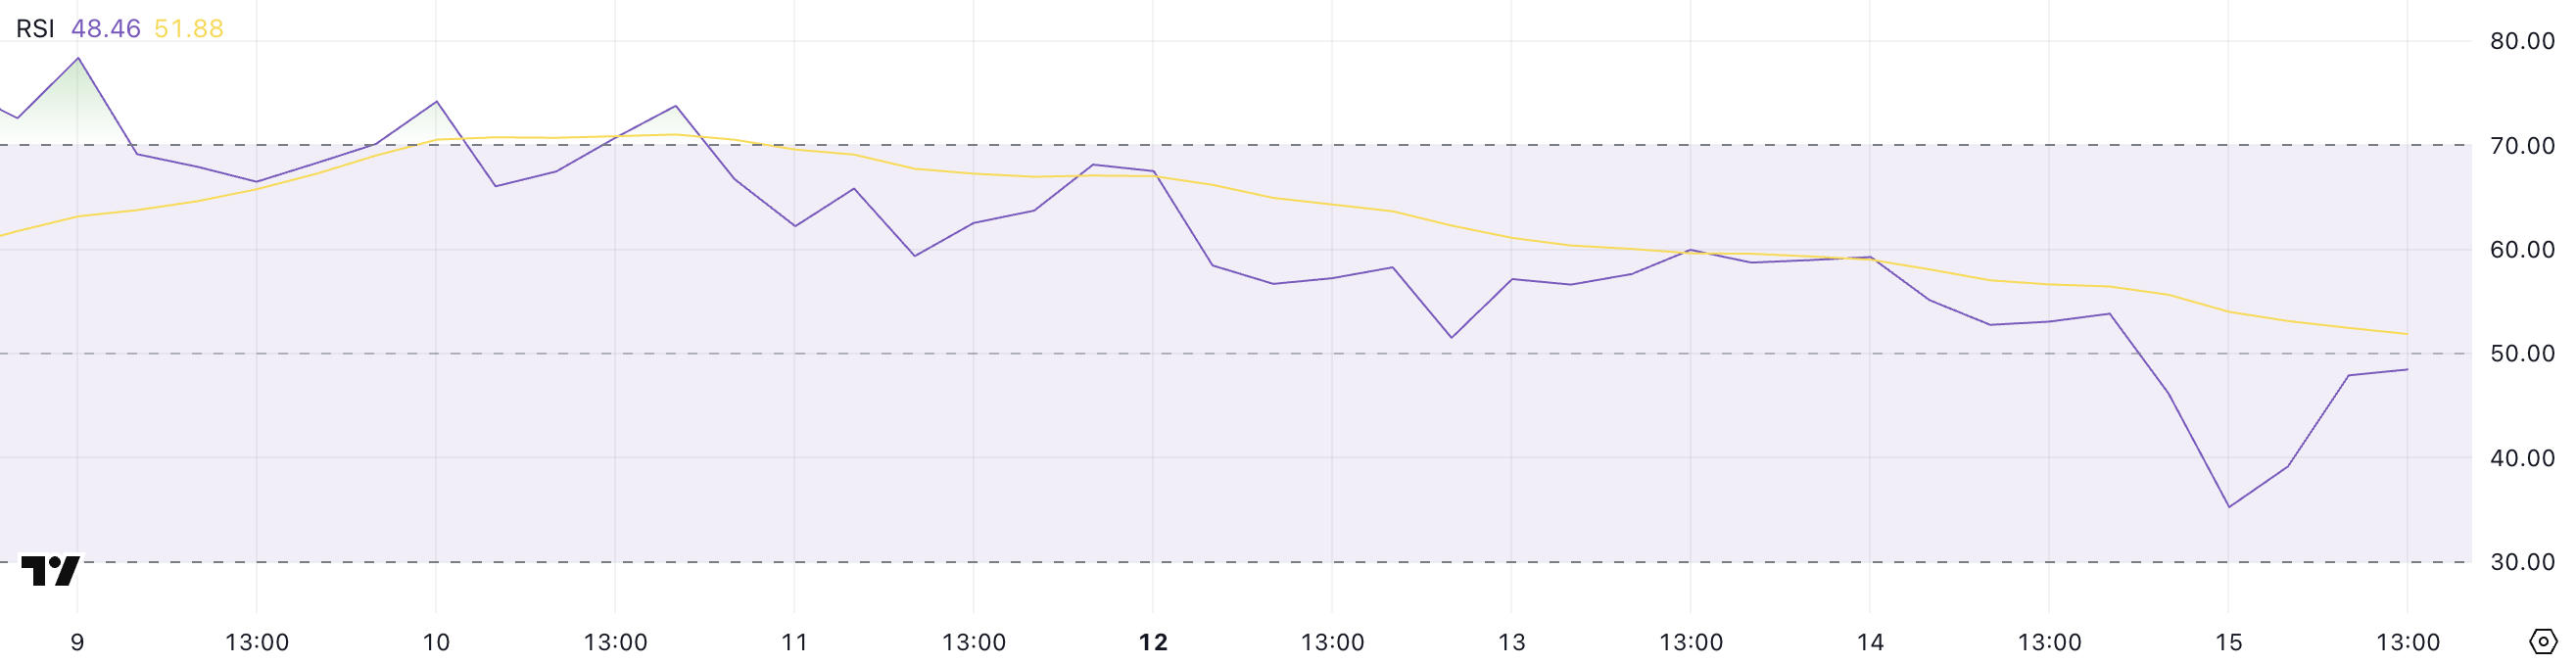
TAO’s Relative Strength Index (RSI) is currently at 48.46, after experiencing a sharp intraday dip from 53.82 yesterday to as low as 35.25 just a few hours ago.
The RSI is a momentum indicator that measures the speed and magnitude of recent price movements on a scale from 0 to 100. Typically, values above 70 suggest overbought conditions and potential for a pullback, while values below 30 indicate oversold conditions and a possible rebound.
TAO’s current RSI of 48.46 places it slightly below that midpoint, signaling a mild bearish bias after a brief period of stronger selling pressure.
The recovery from the 35.25 low shows that buyers have stepped back in, but the failure to hold above 50 suggests that bullish momentum remains weak. This level could reflect consolidation or indecision in the market, where TAO may trade sideways unless new catalysts emerge.
If RSI stabilizes or climbs above 50 again, it may indicate renewed strength, while another drop toward 30 would increase the risk of further downside.
TAO Holds Support but Faces Key Test for Momentum Recovery
TAO recently tested key support around $417.6 and bounced back above $440, showing resilience after a brief dip. Its EMA lines still reflect a bullish structure, with short-term moving averages positioned above the long-term ones.
However, the narrowing gap between them suggests that momentum is weakening. If selling pressure returns, the trend could shift, threatening Bittensor’s leadership as the biggest AI coin.
Bitcoin ETFs continued their inflow streak on Wednesday, raking in over $900 million in fresh capital.
However, despite the bullish ETF demand, Bitcoin’s open interest has dipped, and its funding rates have flipped negative, a sign that short-term market sentiment may be shifting.
Bitcoin ETFs Stay Hot
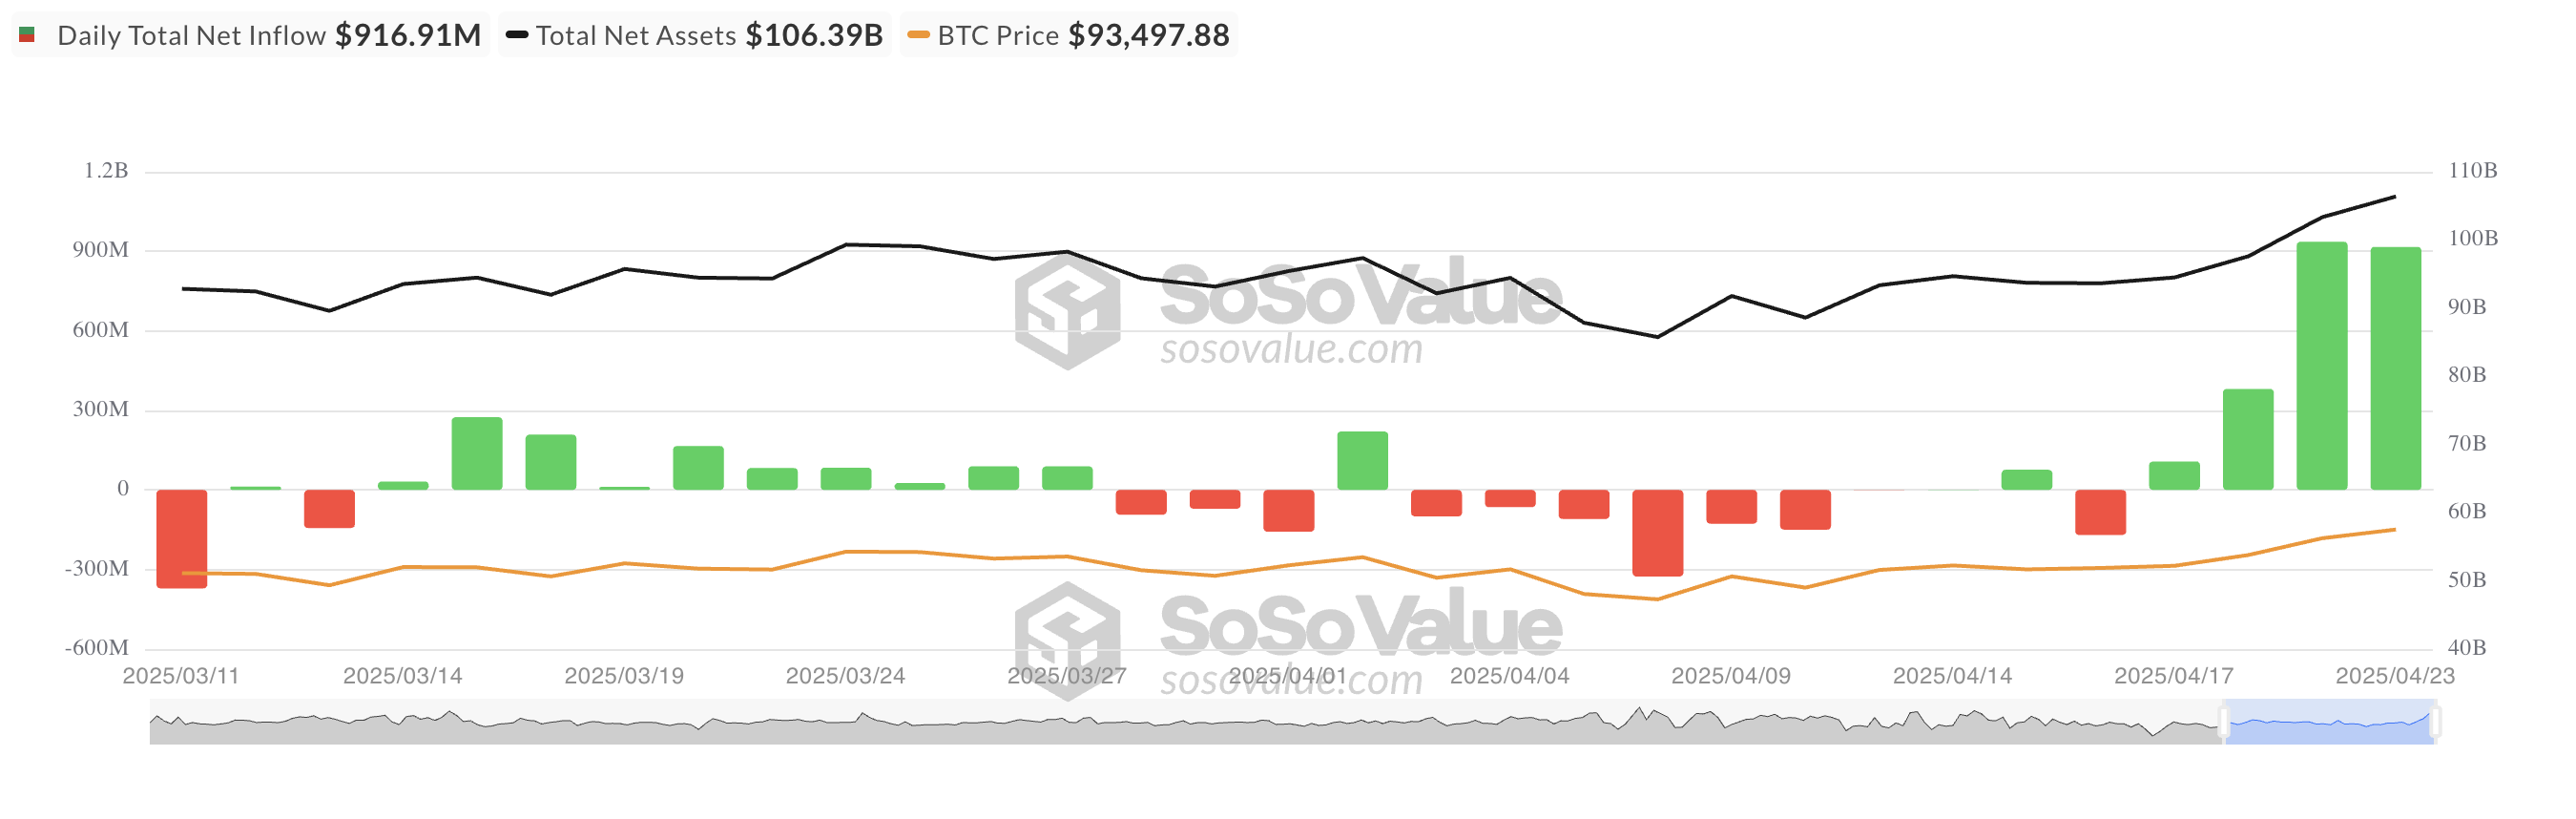
BTC spot ETFs continued to draw investor interest on Wednesday, extending their inflow streak with another $916.91 million in net inflows.
This marked the fourth consecutive day of inflows, highlighting the growing institutional appetite for BTC exposure, especially as the coin’s price attempts to stabilize above the $90,000 level.
Total Bitcoin Spot ETF Net Inflow. Source: SosoValue
On Wednesday, BlackRock’s ETF IBIT recorded the largest daily net inflow, totaling $643.16 million, bringing its total cumulative net inflows to $40.63 billion.
Ark Invest and 21Shares’ ETF ARKB followed in second place with a net inflow of $129.50 million. The ETF’s total historical net inflows now stand at $3 billion.
Traders Exit Bitcoin Positions as Market Sentiment Turns Cautious
Trading activity across the crypto market has dipped over the past 24 hours, with the total market capitalization shedding $18 billion during the period.
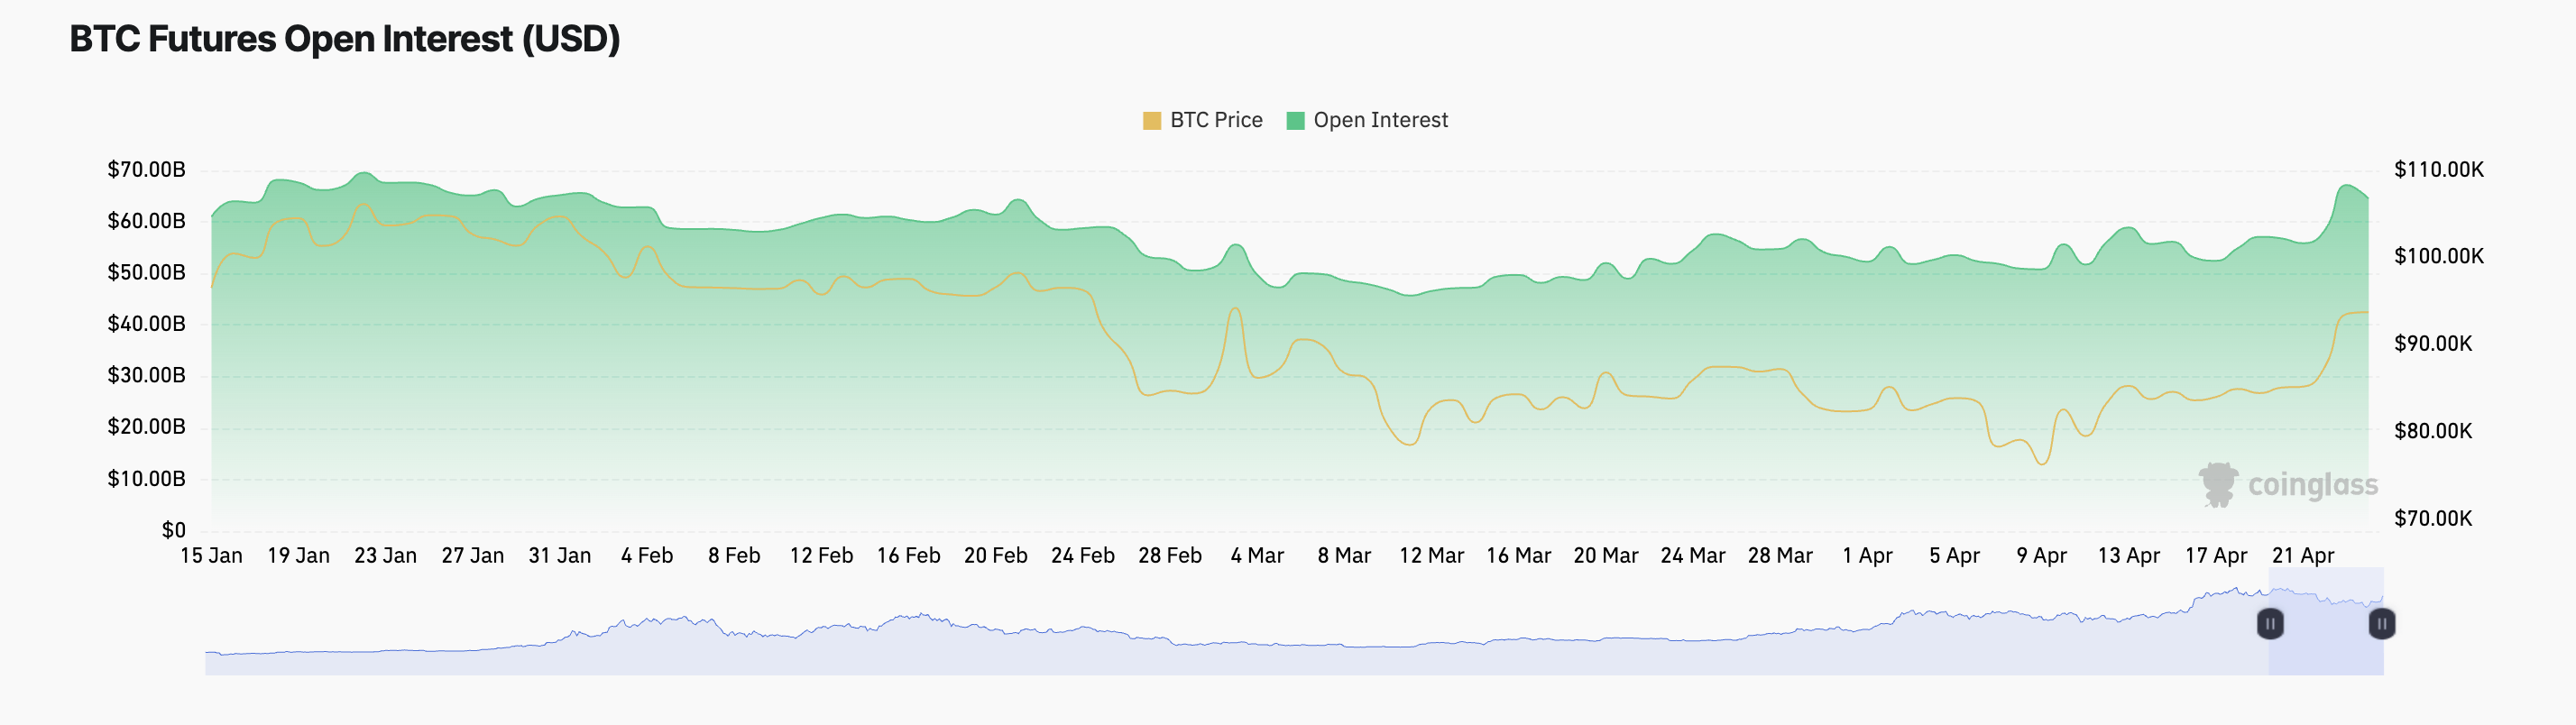
This pullback has contributed to a modest 1% decline in BTC’s price. The drop in momentum is evident in the coin’s falling futures open interest, which signals reduced trading participation. At press time, BTC’s futures open interest is at $64.54 billion, plunging by 5% in the past day.
When an asset’s price and open interest plummet like this, it signals that traders are closing out positions rather than opening new ones. This combination reflects weak conviction and a potential trend reversal or deeper correction in the BTC market.
Further, BTC’s funding rate has flipped negative once again, indicating that short traders have regained dominance and are now paying to maintain their positions. At press time, this is at -0.0053%.
When BTC’s funding rate is negative, short sellers are paying long holders to keep their positions open. This indicates that bearish sentiment dominates the market and suggests that traders expect the coin’s price to decline soon.
Moreover, today’s high demand for puts in the BTC options market supports this bearish outlook. According to Deribit, BTC’s put-to-call ratio is currently at 1.36.
This indicates that more put options are traded than calls, suggesting a bearish bias among options traders. The ratio reflects growing expectations of downward price movement.
Layer-1 (L1) coin IP has emerged as the market’s top gainer today, defying the broader crypto downturn to post a 4% increase in the last 24 hours.
However, despite the price surge, warning signs are flashing under the surface. On-chain activity remains muted, suggesting the rally may not be backed by strong fundamentals.
Traders Bet Against PI Despite Price Rise
While most cryptocurrencies traded lower on the day, PI has bucked the trend to record gains. However, the rally may not last long, with on-chain metrics signaling growing skepticism among traders.
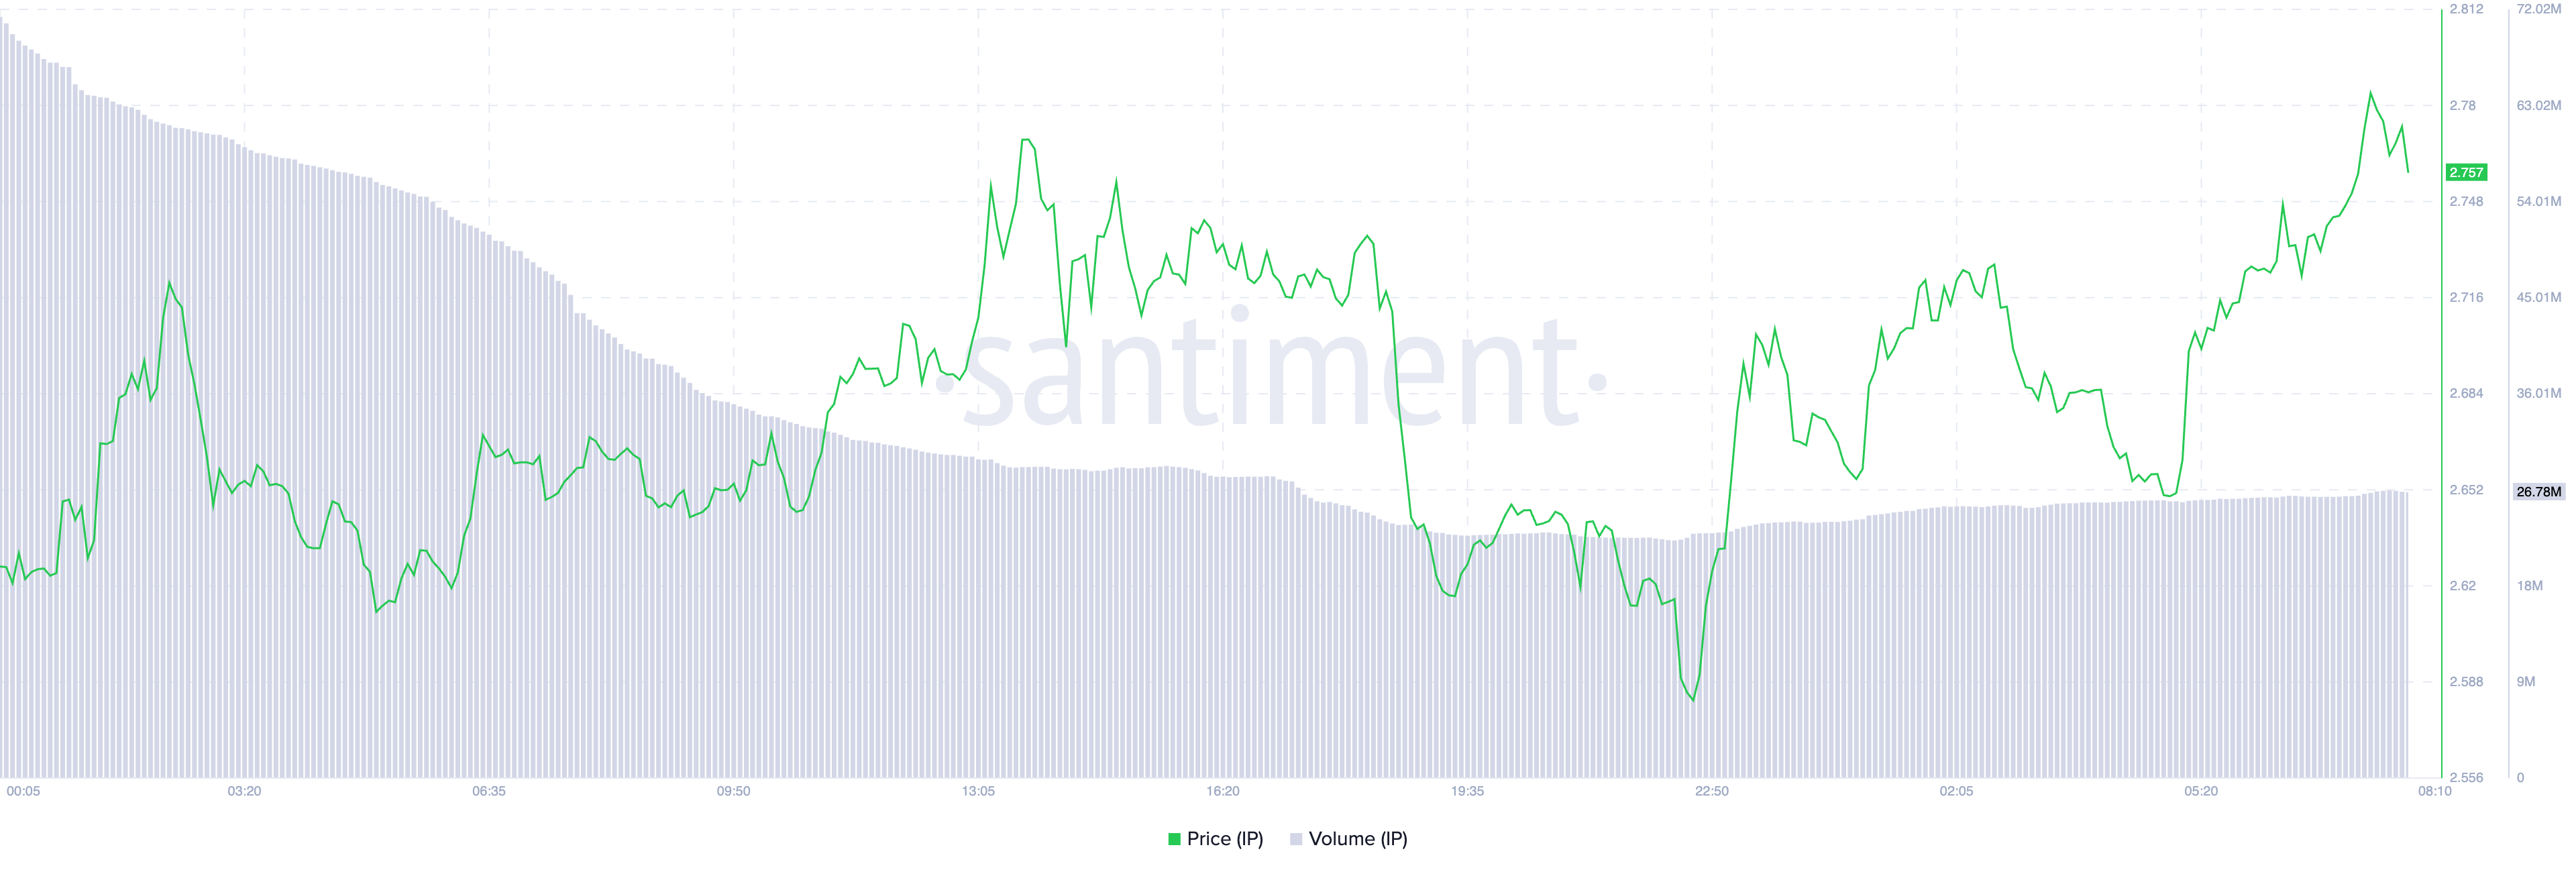
For example, amid its 4% rally over the past day, IP’s daily trading volume has dipped 38%, indicating that fewer participants support the upward price move.
When an asset’s price rises while its trading volume falls, it suggests that fewer participants are driving the price movement. This indicates weak buying momentum or a lack of broad market support behind the IP price rally.
Such conditions make the coin’s rally unsustainable, increasing the risk of a reversal or pullback.
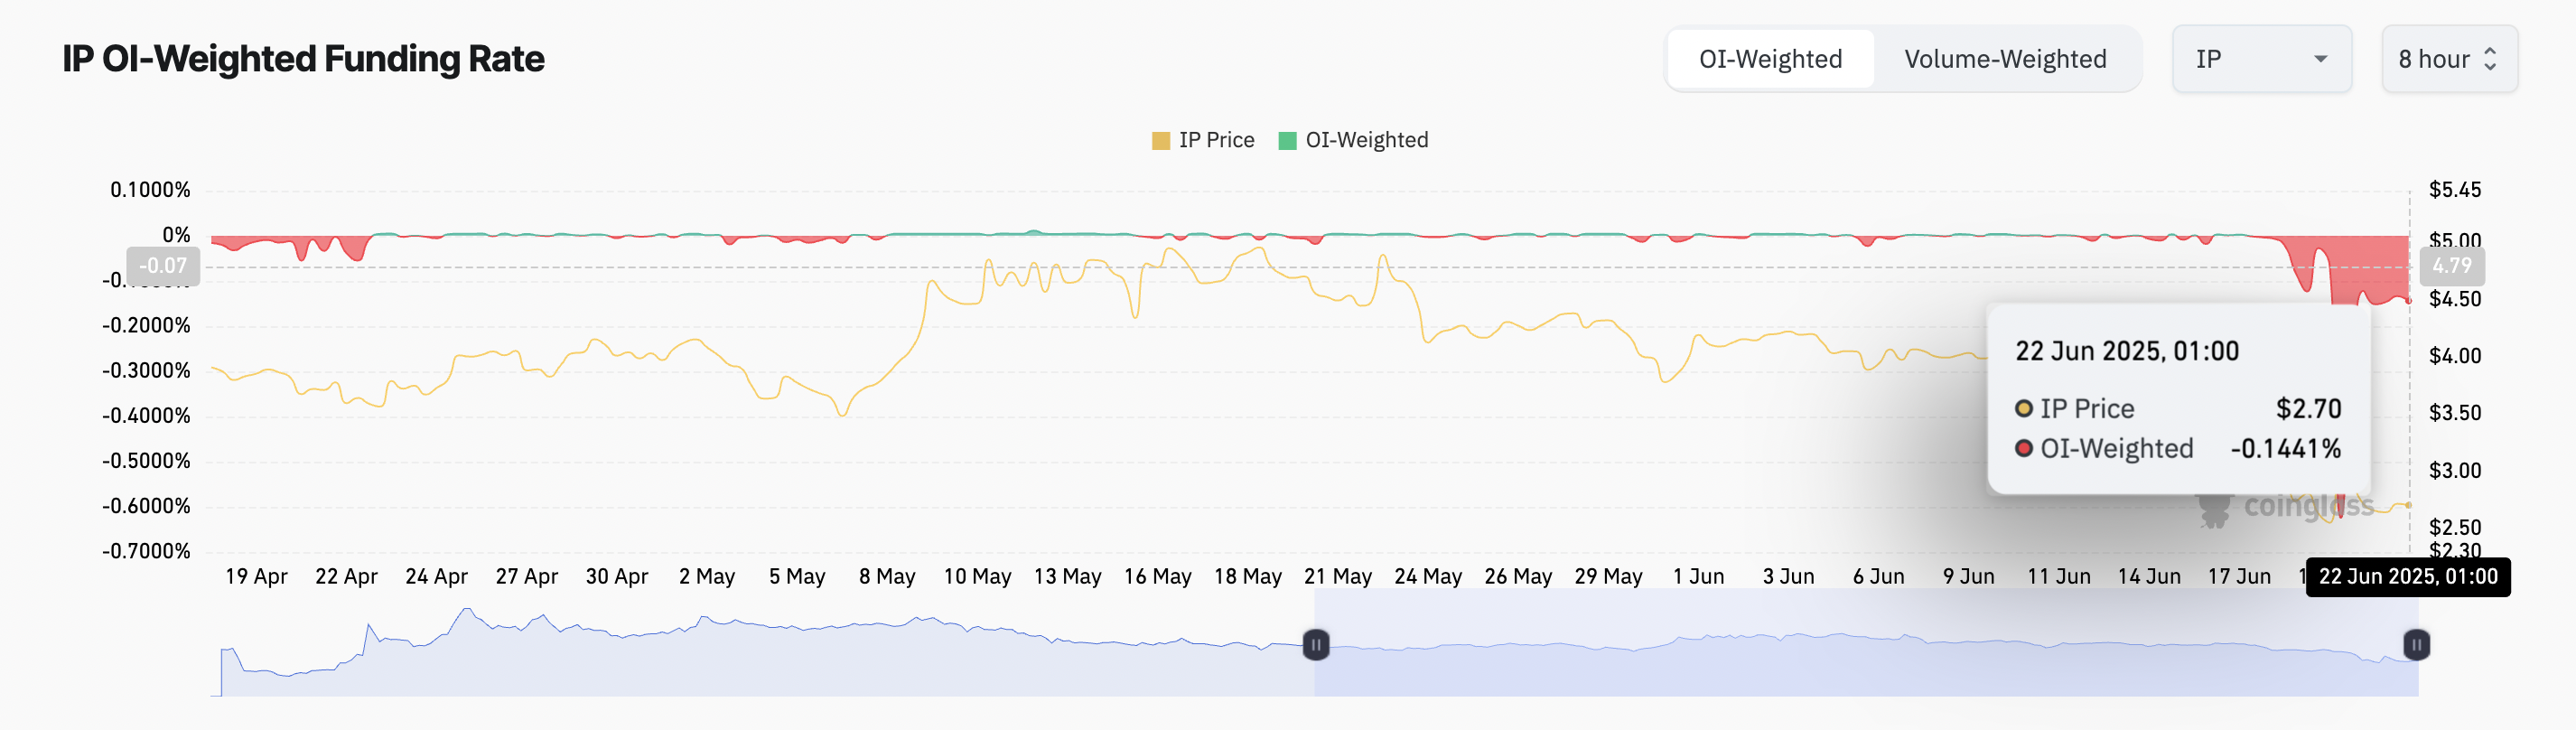
Furthermore, IP’s funding rate remains negative, reflecting that many traders in the futures market are taking short positions—betting that the price will fall. As of this writing, this stands at -0.14%.
The funding rate is a periodic fee paid between traders in perpetual futures markets to keep contract prices aligned with the spot price. When the funding rate is negative, short traders are paying long traders, indicating that the majority of the market is betting on a price decline.
In IP’s case, the negative funding rate indicates that many traders anticipate a reversal of its recent price rally. This reflects the persistent bearish pressure that has kept the coin’s performance subdued over the past several weeks.
Can IP Rebound? Token Eyes $3.17 If Demand Returns
As of this writing, IP trades at $2.75, hovering above a key support level at $1.59. If demand weakens, IP risks plunge below this floor and potentially fall under the $1 mark.
However, a resurgence in new demand for the altcoin could invalidate this bearish outlook. In that scenario, IP’s price may rebound toward $3.17. A successful break above that resistance could propel the IP token price toward the $4.41 level.