Bitmine now holds more than $2.9 billion in Ethereum (ETH), positioning itself as the world’s largest institutional ETH treasury.
The company reached this milestone after accumulating 833,137 ETH tokens. With this rapid acquisition, Bitmine signals its intent to lead in institutional Ethereum holdings.
According to its official disclosure, Bitmine aims to control up to 5% of ETH’s total supply. The firm relies on both aggressive accumulation and strategic partnerships for liquidity and custody to advance its position. This approach currently places Bitmine ahead of public company peers by industry data, though future rankings could change as new reporting emerges.
“BitMine moved with lightning speed in its pursuit of the ‘alchemy of 5%’ of ETH growing our ETH holdings to over 833,000 from zero 35 days ago. We have separated ourselves among crypto treasury peers by both the velocity of raising crypto NAV per share and by the high liquidity of our stock.”
Bitmine’s statement also outlines its intent to maximize staking yields and long-term ETH growth, in coordination with institutional partners to reinforce its market dominance.
Bitmine’s visible activity indeed sets a new bar for corporate crypto asset management. However, government-verified regulatory filings for these ETH reserves have not appeared in major databases.
XRP has been on a consistent downtrend in recent days, with its price falling sharply and approaching the $2 mark. This has resulted in extended losses for the cryptocurrency, with a notable rise in selling pressure.
Despite the bearish momentum, key investors are trying to offset the negative impact.
XRP Whales Are Uncertain
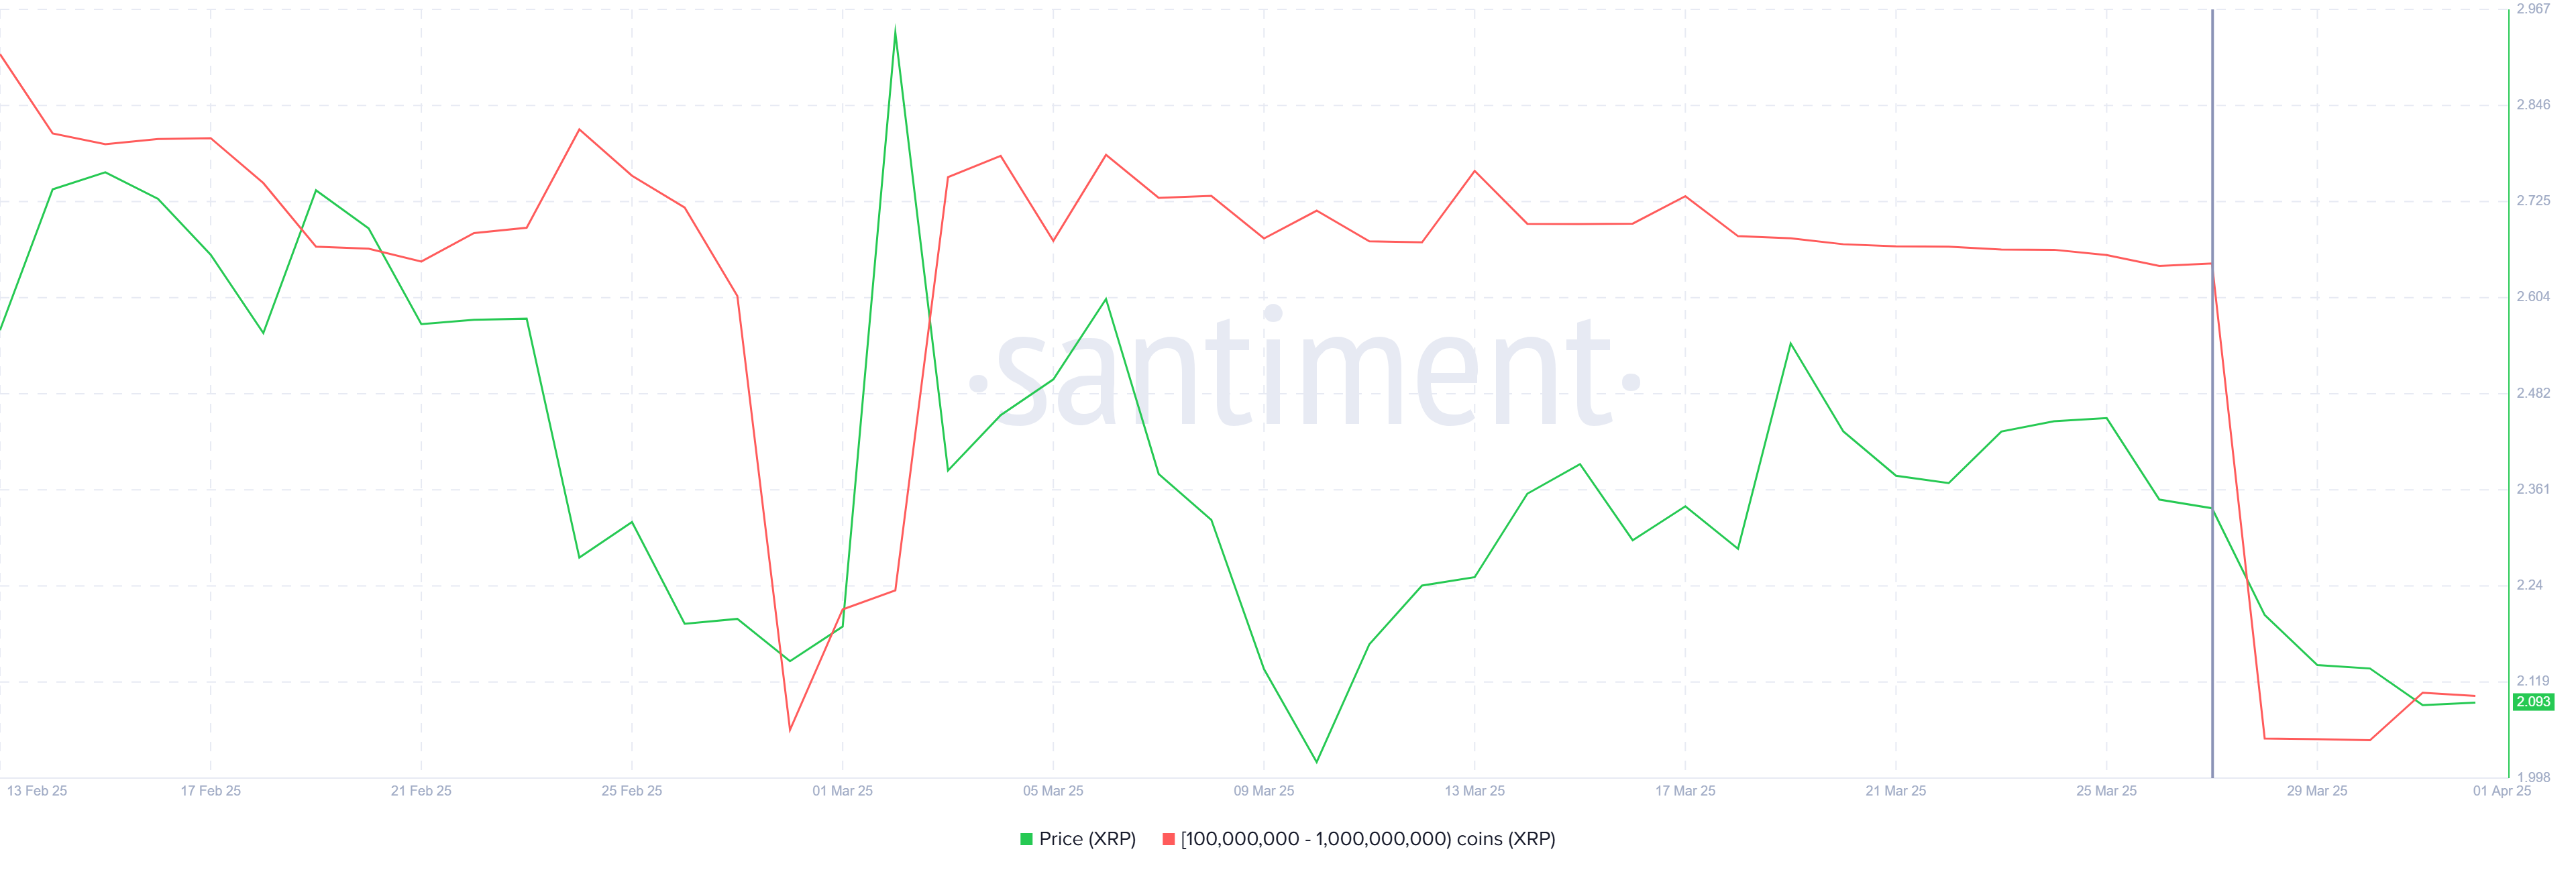
Whale activity has been a major factor contributing to the recent decline in XRP’s price. Addresses holding between 100 million and 1 billion XRP have sold over 1.12 billion XRP, worth $2.34 billion, in the past seven days. This has brought their total holdings down to 8.98 billion XRP.
The selling activity from these whale addresses reflects a cautious outlook for XRP. While whale selling often indicates uncertainty in the market, it’s important to note that their behavior can also have significant short-term price movements. The recent heavy selling could signal that market participants are unsure about the short-term price action, and further bearish trends could follow if this continues.
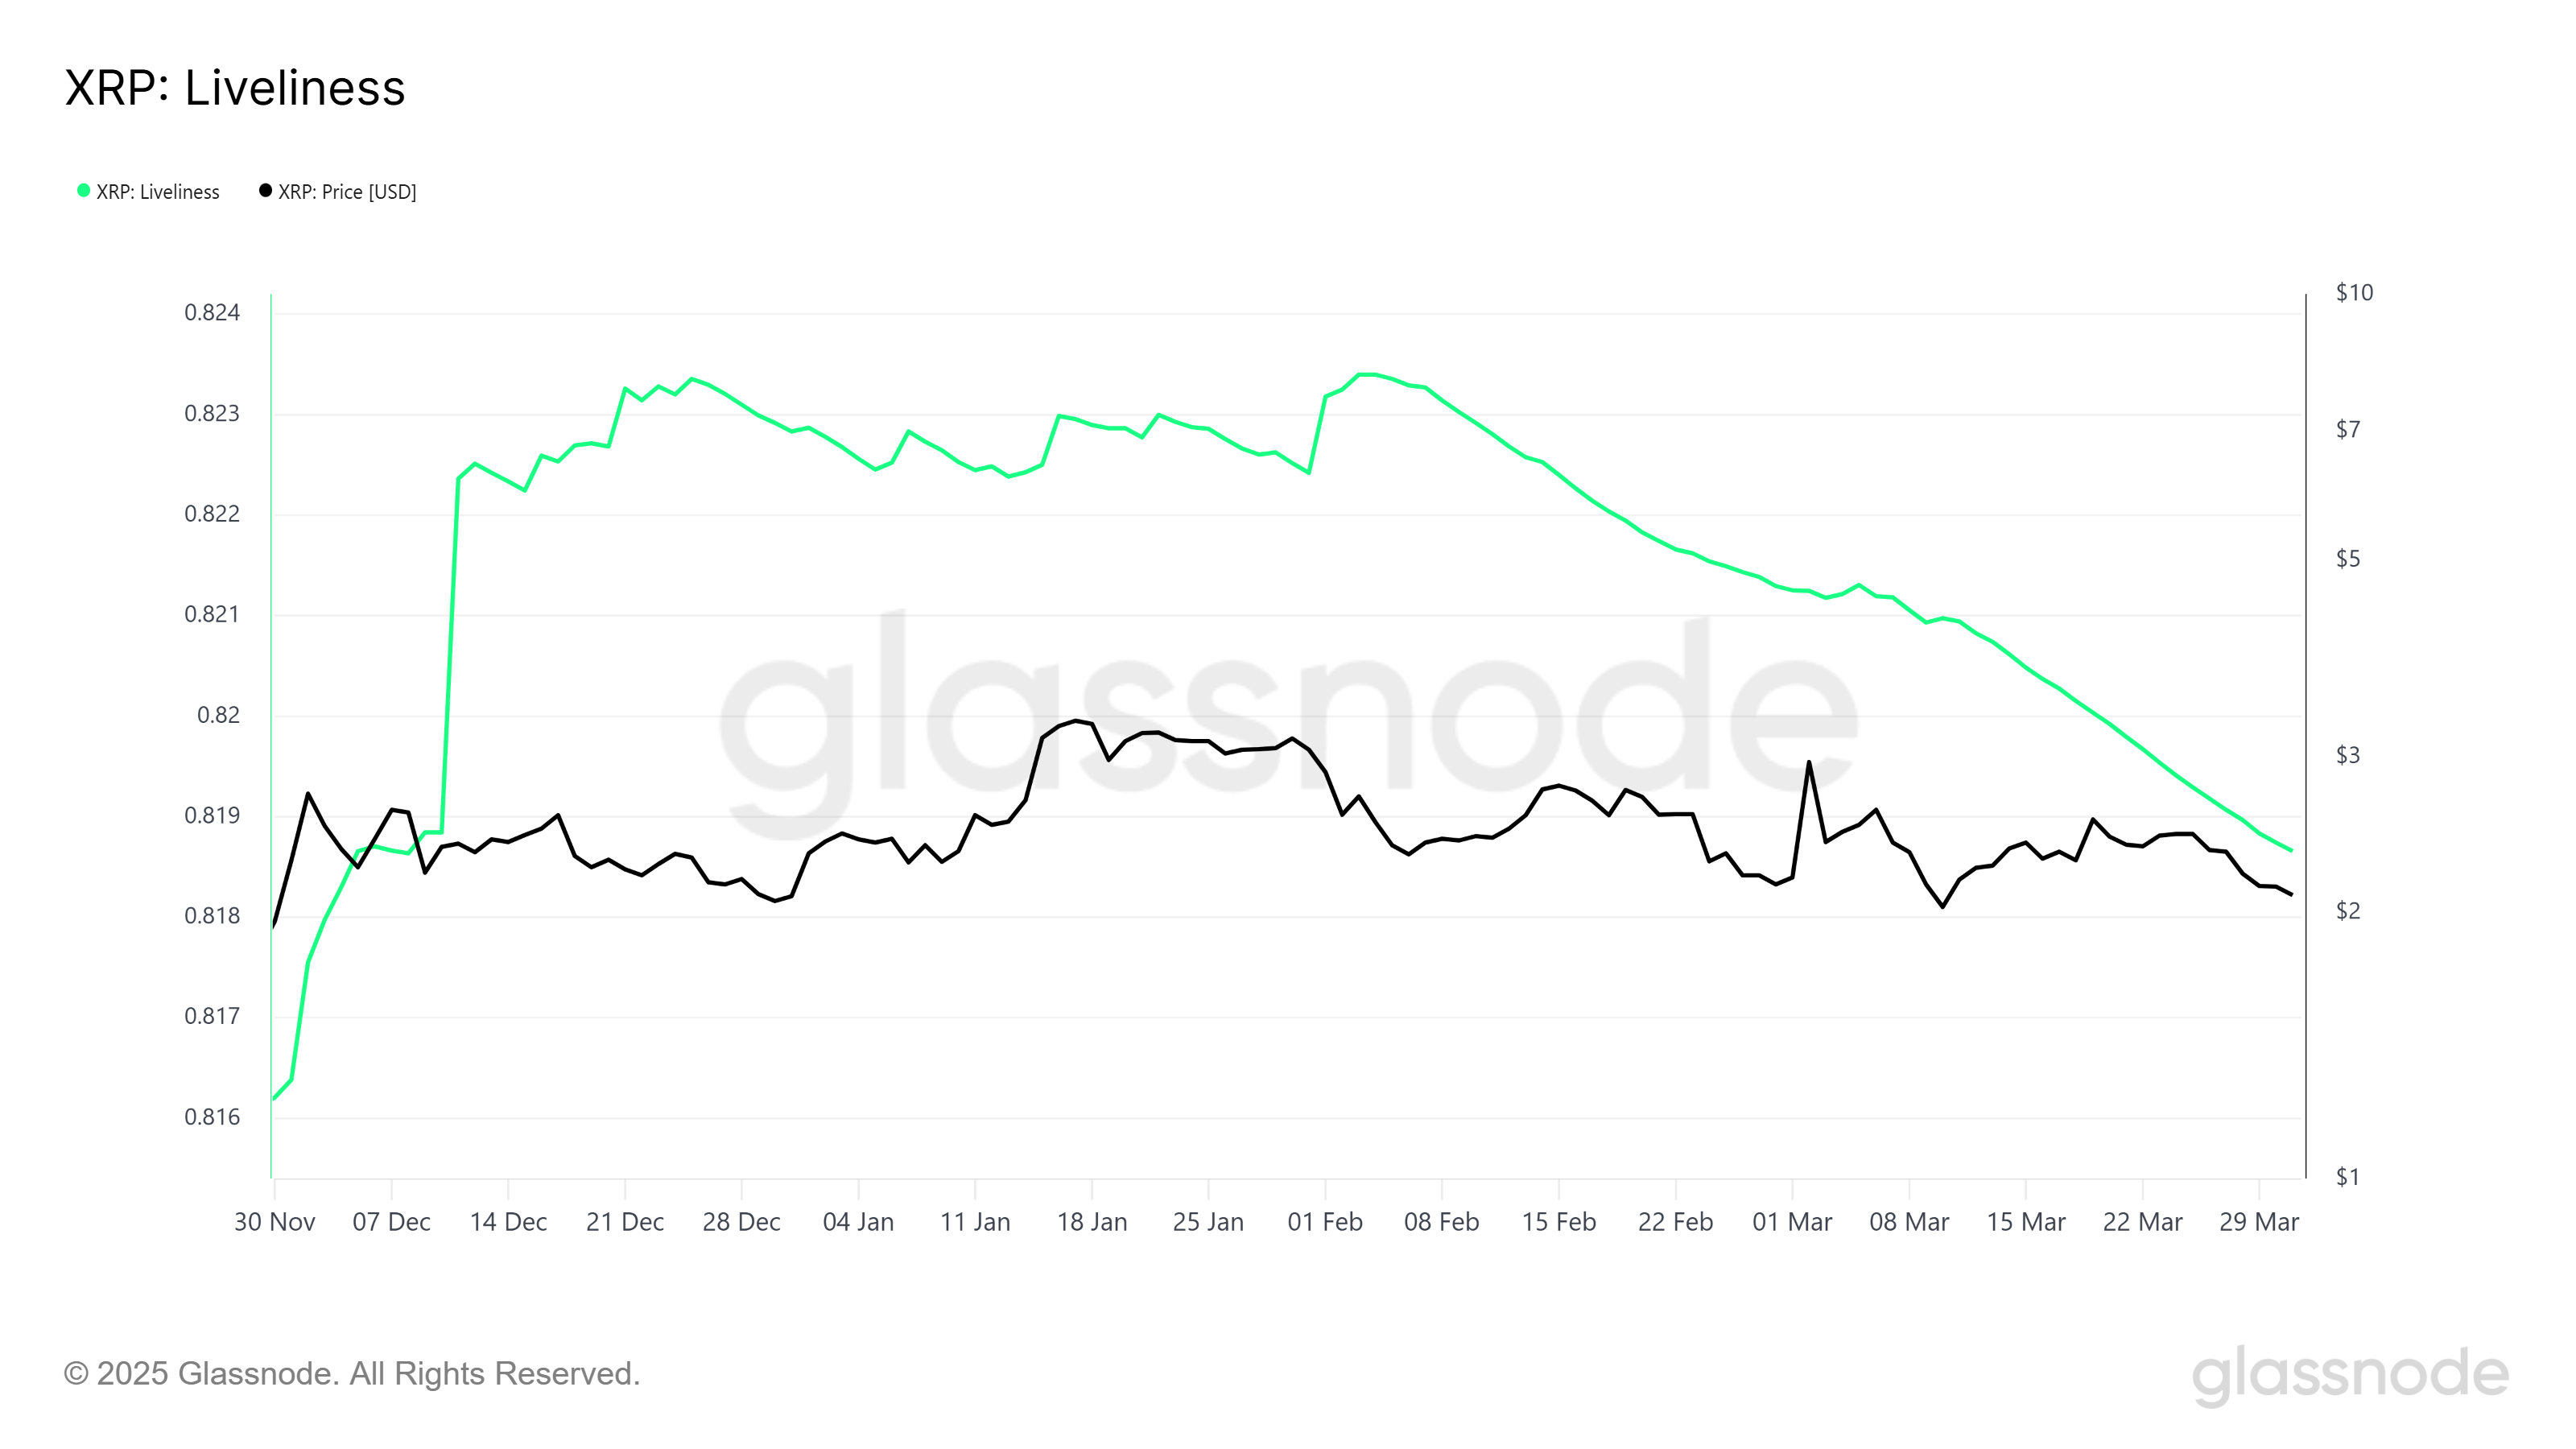
On the broader market level, XRP’s macro momentum shows signs of divergence from the whale selling. The Liveliness metric, which tracks the behavior of long-term holders (LTHs), is currently declining.
A falling Liveliness typically signals that LTHs are accumulating more of the asset at lower prices rather than selling. This drop to a three-month low suggests that long-term holders are sticking to their conviction and accumulating XRP, even as whale selling intensifies.
The steady accumulation of LTHs might help cushion the bearish effects created by the whales. This behavior can counteract the selling pressure, potentially offering stability to XRP’s price and supporting a recovery if market conditions improve.
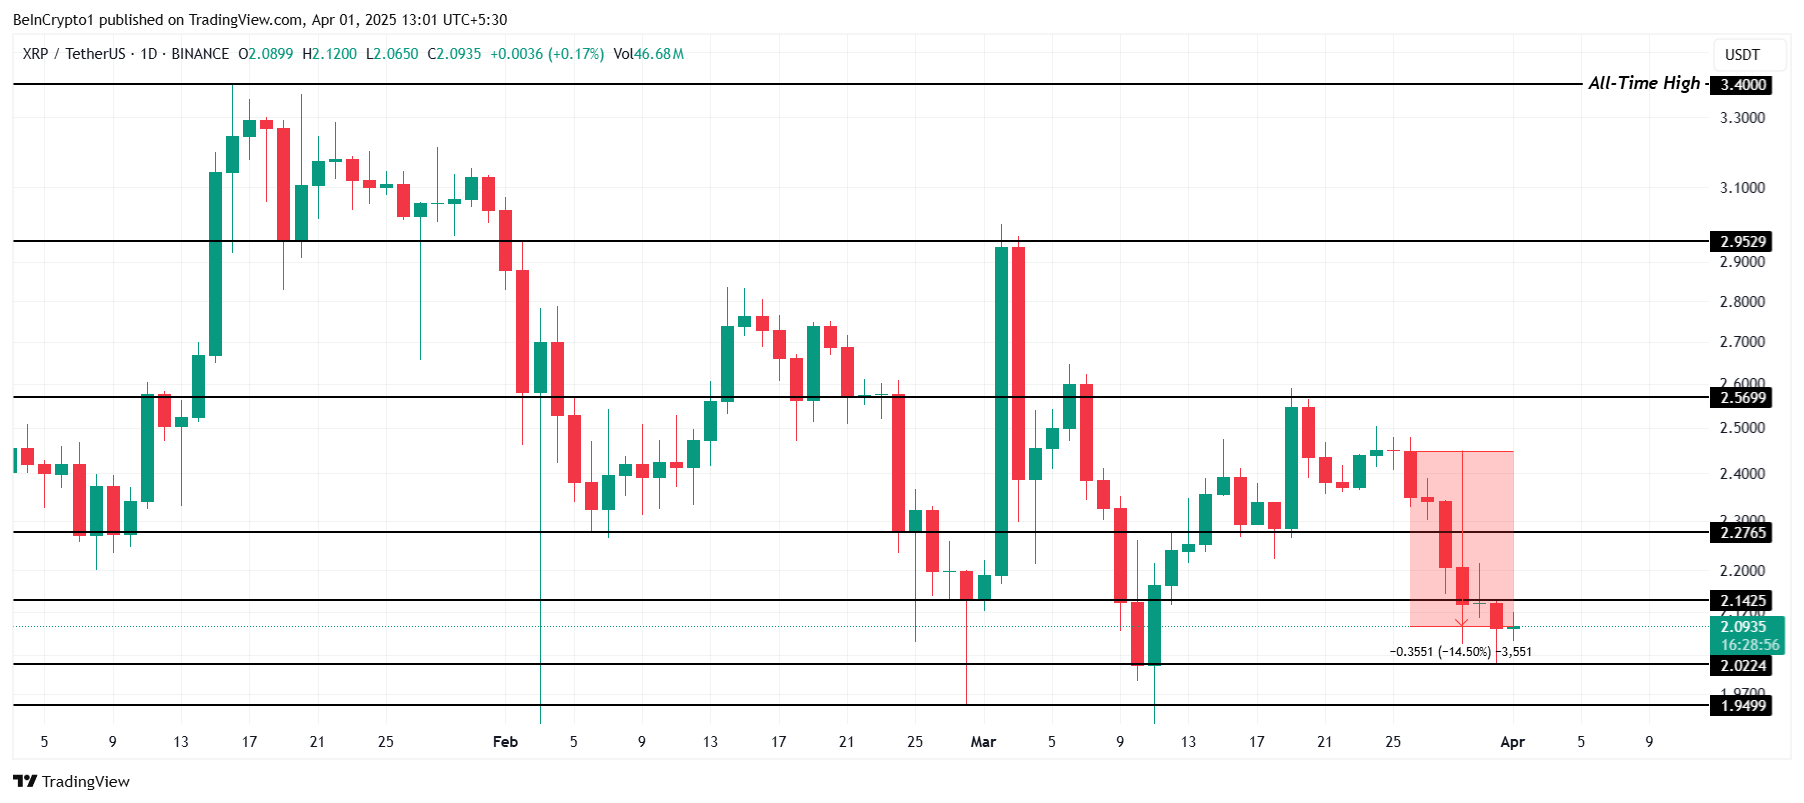
XRP’s price has fallen by 14.5% this week, bringing it to $2.09, which is dangerously close to losing the critical $2.02 support level. The ongoing bearish momentum has created mixed signals in the market, which are likely to keep the price stuck in a narrow range for the time being.
If XRP can bounce back from the $2.02 support, it could recover some of the recent losses. However, the altcoin may remain consolidated below the $2.27 resistance level unless more positive news or market conditions arise to push it higher.
If XRP breaks through the $2.27 barrier or falls below $2.02, it could invalidate the current consolidation outlook. A successful breach of $2.27 could pave the way for a price recovery, with $2.56 being the next significant target.
Welcome to the US Crypto News Morning Briefing—your essential rundown of the most important developments in crypto for the day ahead.
Grab a coffee and watch this space. Analysts say the next big move for Bitcoin (BTC) may be closer than it looks. With technical signals flashing and macro forces shifting, analysts are starting to lean bullish.
Crypto News of the Day: Bollinger Eyes Breakout as Macro Tailwinds Gather
Bitcoin is drawing renewed attention from analysts, with John Bollinger, the inventor of the Bollinger Bands indicator, sounding the alarm for a potential breakout.
Bitcoin looks to be setting up for an upside breakout. $BTCUSD More as the week gets going.
Bollinger’s post suggests technical momentum is building, with macro and political developments aligning with bullish setups.
Nic Puckrin, founder of The Coin Bureau, believes the US Senate’s passage of Trump’s $3.3 trillion Big Beautiful Bill has set the stage for long-term Bitcoin gains despite markets not reacting immediately.
“Trump’s ‘Big Beautiful Bill’ has passed in the US Senate, but has failed to immediately ignite a significant crypto rally…But while markets are still digesting its implications, the long-term impact is clearly nothing but positive for Bitcoin,” Puckrin told BeInCrypto.
According to Puckrin, the bill will add trillions to the US debt load, which, as BeInCrypto reported in a recent US Crypto News publication, positions Bitcoin as a life raft. Puckrin says this could accelerate the decline of the US dollar.
“A depreciating dollar creates the perfect environment for Bitcoin,” he added.
In a recent US Crypto News publication, BeInCrypto reported that the dollar index (DXY) posted a multi-year low. This came amid its worst start to a year since 1973, with interest rate cuts back on the table.
Puckrin sees the environment shifting decisively in Bitcoin’s favor, acknowledging that once the liquidity floodgates open, even $107,000 per BTC would feel like a deep discount.
Bitcoin Price Resistance Holds, But Market Eyes $110,500 Break
Despite the growing bullish sentiment, Bitcoin remains locked in a tight trading range between $107,000 and $110,000. The pioneer crypto faces immediate resistance at $109,500.
However, that move quickly lost steam as the market’s momentum remained muted. While Bitcoin’s long-term bullish setup is intact, spot demand continues to lag.
The pioneer crypto’s price action reflects this tension between strong fundamentals and macroeconomic uncertainty.
“Spot demand has been waning in recent times… weighing heavily on market sentiment…Bitcoin’s broader technical and bullish market position has remained structurally intact,” said Shawn Young, Chief Analyst at MEXC Research, in a statement to BeInCrypto.
The upcoming US tariff deadline and the colloquial “Crypto Week” in Congress, where digital asset bills are set for debate, could inject volatility and act as breakout triggers.
According to MEXC, a clean move above $110,500, backed by volume, would “validate the bullish setup and pave the way for a potential push to make new highs.
If macro conditions align, the analyst predicts a play to $125,000 in Q3 for Bitcoin and even $140,000 by year-end. This is modest compared to what Standard Chartered predicted in a previous US Crypto News publication.
“These developments [Bitcoin ETF flows, corporate treasury buying, a potential announcement by President Trump of Fed Chair Powell’s early replacement, and passage of the US stablecoin bill] along with further evidence of broader sovereign interest, should push Bitcoin to a new all-time high of around $135,000 in and $200,000 in Q4,” Standard Chartered Head of Digital Assets Research Geoff Kendrick said in a statement to BeInCrypto.
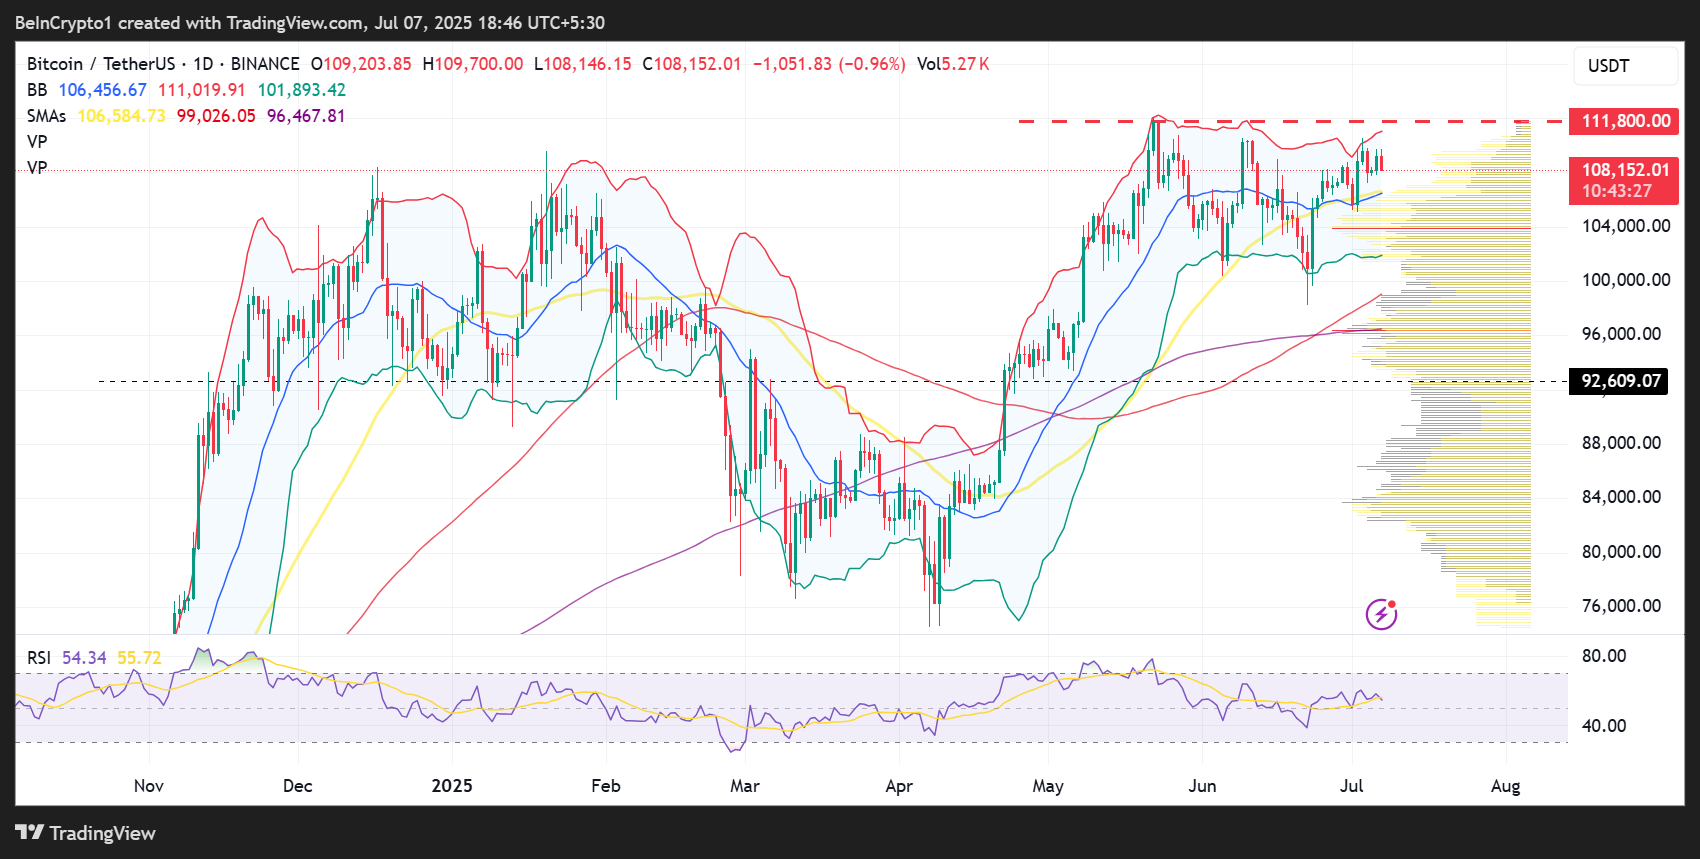
Chart of the Day
The chart below shows the BTC/USDT trading pair in the one-day timeframe. With Bitcoin between the middle and upper Bollinger band ($111,019), this indicates a potential continuation of an uptrend.
A break above the upper band could see Bitcoin test the $111,800 all-time high (ATH), potentially establishing a new peak.
Technical indicators align with the 50-day Simple Moving Average (SMA), providing initial support at $106,584 (yellow strand).
Meanwhile, the volume profile (yellow bars on the side) suggests significant bullish momentum, with traders waiting to interact with the BTC price upon any drop, potentially as low as $100,000.
The Relative Strength Index (RSI) at 54.34 adds credence to the bullish thesis, showing more room for the upside before BTC is considered overbought.
Conversely, if Bitcoin drops below the midline of the Bollinger band ($106,456), it would signal a trend reversal, with a breakdown below the lower band ($101,893) likely exacerbating the downtrend.
However, BTC must drop below the 100-day SMA at $99,026 to confirm a trend reversal from the prevailing uptrend.
Byte-Sized Alpha
Here’s a summary of more US crypto news to follow today: