Crypto cash rotation from Bitcoin to the altcoin market by institutional investors has triggered bullish sentiment for most altcoins.
The TOTAL3 has rebounded from a crucial support level amid the altseason reckoning.
As Bitcoin (BTC) price attempts to rally beyond $105k, following the recent rebound catalyzed by the macroeconomic crisis and rising demand from institutional investors, the altcoin industry has signaled bullish sentiment. For the first time since U.S. President Donald Trump took office earlier this year, Ethereum (ETH) price teased above $2.7k.
The fear of further crypto correction has significantly diminished as shown by the notable rise in Ethereum’s fear and greed index above 70 percent. Furthermore, the total crypto market cap surged to nearly $3.5 trillion in tandem with the ongoing major stock index recovery.
Closer Look at Altseason 2025
For the past two years, Bitcoin price rally dominated the cryptocurrency market, mostly catalyzed by the rising demand from institutional investors led by U.S. spot BTC ETF issuers and Strategy Inc. However, a notable shift in Bitcoin dominance – down 5 percent in the past seven days to 62 percent at the time of this writing – has hinted at a potential start of the altseason 2025.
i) TOTAL3 [1W] bouncing strongly from the Cup and Handle’s neck line.
According to a popular crypto analyst Gert van Lagen, the recent drop in Bitcoin dominance has coincided with a notable surge in TOTAL3, which excludes Ethereum’s market cap. From a technical analysis standpoint, Lagen highlighted that the TOTAL3 will likely experience a parabolic rally beyond $5 trillion in the coming months following a successful bounce from a cup and handle pattern.
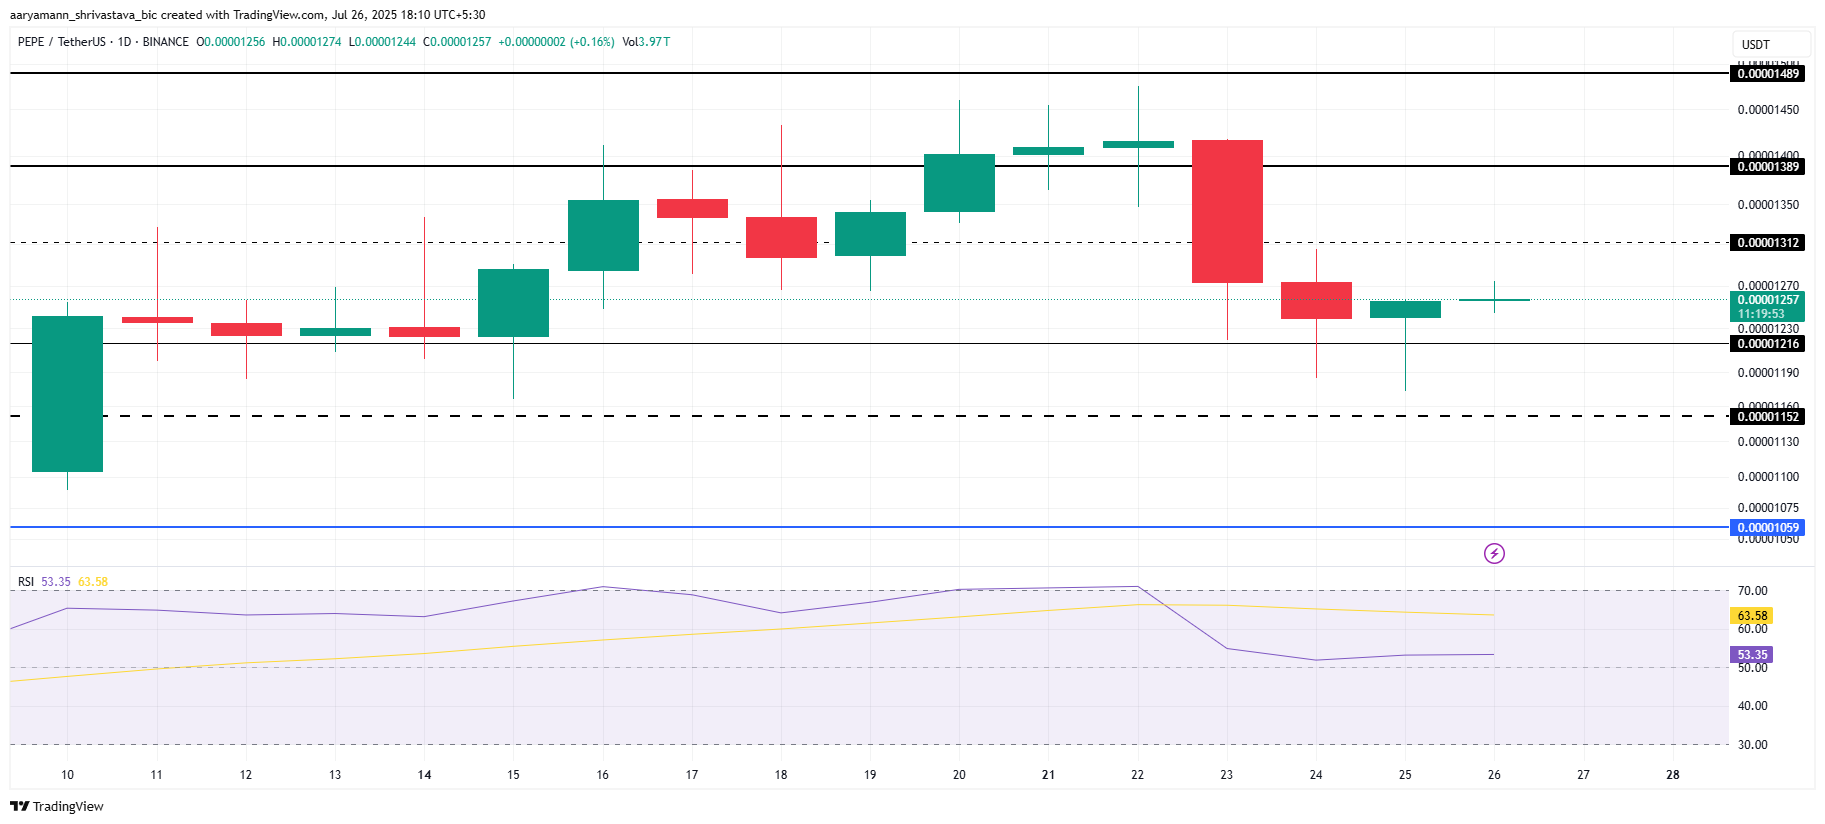
The altcoin 2025 hype is evident from the notable memecoin FOMO, led by PEPE, Moo Deng, Floki, Dogecoin, and Neiro, among many others. With the notable improvement in crypto regulations in the United States among other nations, a major altseason is brewing before the end of 2025.
Dogecoin price is poised for a potential breakout after forming a rare diamond bottom pattern on the daily chart. According to technical analyst Trader Tardigrade, the DOGE price structure shows a bullish reversal setup that could send the DOGE price over 105% higher to $0.35.
This bullish forecast comes despite Dogecoin price falling 1.5% in the last day and 3% in the last week. However, in the last 30 days, bulls have had the upper hand with DOGE price soaring 15%.
Dogecoin Price Diamond Bottom Pattern Hints at Rally
Trader Tardigrade has identified a diamond bottom pattern on the daily DOGE/USD chart. This pattern typically signals a bullish reversal when it forms after a sustained downtrend. According to the chart, the breakout level is around $0.165–$0.17.
This projection places the DOGE price target between $0.255 and $0.35. The chart also shows a dotted green arrow pointing toward the $0.35 level, suggesting a more optimistic scenario for a breakout extension.
Ali Charts, another crypto analyst, noted that Dogecoin price is testing support at $0.167. He stated, “Holding this level could spark a rebound toward $0.175 and potentially $0.183.” Both analysts agree that maintaining the $0.165–$0.167 zone is critical for bullish momentum to continue.
The Price Momentum Oscillator (PMO) also confirms a bullish crossover, which may support further gains if buying volume increases. These indicators support the case for a possible rally if current support holds.
DOGE ETF Approval May Accelerate Dogecoin Price
DOGE ETF speculation is rising in the market as several asset managers have applied for approval. These include Bitwise, 21Shares, Grayscale, and REX Shares. They are awaiting clearance from the U.S. Securities and Exchange Commission (SEC) to launch Dogecoin ETFs. According to Polymarket, DOGE ETF approval odds have risen by 25%, with analysts giving a 63% chance that it may be approved by the end of 2025.
According to a CoinGape report, if Dogecoin receives 30% to 50% of Bitcoin ETF inflows, the price could rise to between $0.34 and $0.50. This scenario is based on an estimated $12 to $20 billion entering DOGE markets. The forecast also projects that DOGE’s total market capitalization could more than double under this model.
ETF approval, in the same vein, would likely pull more institutional investors to its side hence increasing the demand even further. This potential flow of capital corresponds to the $0.35 level depicted in the technical indication. According to analysts, the approval news can be considered as a potential trigger for the price rally and take DOGE past the $0.255 barrier.
Holding Behavior Shows Investor Confidence
New data from IntoTheBlock suggests that investor sentiment for Dogecoin is improving. The average holding time of transacted DOGE coins has increased by over 526% in the last 90 days. This behavior is similar to the trend seen before Dogecoin’s 2021 bull run.
Source: IntoTheBlock
In just the past seven days, holding time has risen by four months. This shift from short-term speculation to long-term holding reduces sell pressure. It also suggests that investors expect the DOGE price to rise soon. If this trend continues, it could support a more stable base for further growth.
Long-term holders now dominate the transaction volume, which often happens before strong upward price moves. Reduced market supply, combined with growing demand, is a positive signal.
Welcome to the US Morning Crypto News Briefing—your essential rundown of the most important developments in crypto for the day ahead.
Grab a coffee to see how Bitcoin (BTC) is faring against public companies, precious metals, and ETFs (exchange-traded funds) on metrics of total assets by market capitalization. The pioneer crypto is proving formidable, taking the stage as a tech stock proxy to ‘dynamic hedge’ against equities and US Treasury risk.
Bitcoin Surpassed Google in Market Cap
Amidst renewed optimism, Bitcoin has surpassed Google, effectively joining the top five assets on market cap metrics.
According to data on companiesmarketcap.com, which tracks over 10,436 firms, Bitcoin is now the fifth most valuable asset after GOLD, Apple (AAPL), Microsoft (MSFT), and Nvidia (NVDA). As of this writing, it boasts a market cap of $1.86 trillion.
This growth comes as Bitcoin progressively gains attention as a hedge against traditional finance (TradFi) and US Treasury risk, which aligns with the most recent US Crypto News publication. As BeInCrypto reported, experts say Bitcoin’s number one purpose in a portfolio is to hedge against risks to the existing financial system.
In contrast, Gold is losing appeal after recently establishing a new all-time high (ATH). While President Trump’s tariffs catapulted Gold to new heights, there appears to be a capital rotation as investors’ appetite for risk grows.
“Bitcoin has surged past the prior $88,800 technical ceiling, clearing the psychological $90,000 mark to trade at an eye-watering $93,500. Meanwhile, Gold has slid 6 percent, reflecting a renewed appetite for risk and a clear rotation into digital assets,” QCP Capital analysts said.
According to analysts, institutions are no longer testing the waters of crypto. Instead, they are diving in headfirst. Based on this outlook, BeInCrypto contacted Standard Chartered Head of Digital Assets Research Geoff Kendrick, who forecasted a new ATH for Bitcoin price.
Standard Chartered Reiterates Next Bitcoin ATH
According to Kendrick, the increasing 10-year US Treasury term premium, now at a 12-year high, correlates with an increase in Bitcoin price. The term premium is the additional yield investors demand to hold a long-term bond instead of a series of shorter-term bonds.
“While correlations vary over time, the relationship between Bitcoin and the term premium is pretty solid, especially since the start of 2024. This relationship shows that Bitcoin has lagged the term premium increase in recent weeks,” Kendrick told BeInCrypto.
According to the analyst, this lag likely reflects the previous narrative that tariffs are hurting tech stocks and Bitcoin trading, such as Mag7 stocks.
“This could be what is needed for the next all-time high, and on that, I reiterate my current forecasts for Bitcoin, of 200k end-2025 and 500k end-2028,” he added.
As Bitcoin acts as a dynamic hedge, it remains to be seen whether it can flip Nvidia this quarter. Nevertheless, Kendrick does not rule it out, acknowledging that dominant narratives change and Bitcoin serves several purposes in portfolios.
The price of XRP has been moving sideways without any clear direction for the past few days, and today’s analysis focuses on the shorter time frame since the bigger picture hasn’t changed much. At the time of writing, XRP is trading at $2.18 and is up by more than 1%.
According to analysts, XRP has made a small move to the upside, but it’s not yet strong enough to confirm a solid uptrend. The recent increase looks like a three-wave pattern, which could either be the start of something bigger or just another temporary bounce.
Here’s what’s happening:
The B-wave correction might not be over yet. Today, we saw some downward movement, and it’s possible that XRP could revisit last week’s lows around $2.02–$2.03.
If this happens, the price might see a five-wave decline forming, with possible support around $1.90–$2. But it’s important to understand this is a very short-term, small market structure and nothing major for now.
On the other hand, if XRP has already completed its B-wave correction and started a new C-wave upwards, it could target the $2.55–$2.68 zone. However, there’s not much clear evidence to confirm this yet — both the recent moves up and down have been choppy, making it difficult to predict the next big move.
Since mid-April, XRP’s price action has been messy and directionless, mostly moving sideways. While there’s still a chance for higher prices, traders should watch for key support levels:
$1.82 is an important support area. As long as XRP stays above this, there’s room for a recovery.
If XRP falls below $1.82, it would signal that the current attempt to move higher is failing, and it might see a drop towards the $1.33 level next.
The post XRP Price Analysis: Breakout or Breakdown Ahead? appeared first on Coinpedia Fintech News
The price of XRP has been moving sideways without any clear direction for the past few days, and today’s analysis focuses on the shorter time frame since the bigger picture hasn’t changed much. At the time of writing, XRP is trading at $2.18 and is up by more than 1%. According to analysts, XRP has …