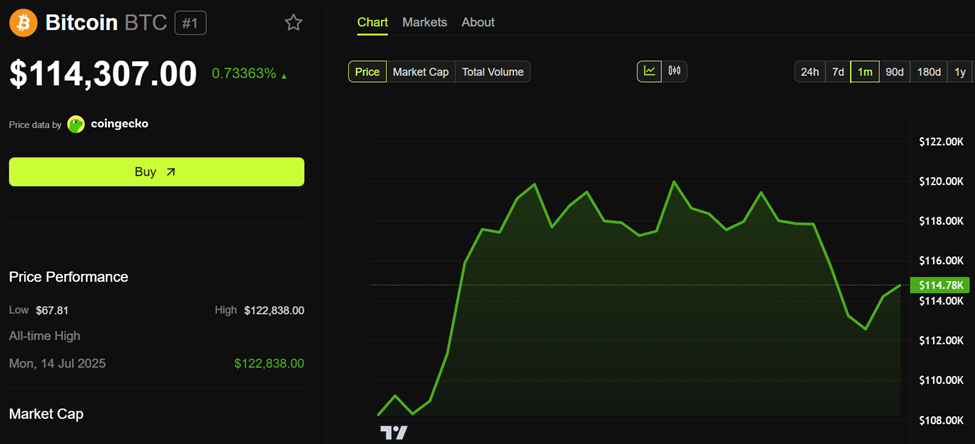
The crypto market and broader economy are moving fast as global liquidity reached an all-time high in April 2025. Gold has already broken past $3,200, setting a new record. Meanwhile, Bitcoin is still 30% below its previous peak.
Amid this backdrop, analysts are taking a closer look at the link between Bitcoin and gold. Fresh data also shows strong corporate demand for Bitcoin, with record levels of buying in Q1 2025.
What Bitcoin’s Ties to Gold and Liquidity Signal for Its Price
According to Joe Consorti, Head of Growth at Theya, Bitcoin tends to follow gold’s lead with a lag of about 100 to 150 days. A chart shared by Consorti on X, based on Bloomberg data, illustrates this trend from 2019 to April 14, 2025.
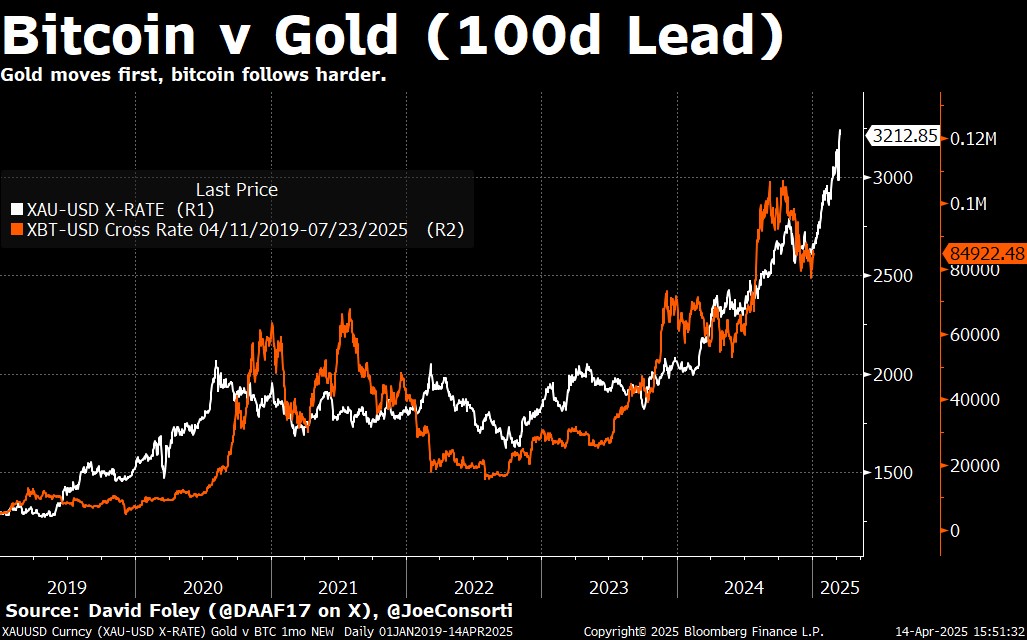
The chart shows gold (XAU/USD) in white and Bitcoin (XBT/USD) in orange. The data reveals that gold usually moves first during upswings, but Bitcoin often rallies harder afterward—especially when global liquidity is rising.
“When the printer roars to life, gold sniffs it out first, then Bitcoin follows harder,” Consorti said.
That 100-to-150-day lag is notable. It suggests Bitcoin could be set for a sharp move higher within the next 3 to 4 months. The recent surge in global liquidity also supports this view.
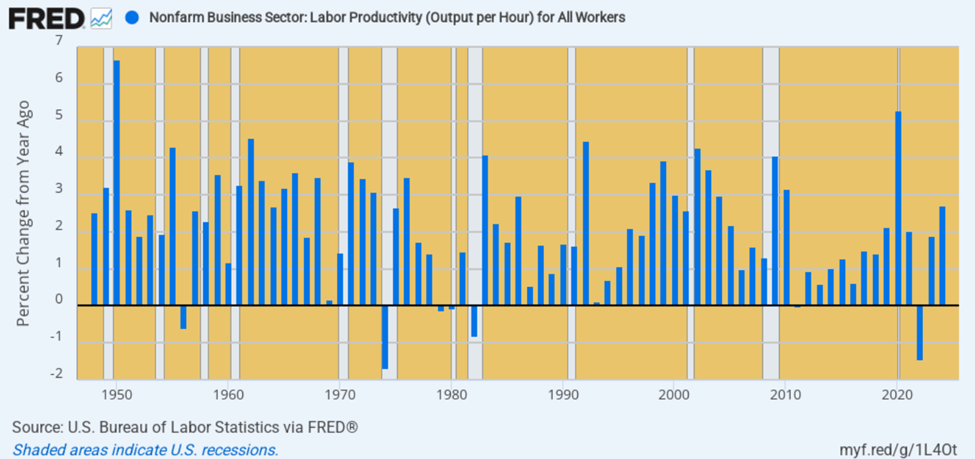
According to analyst Root, M2 money supply from major central banks—including the US Federal Reserve, European Central Bank (ECB), People’s Bank of China (PBoC), Bank of Japan (BoJ), Bank of England (BoE), Reserve Bank of Australia (RBA), Bank of Canada (BoC), and others—has hit a record high as of April 2025.
The sharp rise points to more cash flowing through the global economy.
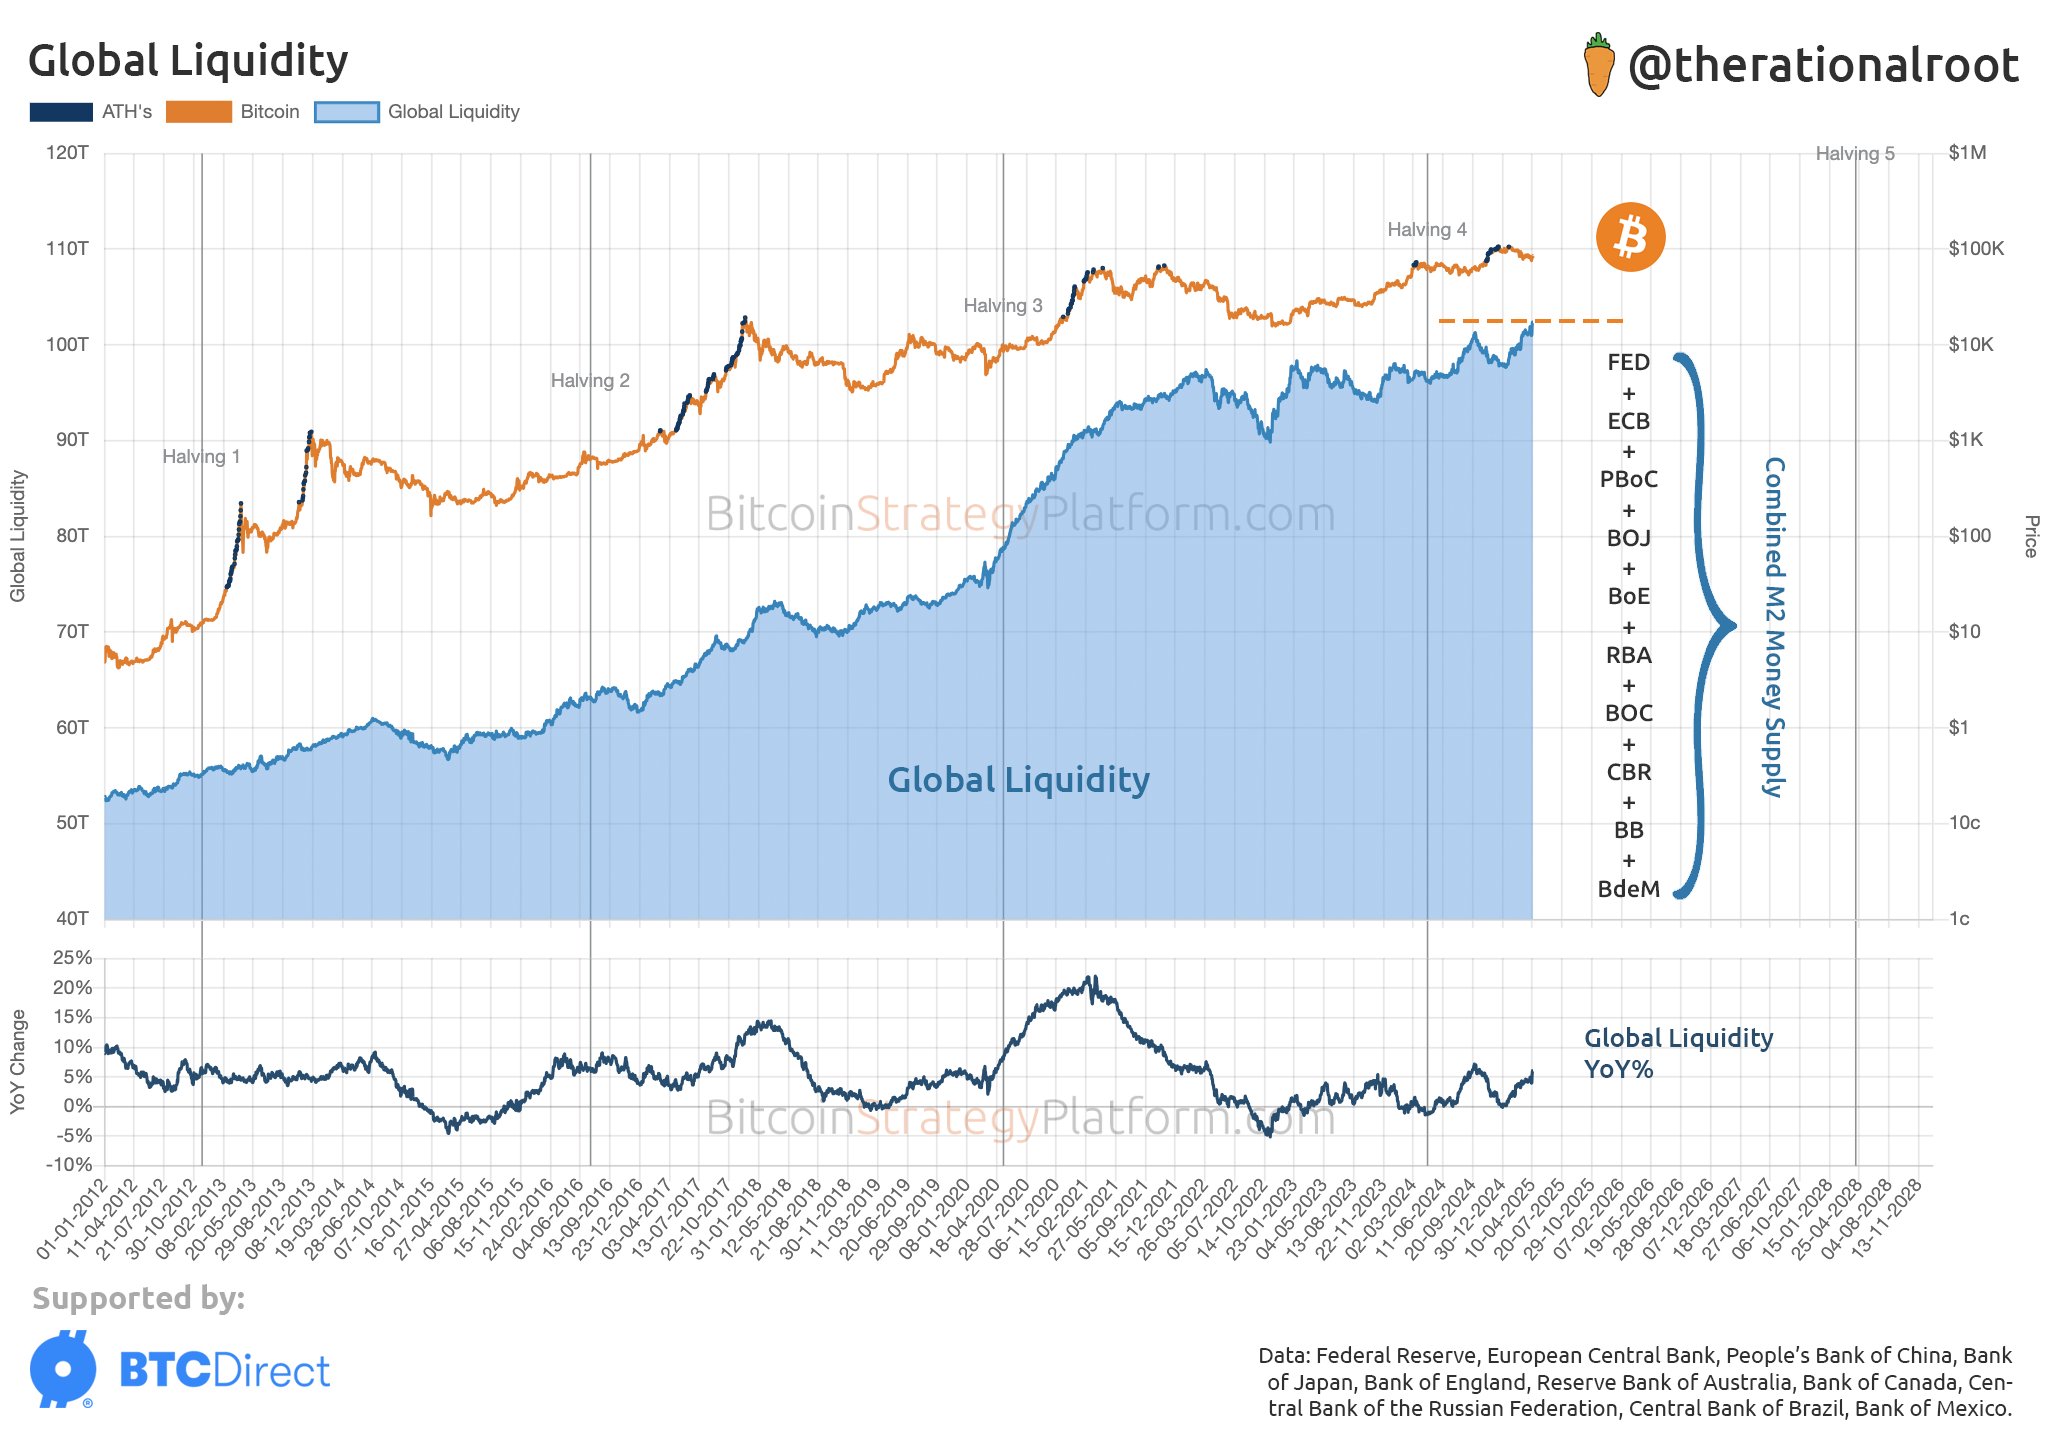
Historically, Bitcoin bull markets have often lined up with major increases in global liquidity, as more money in the system tends to push investors toward riskier assets like Bitcoin.
Why Bitcoin Might Outperform Gold and Stocks
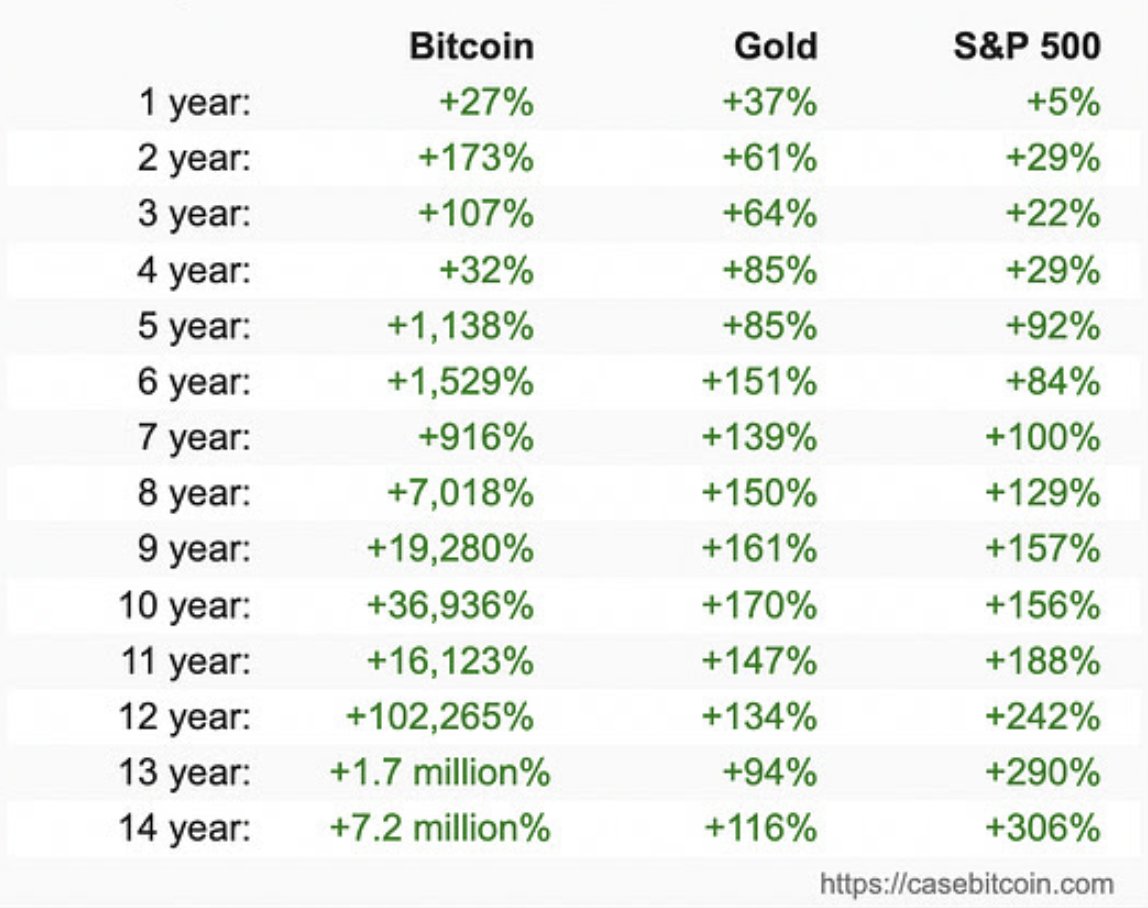
Matt Hougan, Chief Investment Officer at Bitwise Invest, states that Bitcoin is not just outperforming gold but is also surpassing the S&P 500 in the long run. This indicates that Bitcoin is becoming a stronger investment option despite its price volatility.
Data also supports this. A recent Bitwise report shows corporations bought over 95,400 BTC in Q1—about 0.5% of all Bitcoin in circulation. That makes it the largest quarter for corporate accumulation on record.
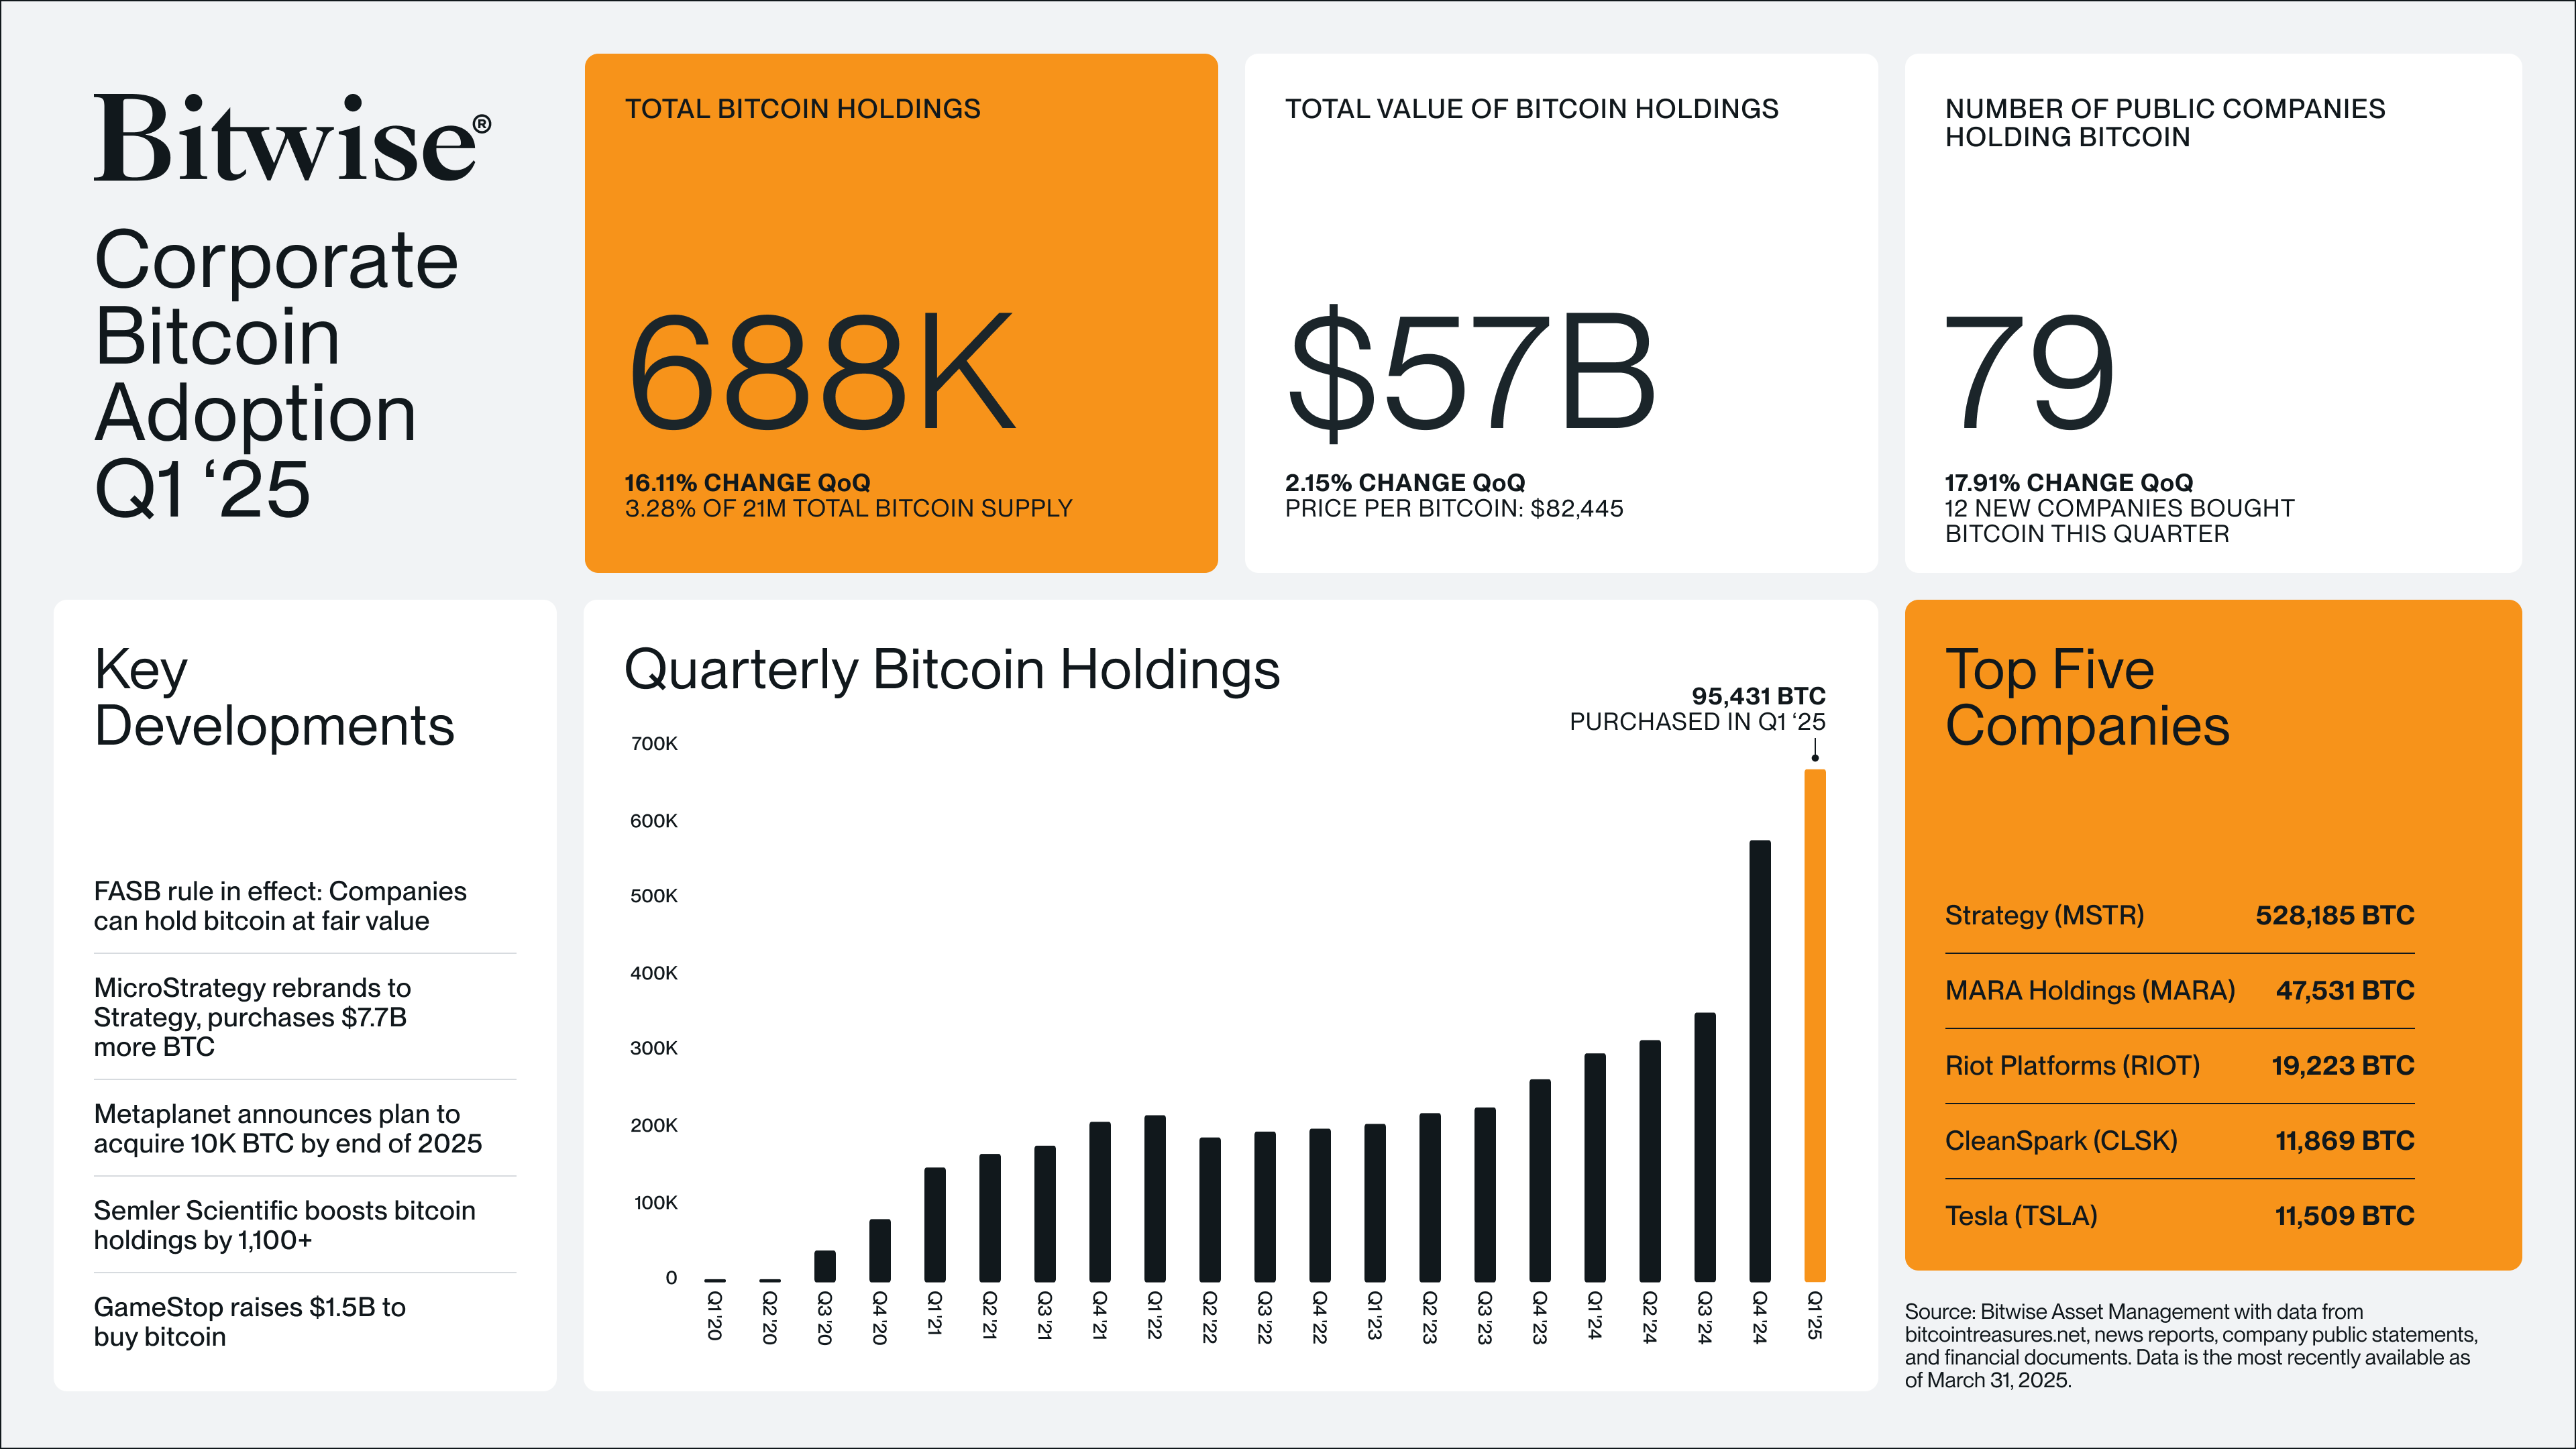
“People want to own Bitcoin. Corporations do too. 95,000 BTC purchased in Q1,” Bitwise CEO Hunter Horsley said.
With rising corporate demand and Bitcoin’s strong performance against traditional assets, the stage may be set for a major rally in summer 2025—driven by peak global liquidity and Bitcoin’s historic tendency to follow gold’s lead.
Coinbase announced that it is delisting MOVE, which subsequently plunged over 16%. The exchange did not describe any specific reasoning for this action, leading community speculation to flourish.
New evidence alleges that Movement Labs was directly or indirectly involved in a market maker dumping 66 million MOVE tokens. Coinbase may have lost confidence in the project between those rumors and a delayed airdrop.
In addition to this 16% price drop, MOVE’s daily trading volume surged 130%. This suggests that MOVE holders are selling their assets after Coinbase’s delisting announcement.
MOVE Price Crashes After Coinbase Delisting. Source: TradingView
This is a serious blow to Movement Network’s credibility and reputation. The project showed significant potential and even outperformed Bitcoin and Ethereum during the Q1 2025 cycle. It also raised $100 million in VC funding earlier this year, backed by notable investors.
However, Coinbase’s delisting is not unfounded. Earlier today, Movement Labs announced that a planned airdrop was being delayed, helping spark frustration. That may have been the final straw for Coinbase, on top of pre-existing problems.
From a perspective of someone who’s been building on Movement since day one — before mainnet, before the hype, before the community we have today even existed:
Specifically, Movement Labs claimed it would investigate an instance of potential fraud in mid-March. A market maker dumped 66 million MOVE tokens, triggering a sharp price drop.
New evidence has come to light, leading users to allege that Movement Labs was directly or indirectly complicit in these dealings. The company allegedly loaned 50% of MOVE’s supply to investment platform Web3Port, which proceeded to dump a large volume of tokens.
Based on these incidents, the community fears a repeat of MANTRA’s historic OM crash. Meanwhile, Movement Labs is backed by the Trump Family’s World Liberty Financial. The DeFi project holds more than 7 million MOVE tokens.
Ethereum (ETH) is up more than 10% over the last seven days as the market shows signs of renewed activity. However, key technical indicators reveal a mix of weakening trend strength and cautious optimism from buyers.
ETH is currently battling critical resistance zones that could define whether the rally continues or fades. With momentum still fragile, May could be a decisive month for Ethereum’s next major move.
Ethereum’s Trend Weakens Sharply as Bears Close In
Ethereum’s DMI chart shows its ADX is currently at 24.91, a sharp decline from 39 two days ago. The ADX, or Average Directional Index, measures the strength of a trend, whether up or down.
Generally, an ADX reading above 25 signals a strong trend, while values below 20 suggest the market is entering a period of weakness or range-bound trading.
The steep drop in ADX indicates that Ethereum’s recent momentum is quickly losing strength. Without renewed buying or selling pressure, ETH could remain stuck in a more volatile, sideways pattern over the short term.
Meanwhile, the directional indicators are showing a clear shift. The +DI, which tracks bullish pressure, has dropped to 22.71, falling from 31.71 three days ago and 27.3 yesterday.
In contrast, the -DI tracks bearish pressure has climbed to 17.68, up from just 7.16 three days ago and 15.64 yesterday. Yesterday, the gap between buyers and sellers nearly closed, with +DI at 20.91 and -DI at 20.1, suggesting sellers almost regained market control.
ETH RSI Climbs After Sharp Drop: Will the Recovery Hold?
Ethereum’s RSI is currently sitting at 56, up from 45.5 one day ago, after reaching 70.46 four days ago. The Relative Strength Index (RSI) is a momentum indicator that measures the speed and magnitude of price movements.
Typically, an RSI above 70 suggests an asset is overbought and may be due for a pullback, while an RSI below 30 indicates oversold conditions and the potential for a rebound.
Readings between 30 and 70 are considered neutral, with levels around 50 often signaling a market at a decision point. The sharp swing in Ethereum’s RSI over the past few days reflects the recent volatile sentiment around ETH.
With the RSI back up to 56, Ethereum has regained momentum after dipping into neutral-to-bearish territory. A reading above 50 leans slightly bullish, suggesting that buyers have started to reassert some control, though not with overwhelming strength.
However, if momentum stalls again and the RSI turns back down, it would suggest the recovery is losing steam and that Ethereum could fall back into a broader consolidation or even a correction phase.
Ethereum Battles Key Resistance as Breakout or Breakdown Looms
Ethereum price has made several attempts over the past few days to break above the resistance level at $1,828. If ETH manages to break and hold above this level decisively, it could open the door for a stronger move upward.
The next major target would be $1,954, and if bullish momentum remains strong, a further rally toward $2,104 could unfold. Ethereum could eventually test $2,320 in an even more aggressive uptrend, marking a significant bullish extension.
These levels will be key to watch as they could define the strength and sustainability of any breakout in the coming days.
On the downside, if Ethereum fails to hold its current levels and the trend reverses, the first critical support to watch lies at $1,749. A break below that could trigger a move lower toward $1,689.
Losing these levels would signal a much deeper correction, suggesting that the recent attempts at recovery were only temporary before a more prolonged bearish phase sets in.
There has been a sharp decline in daily active addresses across Smart Contract Platforms (SCPs) in recent months, raising concerns among investors and developers.
Meanwhile, Ethereum’s Pectra Upgrade could be the turning point, with crypto analyst Jamie Coutts calling the current state a cleansing of the ecosystem.
SCPs See Sharp Decline in Active Users
Jamie Coutts, who built Bloomberg Intelligence’s crypto research product, says this is the worst decline ever recorded in the history of SCPs.
He also notes that it is far worse than the 2022-2023 bear market, with daily active addresses dropping 40.5% in just five months.
“This is the largest usage collapse in SCP history,” wrote Coutts.
Coutts’ analysis provides a deeper look at the broader crypto ecosystem, which is simultaneously witnessing an uptick in global liquidity and an all-time high in stablecoin market cap.
While the sector seems to be experiencing a shakeout, Coutts says this decline does not indicate the death of smart contract platforms. Rather, it is a necessary cleansing of the ecosystem.
The analyst attributes the drop in daily active addresses to several key factors, including the rise of artificial activity.
“Much of the past cycle’s growth was artificial: Usage inflated by bots and Sybil farms, Incentive programs created temporary traction without stickiness. The unwind reflects a cleansing of fake activity, not the death of the sector,” Coutts explains.
The rise of bots and Sybil attacks, where bad actors create multiple fake identities to manipulate a platform’s usage metrics, has artificially inflated the activity numbers across various smart contract platforms.
Now, as these fake users are being weeded out, the real growth potential of SCPs is becoming clearer.
Moreover, this trend suggests that SCPs with weak application ecosystems or limited use cases will face significant valuation compression. This is especially true without stablecoin integration or real-world asset (RWA) applications.
Coutts notes that many SCP tokens risk valuation compression if their platforms do not offer high throughput, low-cost, and real settlement capabilities.
The market will likely reward mature platforms capable of supporting real economic activity. These include stablecoin transactions, payments, and AI-native applications.
“…going forward, value will concentrate in platforms that enable high-throughput, low-cost, real settlement and agentic automation,” he added.
Ethereum Staking Surge Post-Pectra
Interestingly, these predictions align with the recent Ethereum Pectra upgrade, which went live on May 7, 2025.
The Pectra upgrade introduces key features that could help Ethereum, the largest smart contract platform, stay ahead in this playing field. Specifically, the upgrade improves Ethereum’s staking model and validator operations.
CryptoQuant recently indicated a notable spike in ETH staking around the Pectra Upgrade news. Specifically, before the Pectra upgrade news, ETH staking saw a net outflow of around 1.02 million ETH, reflecting uncertainty.
However, after the news, staking rebounded with a 627,000 ETH inflow, signaling renewed market confidence in the Ethereum staking ecosystem.
“Before Pectra News (Nov 16 – Feb 15): ETH staking dropped from ≈34.88M to 33.86M ETH, a net outflow of ~1.02M ETH. This period reflects market uncertainty and mild unwinding of staking positions ahead of the upgrade. After Pectra News (Feb 16 – May 16): Total ETH staked rose from 33.78M to 34.41M ETH — a net inflow of ~627K ETH. Indicates renewed confidence in the staking process following the upgrade,” wrote CryptoQuant analyst Kripto Mevsimi.
ETH Staking before and after Pectra Upgrade news. Source: CryptoQuant
In the same tone, Bohdan Opryshko, co-founder and COO at Everstake, told BeInCrypto that the Pectra upgrade may be Ethereum’s most institution-friendly update. He says the upgrade is the clearest signal that Ethereum is ready for conservative capital.
“For the first time, institutions can stake at scale with operational clarity and reduced complexity. It’s a green light for conservative capital to get involved in native Ethereum staking,” Opryshko told BeInCrypto.
Further, Pectra’s introduction of smart accounts allows Ethereum wallets to execute smart contract logic. This could drive stablecoin integration.
At the same time, it could enhance scalability. This would make Ethereum better suited to handle real economic activities such as payments and financial transactions.
Nevertheless, Coutts highlighted a divergence between price action and network activity, a common phenomenon in the crypto space. While markets stabilize, activity on many SCPs remains stagnant.
Coutts notes that this divergence will not last. More sophisticated capital will increasingly flow toward platforms that anchor real economic behavior, especially via stablecoin flows and payments.
“Markets may be stabilizing, but activity is not,” More sophisticated capital will increasingly rotate toward chains that anchor real economic behavior, especially via stablecoin flows, payments, and AI-native applications,” Coutts says.
Finally, Coutts predicts that a liquidity-driven rally will return, fueled by the significant liquidity expected to enter the system in the coming months.
However, he cautions that the value will likely accrue to a subset of SCPs that can deliver tangible value through real-world applications and stablecoin integration. This sentiment aligns with the structural upgrades brought by Ethereum’s Pectra fork.