Bitcoin broke a new all-time high as its market capitalization rose to $2.096 trillion, which places it above Google’s parent company in the global asset rankings. The feat is achieved as BTC is trading just below $105,000. Bitcoin Overtakes Silver and Google in Market Capitalization Bitcoin has risen to sixth place in world asset rankings by market capitalization, ahead of Alphabet (Google) and silver. Recent data by 8marketcap places the flagship crypto at a combined market capitalization worth $2.096 trillion, compared to Google’s $2.028 trillion and Silver’s $1.844 trillion. BTC has shown brilliant performance with 2.56% increase in the past 24 hours and 2.66% increase in the past week. Such upward momentum is contrary to some of the traditional assets leading the list that have shown weekly declines. They are Apple (-1.95%), Amazon (-2.46%), and Silver (-1.10%). Source: 8marketcap Bitcoin’s price movement in recent days has been quite stable, as… Read More at Coingape.com
Grayscale is aiming to launch the first spot Dogecoin ETF and has filed a proposal with the SEC. The action sent DOGE price up nearly 2% in 24 hours. Grayscale Seeks SEC Approval For Its Dogecoin ETF Amid Market Anticipation Grayscale has filed an S-1 registration statement with the U.S. Securities and Exchange Commission (SEC)
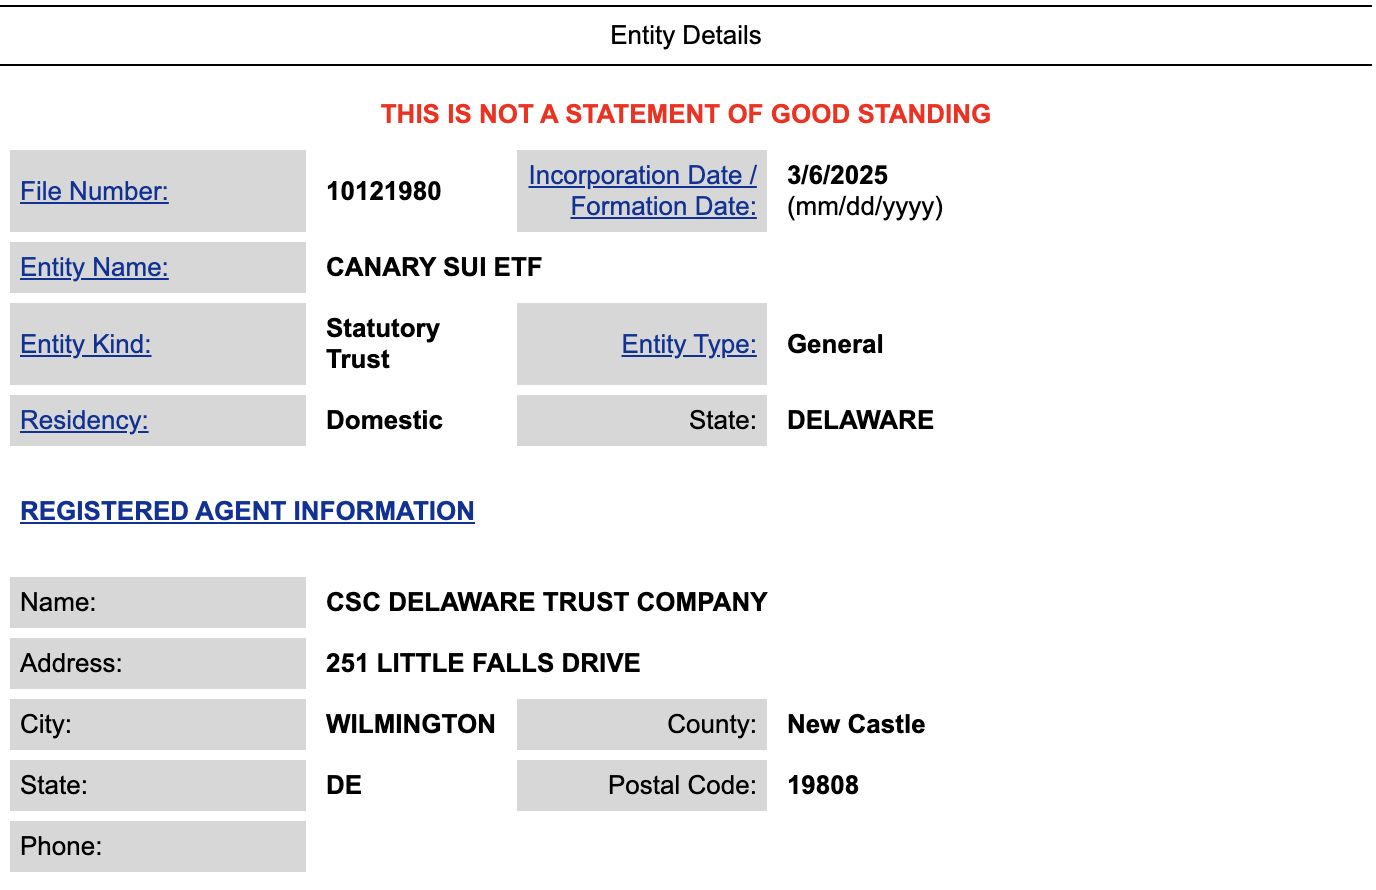
Canary Capital, an asset management firm, has registered a statutory trust for a Sui (SUI) exchange-traded fund (ETF) in Delaware.
The filing, submitted to the Delaware Division of Corporations on March 6, hints at the firm’s intention to launch an SUI ETF.
Canary Capital Takes First Step Towards SUI ETF
The registration is the first step before submitting an S-1 form to the US Securities and Exchange Commission (SEC). Additionally, the firm will need to submit a 19b-4 filing to the SEC through the exchange where the ETF will be listed.
Amidst this, a Sui Network ambassador outlined the potential market impact of a SUI ETF, drawing comparisons to the success of Bitcoin (BTC) and Ethereum (ETH) ETFs. According to the ambassador, a SUI ETF could bring similar benefits.
“Even a slice of the interest that BTC/ETH ETFs saw could significantly boost Sui Network liquidity and market cap,” the post read.
He explained that SUI ETF could boost liquidity by offering a new trading platform for both crypto and traditional investors. Moreover, by holding actual SUI tokens, the ETF could reduce the circulating supply, potentially driving up the price.
The increase in liquidity and price would boost ecosystem growth, making it attractive for developers and institutional investors looking to capitalize on this momentum.
“Bitcoin and Ethereum are now “established.” A newer network like Sui offers higher risk but possibly higher reward, akin to investing in an emerging tech stock,” he wrote.
Nonetheless, the ambassador noted that institutions may be cautious with an SUI ETF. He cited volatility, liquidity, and regulatory uncertainty as potential concerns.
Furthermore, he claimed that regulatory approval may be difficult, as the SEC has scrutinized many altcoins as potential securities. Thus, he believes SUI could face the same fate, requiring market surveillance and clarity on its status. However, he acknowledged that these regulatory procedures could become more streamlined with President Trump now in office.