Leading coin Bitcoin has been in a corrective phase since hitting its all-time high of $111,968 on May 22. The king coin has slipped below the key $105,000 support level to trade at $104,536 at press time, reflecting the selling pressure.
However, on-chain data suggests a potential rebound above this critical support level, with a possible retest of BTC’s all-time high on the horizon. This analysis breaks down the key insights.
BTC Liquidity Clusters Signal Surge Toward $109,000
An assessment of BTC’s liquidation heatmap shows a notable concentration of liquidity around the $109,933 price zone.
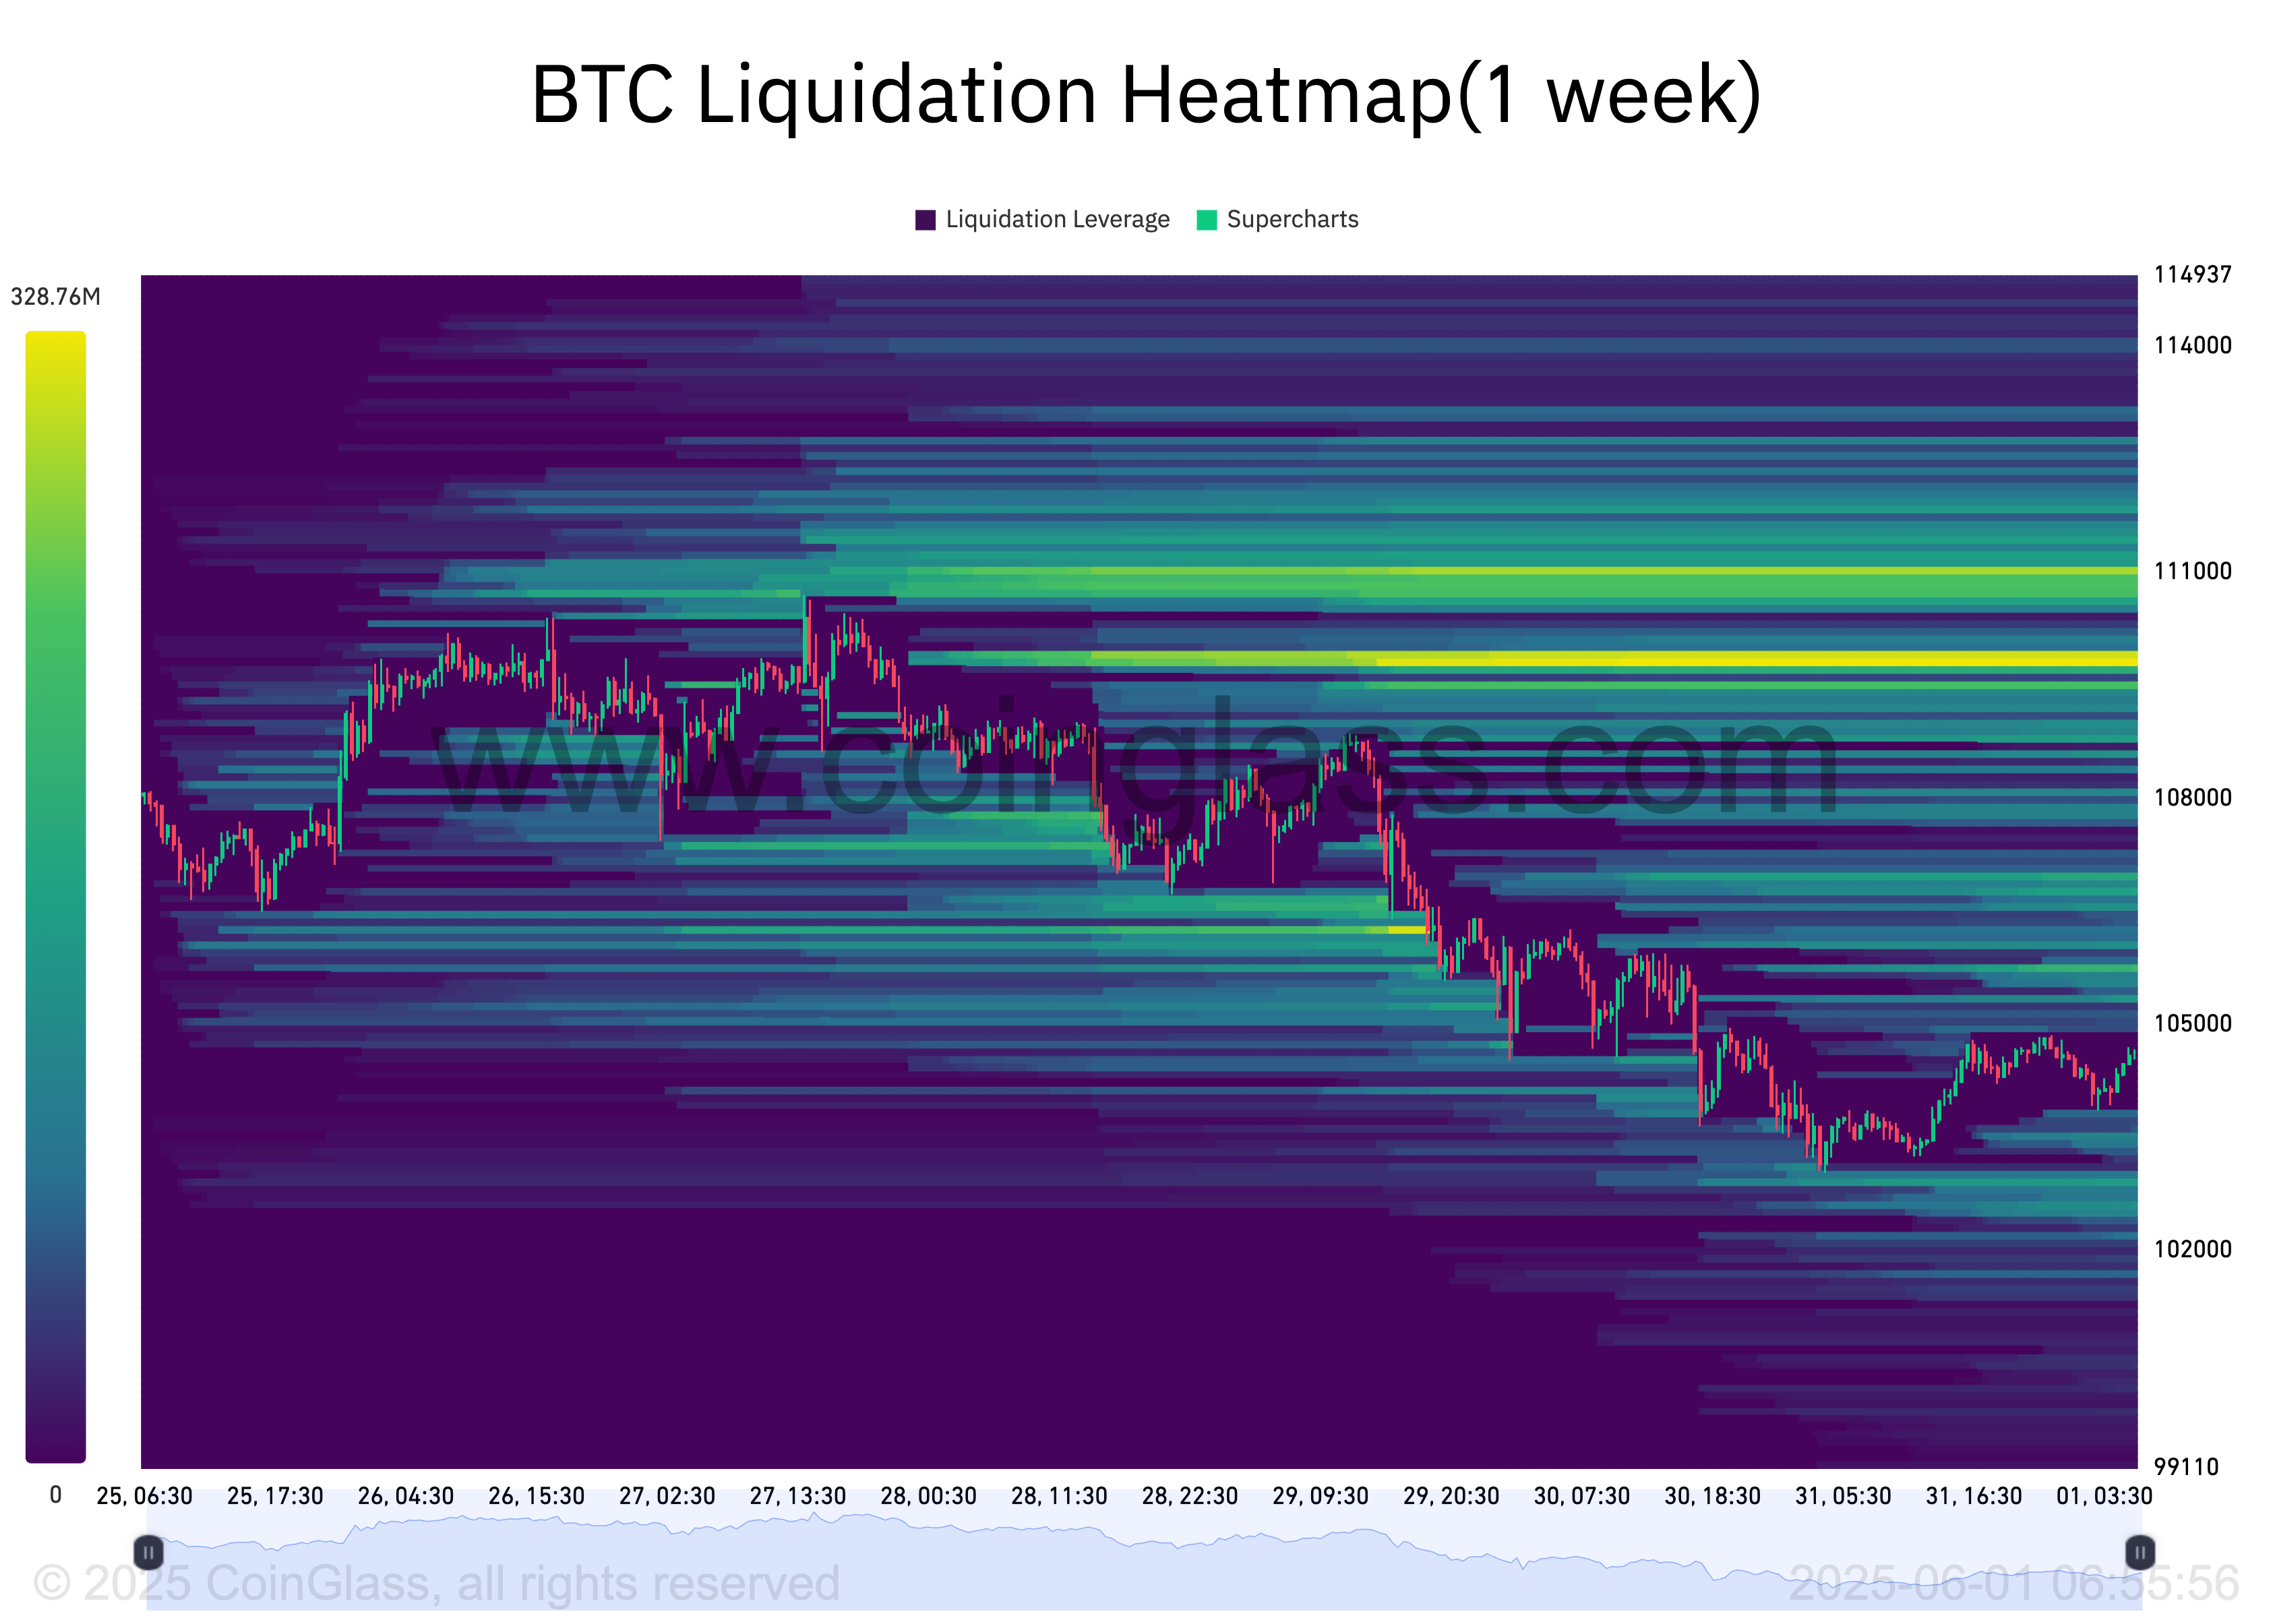
Liquidation heatmaps identify price levels where large clusters of leveraged positions are likely to be liquidated. These maps highlight areas of high liquidity, often color-coded to show intensity, with brighter zones (yellow) representing larger liquidation potential.
Usually, these cluster zones act as magnets for price action, as the market tends to move toward these areas to trigger liquidations and open fresh positions.
Therefore, for BTC, the convergence of a high volume of liquidity at the $109,933 price level indicates a strong trader interest in buying or closing short positions at that price. It creates room for a surge toward the $109,000 mark.
Further, the coin’s funding rate has remained positive despite its recent price pullback. At press time, this stands at 0.005%, per Coinglass.
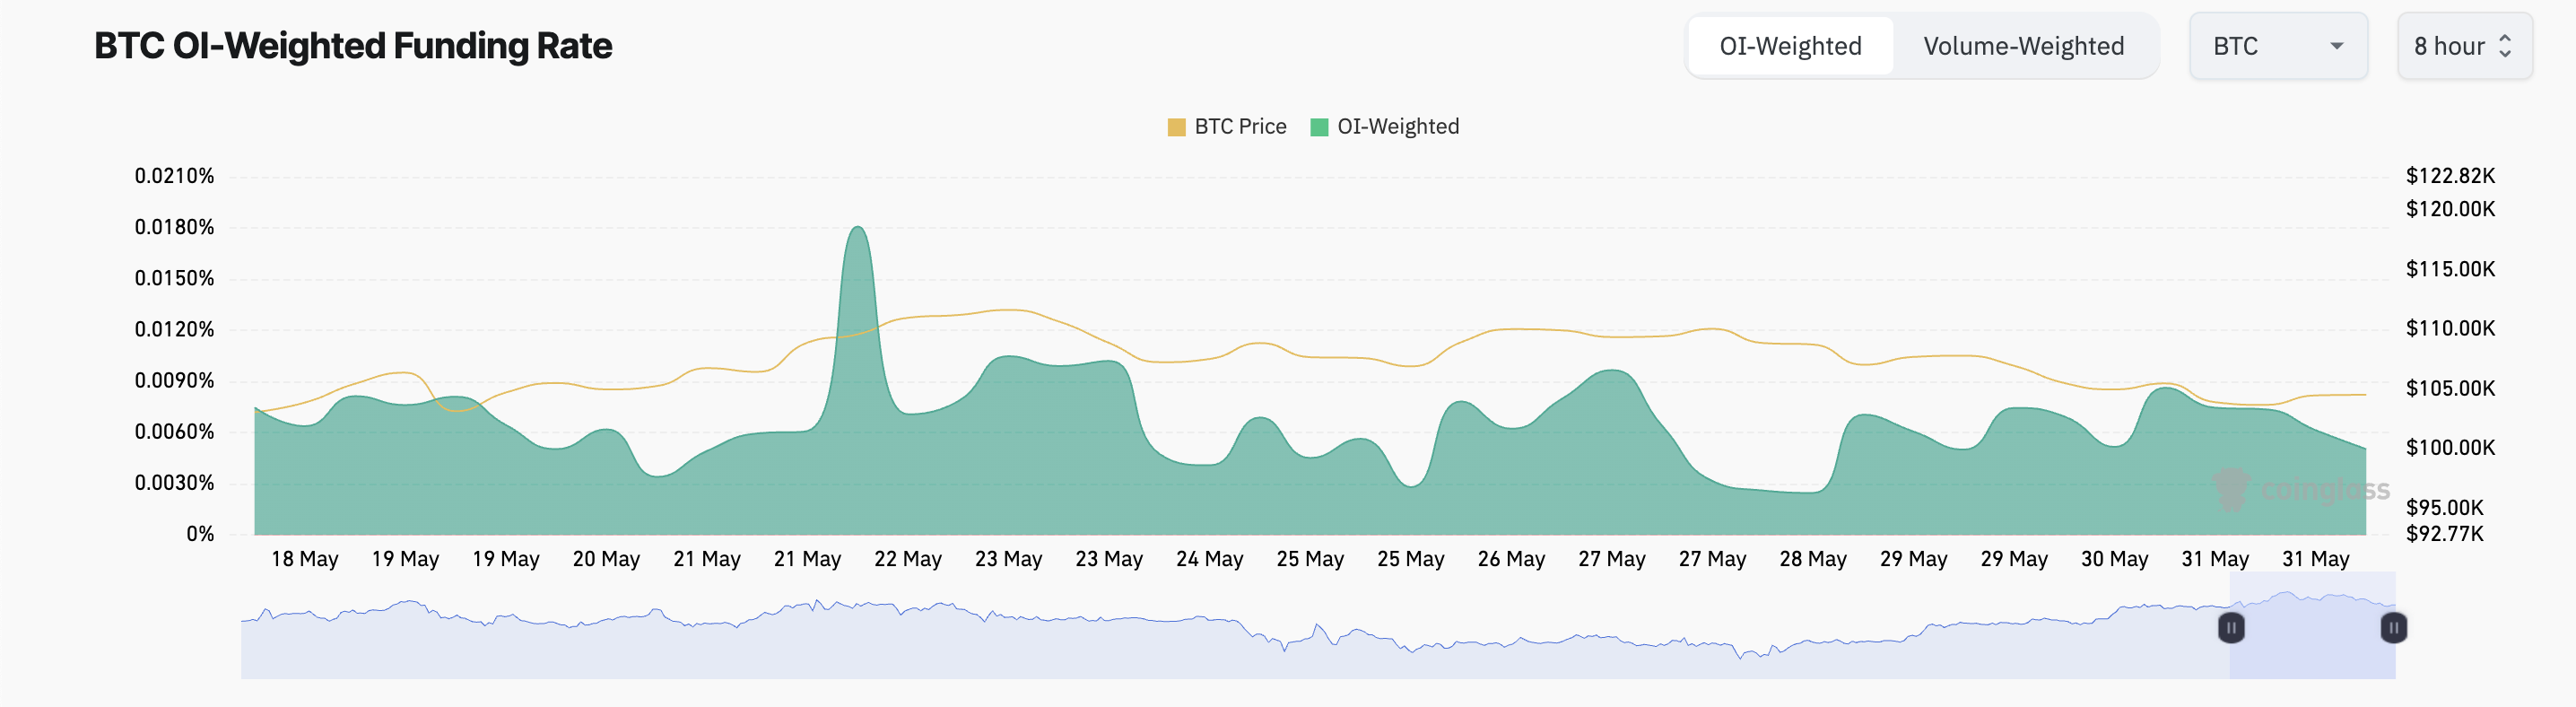
The funding rate is a periodic payment between traders in perpetual futures contracts to keep the contract price aligned with the spot price. When the funding rate is positive, there is a higher demand for long positions.
This means more traders continue to bet on BTC’s price going up, even in the face of strengthening bearish momentum.
BTC Price Teeters Between $103,000 Support and $109,000 Liquidity Zone
BTC has posted a modest 1% gain in the past 24 hours, bouncing off the $103,952 support level. If demand soars, this support floor could hold firm and push prices above the psychological barrier at $105,000, potentially targeting $106,307.
A clean break above this zone may open the door to the $109,000 price area dense with leveraged positions.
BTC Price Analysis. Source: TradingView
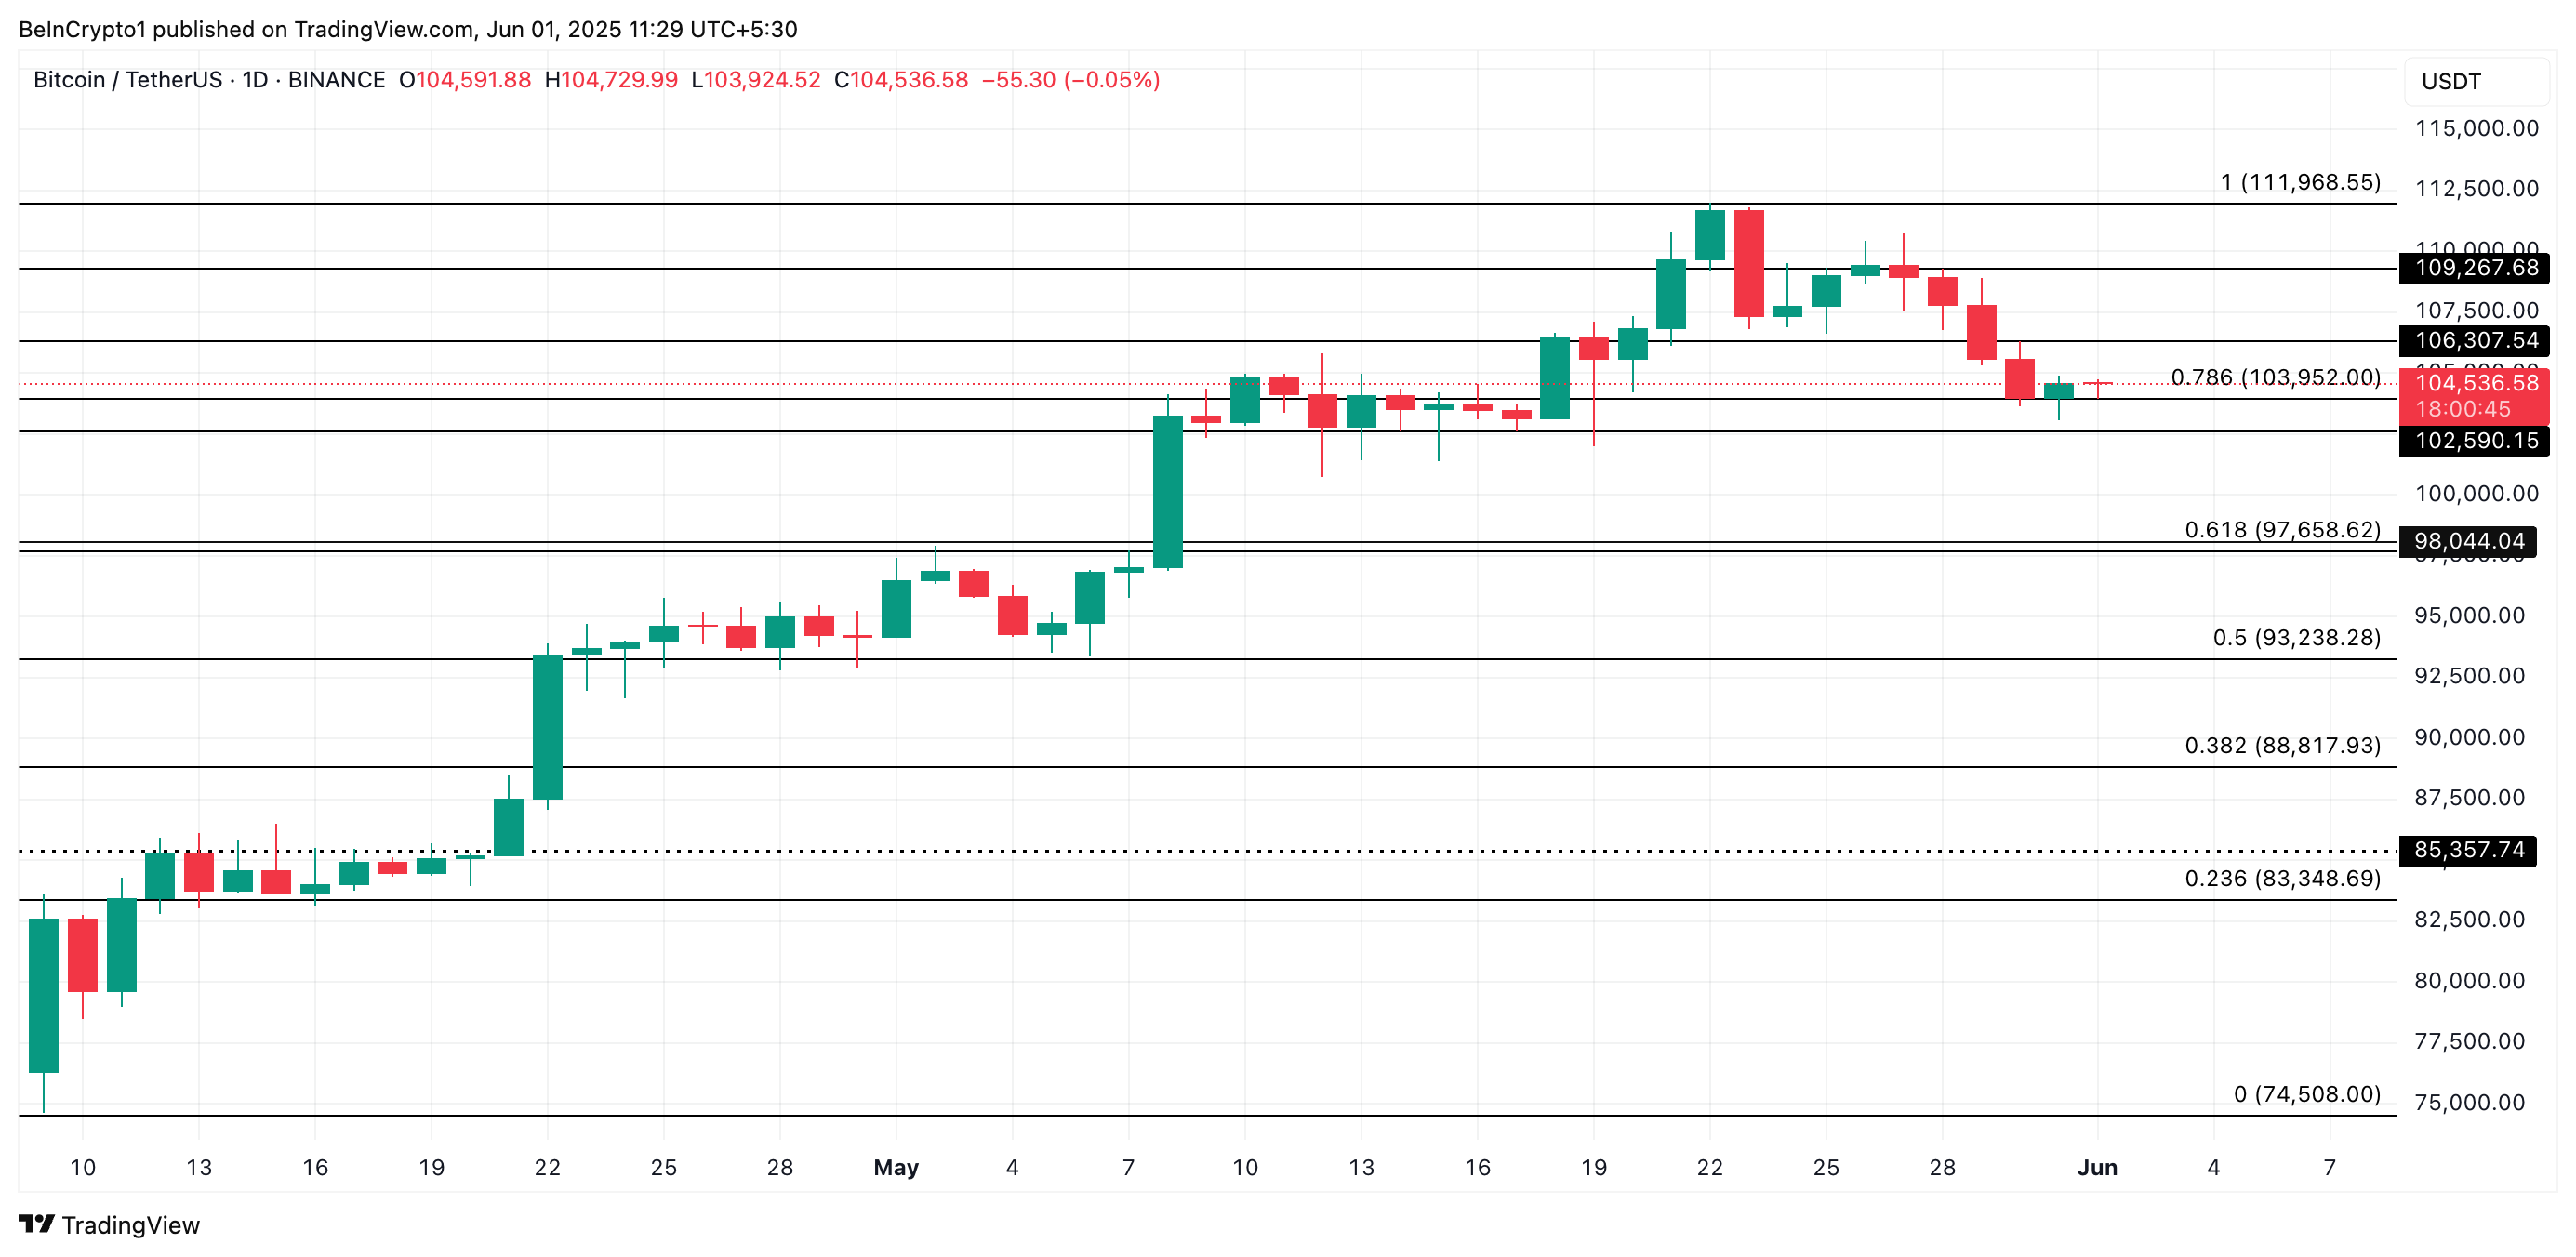
However, increased profit-taking could drag BTC back below $103,952, with a further decline toward $102,590 likely.
After numerous Congressional debates and revisions, the GENIUS Act is now on the verge of becoming law. The bill, which aims to regulate the stablecoin industry across the United States, is widely expected to be signed.
According to representatives from Digital Chamber, a D.C.-based advocacy group for the blockchain industry, the bill approval will likely come before the end of June. Such a move would increase institutional adoption and strengthen the US dollar’s dominance globally.
When Will the GENIUS Act Pass?
Poised for passage, the GENIUS Act is a landmark bill that would federally regulate the US stablecoin industry.
Despite recent disagreements between Republican and Democratic Senators, the bill passed a key procedural vote. Kristopher Klaich, Policy Director at The Digital Chamber, strongly believes in its impending approval.
“I feel pretty strongly that there won’t be more hiccups… I think the industry has been such a strong player in politics for the last couple of years and supporting campaigns… there’s a high cost for members that may be the stick in the mud,” he told BeInCrypto.
According to Taylor Barr, the advocacy group’s Government Affairs and PAC Manager, 53 amendments have been made.
“Majority leader Thune is committed to having what he’s calling a fully open amendment process, which means every single amendment has the full right to go through a debate vote and to have full closure on each amendment. So at the end of the day, that could be a three-week-long process,” Barr told BeInCrypto.
However, Barr clarified that a fully open process with 53 individual debates is unlikely. He expects these amendments to be divided into three or four groups, resulting in a more efficient and abbreviated open amendment process, given that many are duplicative.
If Barr’s estimations are correct, the bill will pass before the end of this month. When it does, the significance will be substantial for the greater crypto industry.
Understanding Stablecoin Impact
Stablecoins are arguably the most globally adopted digital asset. Unlike traditional cryptocurrencies like Bitcoin or altcoins, they provide worldwide access to a stable medium of exchange.
According to a January report by crypto exchange CEX.io, the total stablecoin transaction volume reached 27.6 trillion in 2024, exceeding Visa’s total payment volume and Mastercard’s by 7.7%.
Tether and Circle dominate the market at $151 billion and $59 billion, respectively. Together, they have an 89% market share, according to rwa.xyz.
Tether and Circle dominate stablecoin market share. Source: rwa.xyz.
Their heavyweight presence in global economies makes a bill like the GENIUS Act all the more significant. This is especially true in the context of a debilitated US dollar.
The Dollar’s Waning Influence
The US dollar started the year exceptionally weakly. Two days ago, the US Dollar Index (DXY)—a key measure heavily influenced by the euro—fell nearly 9% to just under 99. The results marked its weakest calendar year opening since at least the mid-1980s.
This situation and broader de-dollarization efforts by major US debt holders like China and Japan intensify concerns about the dollar’s future.
US Dollar Index Continues to Decline. Source: Yahoo Finance
Data from Ark Invest illustrates this shift. In 2011, these three nations held 23% of the $10.1 trillion in outstanding US Treasury debt.
By November 2024, despite the total outstanding US Treasury debt rising to $36 trillion, their combined holdings had dropped significantly to approximately 6%.
This substantial decrease in holdings by key foreign creditors highlights growing worries about the dollar’s long-term stability and the United States’ ability to refinance its massive debt.
“Dollars are the world reserve currency. Demand for dollars has waned at the sovereign level. Over recent years, the largest purchasers of treasuries are cutting their holdings of treasuries. That is not a good situation for the United States as they try to refinance,” Klaich said.
Klaich added that legislation like the GENIUS Act is crucial:
“In my mind, there’s very little more important than the stablecoin bill being passed from an macroeconomic perspective… If demand for dollars diminishes at the sovereign level, structurally speaking, if that is or can be replaced by demand at a retail individual level, that is a huge boon to the US government.”
The data behind Klaich’s statements seems to back his analysis.
What Role Will Stablecoins Play in Future US Debt Demand?
The stablecoin market is poised for significant growth. According to an April report from Citigroup, the total stablecoin supply could reach $1.6 trillion by 2030. This growth could create a demand for US debt comparable to the historical levels supported by sovereign nations.
Stablecoin issuers could be one of the largest holders of US treasuries by 2030. Source: Citigroup.
The GENIUS Act could facilitate this transition.
“Hopefully, when it passes, demand for stablecoins will explode because there are many companies and banks that are planning to introduce stablecoins that will provide the rails for them to operate at a consumer and business level. So the efficiencies companies and individuals realize will help push that,” Klaich explained.
“It allows anybody in the world to access US dollars. What that affords the US from an economic warfare standpoint is significant,” Klaich added.
With persistent inflation risks, the Federal Reserve is unlikely to buy back significant amounts of US treasuries. Therefore, encouraging stablecoin use allows this market to effectively replace currently ineffective financial mechanisms.
Amendments to the Bill
If the GENIUS Act is implemented correctly, the stablecoin industry could become a valuable financial tool for the US government to ensure long-term support for the US dollar.
The bill underwent a difficult revision process. According to Barr, the process was tedious and politically challenging.
“If you look at all of the progress we’ve made, we’ve worked on this for three Congresses now. We’ve worked on this [through] multiple different leaderships– minority, majority split. So we’re so close. We’ve done all this progress so we can see the finish line. We’re going to get there,” he said.
However, multiple revisions were a prerequisite for its passage to ensure the bill responsibly addressed consumer protection, national security, and market integrity issues.
Klaich noted that these critical concerns were addressed fairly in the legislative process. He emphasized that recent versions of the bill effectively integrated these revisions.
“None of those issues are existential, and they’ve been negotiated into the latest version of the bill that’s being considered right now. I think the changes that have been made are reasonable and acceptable,” he said.
The future will reveal if the bill passes and achieves its desired effect in helping the US overcome its complicated economic reality.
PI has been in a persistent downtrend since reaching an all-time high of $3 on February 26. In fact, it has traded below a descending trendline since April 12, highlighting the negative bias against the altcoin.
However, the tide may finally be turning. Technical indicators now point to a potential bullish resurgence, hinting at a PI rebound in the short term.
PI’s Quiet Accumulation Phase Could Trigger a Rally
BeInCrypto’s assessment of the PI/USD one-day chart suggests that the altcoin may be preparing for a bullish breakout. For example, its on-balance volume (OBV) has spiked over the past two days, showing early signs of accumulation.
The OBV indicator uses trading volume to predict price movements, adding volume on up days and subtracting it on down days. When its value rises like this, it suggests a surge in buying pressure.
OBV is considered a leading indicator, meaning it often moves ahead of price action and can signal shifts in market sentiment before they are reflected in the asset’s price. Therefore, PI’s rising OBV indicates that buyers are quietly accumulating the token, even as its price remains subdued.
This divergence signals that bullish momentum is building, increasing the likelihood of a PI breakout once broader market sentiment aligns.
Furthermore, the red bars forming PI’s BBTrend indicator have gradually shrunk. This reduction suggests that selling pressure is weakening, serving as an early signal that the current downtrend may be losing steam.
In technical analysis, a contraction in the BBTrend histogram is a precursor to a potential trend reversal, especially when accompanied by rising volume and other bullish indicators.
As the bars shorten, it indicates that volatility is stabilizing in the PI market and that a bullish shift in price is increasingly likely.
PI for Reversal as Bullish Signals Point to $1 Breakout
PI currently trades at $0.591, resting below its descending trend line, which forms resistance above it at $0.605. If bullish pressure strengthens and PI demand rockets, it could flip this price point into a support floor and climb toward $1.01.
Ethereum (ETH) has been struggling, down nearly 30% over the past 30 days as bearish sentiment continues to weigh on the asset. Over the last week, ETH has remained stuck below the $2,000 mark, unable to regain key resistance levels.
While some indicators, like BBTrend, are showing early signs of stabilization, whale activity points to cautious behavior among large investors. As Ethereum trades near critical support zones, the market is watching closely to see if the downtrend will deepen or if bulls can stage a meaningful recovery.
BBTrend Is Now Positive After 6 Days, But Still At Modest Levels
Ethereum’s BBTrend indicator is currently sitting at 0.22, having just turned positive after spending six consecutive days in negative territory.
During that stretch, it reached a negative peak of -17.68 on March 13, reflecting strong bearish momentum.
This shift marks a potential early sign of stabilization for Ethereum. The indicator has crossed back above zero, signaling that sellers may be losing control in the short term, as Ethereum network activity recently hit yearly lows.
BBTrend, or Bollinger Band Trend, is a momentum-based indicator that measures the strength and direction of a price trend relative to its Bollinger Bands. Readings below 0 typically suggest bearish conditions, while readings above 0 indicate bullish momentum.
Thresholds around -10 or +10 often highlight periods of stronger trend conviction. Ethereum’s BBTrend is now back in positive territory after a prolonged bearish phase, suggesting that downward pressure is easing.
However, at just 0.22, the indicator is still at low levels, signaling that while the sell-off might be cooling, the market has yet to transition into a strong bullish trend fully.
Whales Are Not Accumulating Ethereum
The number of Ethereum whales—wallets holding at least 1,000 ETH—has been steadily declining since February 22, after peaking at 5,828 addresses.
This gradual reduction in large holders points to a cautious approach among key players. Some whales are reducing their exposure or taking profits as Ethereum’s price action remains mixed.
Tracking whale behavior is crucial because these large addresses often act as market movers, capable of influencing price trends through their buying or selling activity.
A steady decline in Ethereum whale numbers may suggest waning confidence or a shift toward risk-off sentiment among institutional or high-net-worth investors.
This downward trend in whale accumulation could limit the strength of any potential rallies, as fewer large players are positioned to provide strong buying support in the short term.
Will Ethereum Fall Below $1,700 In March?
Ethereum has been under pressure, trading below the $2,000 mark for the past seven days. Sellers have kept the asset pinned beneath key resistance levels.
The current support stands at $1,823, and if this level is tested and broken, Ethereum could decline further toward $1,759 and potentially fall below $1,700 for the first time since October 2023, despite some experts defending its future echoes early Amazon and Microsoft.
However, if Ethereum’s price manages to stabilize and build an uptrend, it could challenge the immediate resistance at $1,956.
A breakout above this level may open the path for a rally toward $2,106, with further bullish momentum potentially pushing ETH to retest $2,320 and even $2,546.
A break above $2,500 would mark the first time Ethereum reclaims that level since March 2, signaling a notable shift in market confidence and buyer strength.