Bitcoin, the world’s largest cryptocurrency by market cap, has just hit a new all-time high of $109,788, passing its earlier record set in January. With this new surge, Bitcoin has now overtaken Amazon in market value and is the fifth-largest asset in the world with a market cap of $2.14 trillion.
But many experts say this is just the beginning. So, what’s pushing Bitcoin higher this time?
Institution Pouring Huge Capital
One of the biggest reasons behind Bitcoin’s rise is the growing interest from big institutions. MicroStrategy, now rebranded as Strategy, has added more BTC to its already massive stack, now holding over 576,000 Bitcoins, which is 2.7% of the total supply. That’s no small move.
Other companies are following their lead. Japan’s Metaplanet just bought 1,004 BTC, bringing its total holdings to 10,000 BTC. This growing corporate demand is one reason why many believe Bitcoin still has room to fly.
Politics and Policy Are Turning Pro-Bitcoin
It’s not just companies that are getting involved—governments are stepping in too. In the U.S., the GENIUS Act, which supports clearer stablecoin regulations, is moving forward in the U.S. Senate.
On top of that, President Donald Trump’s executive order to build a Strategic Bitcoin Reserve, and you’ve got real government-level support fueling investor confidence.
All this has added fuel to the fire. With all this support, Bitcoin’s market value has now reached $2.13 trillion, making it the fifth most valuable asset behind gold, Microsoft, Nvidia, and Apple.
Where Is Bitcoin Heading Next?
Looking at the recent Bitcoin rise, Veteran trader Peter Brandt believes this is just another step in a bigger rally. He thinks Bitcoin could reach $150,000 by August. He’s currently “long” on BTC, meaning he expects it to go higher.
Famous author Robert Kiyosaki also sees big things ahead, he says Bitcoin might even hit $250,000 this year.
So, while Bitcoin is already at a new high, many believe the real breakout is still ahead
Shiba Inu (SHIB) is flashing a warning sign after forming a bear flag pattern. Meanwhile, 2 trillion SHIB tokens have flooded exchanges in one month, highlighting growing bearish pressure towards Shiba Inu price. SHIB trades at $0.0000143 at press time with $180M in daily trading volumes and an $8.44 billion market cap. In 24 hours, SHIB has fluctuated between a daily low of $0.0000141 and a daily high of $0.0000146 per data from CoinMarketCap. Shiba Inu Price Flashes Warning Sign as Bear Flag Emerges Shiba Inu price has flashed a warning sign on the weekly chart after a bear flag pattern emerged. A bear flag usually indicates a brief pause in the downtrend before the bearish momentum continues to push SHIB lower. This bear flag will be deemed valid if the price of SHIB falls below the lower support level and extends the downtrend. In this case, this meme coin… Read More at Coingape.com
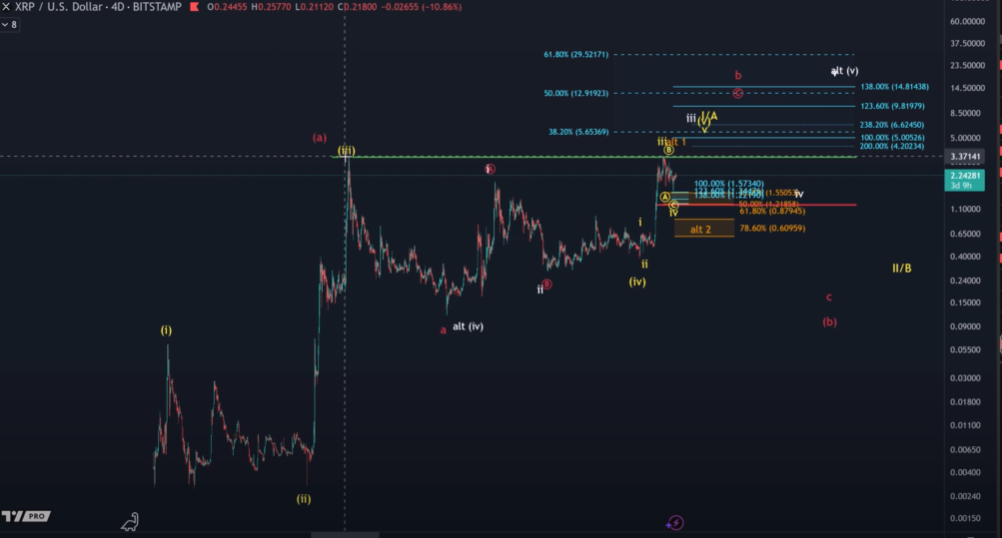
XRP is currently trading in the green at $2.22. Market analysts are watching closely, as recent movements have opened up the possibility of further gains. Looking at the 4-day chart, an analyst has said that there are two main possible scenarios for XRP’s price direction:
1. The Yellow Scenario (More Likely)
This scenario shows XRP continuing to rise, possibly reaching a new all-time high before undergoing a major correction. This structure follows a pattern of five waves that started from XRP’s low in 2013. If this plays out, a correction could follow, possibly pulling the price down to $0.40–$0.50, similar to past market behavior.
2. The White Scenario (Alternative)
This scenario shows that the current bull market actually started in 2020, not 2013. XRP is possibly in the final wave of a smaller five-wave move. If true, a smaller but still significant correction could follow, possibly lasting up to a year.
Despite the uncertainty, both scenarios expect another price increase, especially while XRP holds above the key support level of $1.20. If this happens, XRP could rise to $5.60 or even $6.60.
Short-Term Outlook
From a shorter-term perspective, XRP appears to be forming a five-wave move up from its April low. However, the pattern is not yet clear. If XRP stays above $2.12, prices could continue to rise. But if it drops below that level, we may see a correction with support between $1.84 and $2.10.
The post XRP Price Prediction: 85% Drop to $0.30 Possible, Analyst Warns appeared first on Coinpedia Fintech News
XRP is currently trading in the green at $2.22. Market analysts are watching closely, as recent movements have opened up the possibility of further gains. Looking at the 4-day chart, an analyst has said that there are two main possible scenarios for XRP’s price direction: 1. The Yellow Scenario (More Likely) This scenario shows XRP …
Ethereum (ETH) price at $1,805 shows resilience above the $1,800 mark despite the sudden shakeout in the crypto market. With short-term bullish resilience, the upcoming Pectra upgrade is expected to boost the ETH market price with multiple changes in the ETH mainnet, leading to increased scalability and additional features.
Ethereum Price Prepares Bullish Launch From $1,800
In the 4-hour price chart, the Ethereum price trend showcases a sideways movement above the $1,755 mark. This crucial zone marks a high-demand area extending between $1,754 and $1,765.
Providing multiple bouncebacks, the high-demand area and the 200 EMA line hold the Ethereum price uptrend. Currently, the Ethereum sideways movement marks a consolidation range with the upper ceiling near $1,855.
As the ETH price holds above $1,800 after a prevailing recovery, the 100 and 200 EMA lines are on the verge of giving a positive crossover. However, the RSI indicator reflects a loss of momentum as the consolidation range grows.
Currently, the 4-hour RSI line struggles to overcome the halfway line. Based on the Fibonacci levels, a bullish breakout of the upper ceiling at $1,855 will likely test the 78.60% Fibonacci level near $1,949.
Optimistically, the uptrend could reach the $2,100 mark near the previous swing high. On the flip side, the crucial support below $1,755 remains at the $1,676 level.
On-Chain Data Signals Potential Price Surge to $2,000
As Ethereum holds its ground near $1,800, the in/out of the money around price indicator from IntotheBlock reflects a strong resistance ahead. The initial supply zone extends from $1,805 to $1,857, holding a total volume of 5.85 million ETH in 4.48 million addresses.
This is significantly larger compared to the nearest demand zone, extending from $1,748 to $1,800, holding a total volume of 2.29 million ETH within 3.46 million addresses.
In/Out of the Money Around Price
However, considering the short-term spike in Ethereum exceeds the overhead supply zone, the Ethereum price could witness a smoother sale towards the $2,000 mark. This is due to the short-term supply zones ahead holding a significantly lesser supply.
Will ETH Price Bounce Back as Analyst Signals an Ease in Selling Pressure?
As Ethereum hangs close to a crucial support, the spot volume is on a cooldown stage. As per the on-chain analyst DarkFost, this sudden slowdown in the Ethereum spot volume could actually be a good signal for a potential bullish recovery.
Based on the Ethereum spot volume bubble map by CryptoQuant, the analyst highlights the sudden drop in the spot volume, meaning the bigger the bubble, the higher the volume. Similarly, the change in the spot volume is denoted by the color of each bubble.
Currently, the sudden cool-off in the spot volume aligns with the prevailing correction in the Ethereum price trend. Witnessing a volume decline as the asset price declines could help reduce volatility under such conditions. This could also potentially reflect the slowdown in the selling pressure.
Ethereum spot volume bubble map
However, the analyst warns that the slowdown in the selling pressure does not mean the bottom is in.
The Pectra Upgrade Hype
The upcoming Pectra upgrade in Ethereum is likely to bring multiple key refinements to the mainnet. As per a recent tweet by Nansen AI, the key changes include the validator’s consolidation, reaching a 2,048 ETH market cap from the previous 32 ETH limit.
Furthermore, the Layer 2s can get cheaper, as blobs per block grow by 100% from 3 blobs to 6 blobs. Additionally, the EIP-7702 will bring temporary smart contract functionality to Ethereum wallets.
Overall, the key functionality brings faster staking, lower Layer 2 transaction fees, smarter wallets, and the Pectra Upgrade. These key upgrades will bring higher yields for stakers with easier operation.
Furthermore, roll-ups like Optimism and ZK-Sync will benefit from the cheaper data posting, with the increase in blobs per block. Decentralized applications (dApps) on the Ethereum ecosystem will be able to process batch transactions as gas sponsorships become easier.
Despite multiple upgrades, there are potential risks involved in the Pectra upgrade. Such as the validator’s consolidation could increase the risk of centralization on the Ethereum mainnet. Furthermore, the reliance of dApps on call data could increase transaction costs.
Finally, the growth of the smart wallet with the upgrade of EIP-7702 depends on the developers’ adoption. Nevertheless, the upcoming launch of Pectra upgrade shows potential to result in a massive Ethereum price surge.
Coinbase Announces Halt in Ethereum Deposits Ahead of Pectra
With the Pectra upgrade scheduled on May 7 at 3.05 am PT, Coinbase has announced a temporary pause of Ethereum deposits and withdrawals. This is to ensure the safety of the user’s funds. The temporary pause will extend from 2.50 am to 3.45 am PT.
Additionally, the initiation of new staking requests during this cool-off period will be delayed until 3.45 am PT. However, no existing stake positions will be impacted.