The crypto market is stabilizing as Bitcoin (BTC) recovers above $85K, with Ethereum and XRP prices maintaining above $1,500 and $2 respectively. This comes after China announced new tariffs on U.S. imports in response to President Donald Trump’s 145% tariff on Chinese products. Additionally, this week’s CPI and PPI data came below expectation, boosting the prices of Bitcoin and altcoin markets. This has left room for a significant recovery rally in the coming week as buying demand rises exponentially.
Bitcoin Price Analysis
Bitcoin has surged above the crucial $85K level and is now aiming to maintain its recovery rally toward upcoming resistance channels. As of writing, BTC price trades at $84,864, surging over 3.2% in the last 24 hours.
The 20-day average price ($82,246) is starting to rise, but the RSI (which measures buying and selling strength) is hovering within the buying region at level 64, suggesting that the downward pressure is easing up a bit. As Bitcoin hovers around strong resistance channels, it’s likely to face downward correction. However, if buyers hold the momentum above $85K, the price might climb to $89,000 and possibly even $95,000 next week.
On the flip side, sellers will likely try to block that move and push the price back down below the $78K support. If they succeed, Bitcoin could fall again to retest the crucial $74.5K support level.
Ethereum Price Analysis
Ether bounced off critical $1,500 as sellers are having a hard time keeping the price down. As of writing, ETH price trades at $1,645, surging over 5% in the last 24 hours.
The moving averages are trending up, and the RSI is in positive territory, which means buyers are having an advantage. They’ll likely try to hold the price above the descending resistance line. If this happens, we might see ETH price skyrocketing toward the crucial resistance around $2,000 next week.
To avoid that, sellers need to quickly push the price below the EMA20 trend line. If they manage that, Ether could decline toward $1,386. That level is important because if the price goes below it, it could signal a short-term change in momentum away from the bulls.
XRP Price Analysis
XRP climbed back above the $2 level and is aiming to maintain a trend above the EMA200 trend line on the 4-hour chart. As of writing, XRP price trades at $2.13, surging over 5.51% in the last 24 hours.
If XRP manages to rise above the 200-day moving average, it would suggest that the recent drop toward $2 heavily attracted buying demand. In that case, the price could continue to climb toward the resistance line at $2.25, where sellers are likely to step in again. A surge above this level might send the price toward $2.6.
If the price drops from the $2.25 level, sellers might try to push XRP/USDT down to the key support at $2. Buyers will likely defend that level strongly, because if it breaks, the price could fall further to around $1.6.
A lot happened this week in crypto, marking developments expected to continue shaping the industry. Important headlines came from administrative decisions, ecosystem developments, and analysts probing the market outlook.
In case you missed it, the following is a roundup of some of the most important developments in the crypto market this week.
XRP Lawsuit’s Jay Clayton Became New SDNY Attorney
“Trump’s former SEC Chair Jay Clayton has taken his position as interim US attorney for the Southern District of New York. He will serve for up to four months until confirmed by the Senate or appointed by Manhattan federal judges,” former Fox Business reporter Eleanor Terrett reported.
The move came as Democratic leaders in the Senate reportedly hinted at blocking Clayton’s nomination. Trump’s move to install him as interim could see Clayton avoid the Senate confirmation process.
Clayton is the legal expert who initially filed the longstanding legal action between the SEC and Ripple. As it happened, Clayton filed the lawsuit on December 22, 2020, and resigned the next day in what will be remembered as a “parting shot” for the agency.
Pi Network Pioneer Frustration Over Ambiguous Roadmap
Another crypto incident this week concerned Pi Network pioneers. As BeInCrypto reported, the controversial project released its Mainnet Migration Roadmap. However, it failed to impress pioneers as it lacked key details.
Specifically, several gaps sparked concerns, including failing to disclose how many Pioneers remain in the queue. Similarly, it was unable to show the network’s daily migration capacity. The absence of these figures makes it impossible for users to predict when their migration will occur.
Further, opaque criteria for node rewards and the UI’s “Transferable Balance” underestimating actual migrated amounts raised flags. Pi Network also offers no audit or error‑resolution process for users who spot mismatches in their historical mining data, exacerbating the fears.
“I thought we were mining all of these PI coins this whole time? I thought the security circles were the Consensus Mechanism. It kinda seems to me like there isn’t a blockchain, and never was one. What kind of “Blockchain protocol” would “Require” all tokens to be minted at genesis?” one community member wrote.
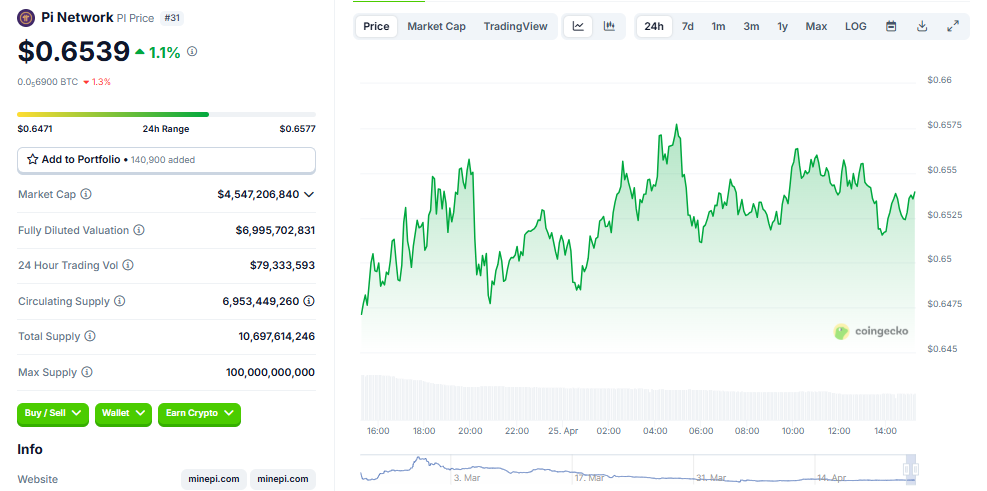
Pi Network (PI) price performance. Source: CoinGecko
Data on Coingecko shows PI coin was trading for $0.6539 as of this writing, up by a modest 1.1% in the last 24 hours.
Bitcoin Cycle Unfolds Noticeably Different From Previous Ones
More interestingly, BeInCrypto reported a concerning shift: this cycle is unfolding remarkably differently than the past ones post-halving.
In previous cycles, BTC price tended to rally aggressively months after the Bitcoin halving. The post-halving period saw strong upward momentum and parabolic price action.
This trend was largely driven by retail enthusiasm and speculative demand, which proved most pronounced from 2012 to 2016 and 2016 to 2020.
Things are happening differently in the current cycle. Instead of accelerating after the halving, the price surge began in October and December 2024, driven by Bitcoin ETF (exchange-traded funds) hype. This was followed by consolidation in January 2025 and a correction in late February.
PancakeSwap Announces CAKE Tokenomics Date
This week in crypto, PancakeSwap announced the official date for its CAKE tokenomics, April 23. As BeInCrypto reported, key changes included the removal of veCAKE, staking, and revenue sharing, with 5.3 million CAKE to be burned annually to curb supply.
However, there was also controversy as Cakepie DAO pushed back against veCAKE removal. Several developers and community members believe CAKE Tokenomics 3.0 will benefit the project in the long term.
“At its core, CAKE Tokenomics 3.0 defends true value and protects CAKE holders by strengthening long-term fundamentals—such as aggressively cutting emissions to accelerate deflation and sustainably grow value,” Chef Philip said.
Meanwhile, others voiced strong concerns on X (Twitter), criticizing the decision to eliminate veCAKE. Among them was Cakepie DAO, one of the largest veCAKE holders, who called it non-transparent and potentially damaging to projects built around that model.
Against this backdrop, PancakeSwap resorted to a $1.5 million CAKE compensation plan.
“PancakeSwap is willing to provide 1.5M USD in CAKE to CakePie DAO primarily used to compensate CKP Holders if CakePie DAO enables mCAKE holders to redeem 1:1 back to CAKE and opens the redemption page in a timely manner if the proposal passes. Detailed plans will be announced once the mirror proposal on CakePie is completed,” the Head Chef of PancakeSwap wrote.
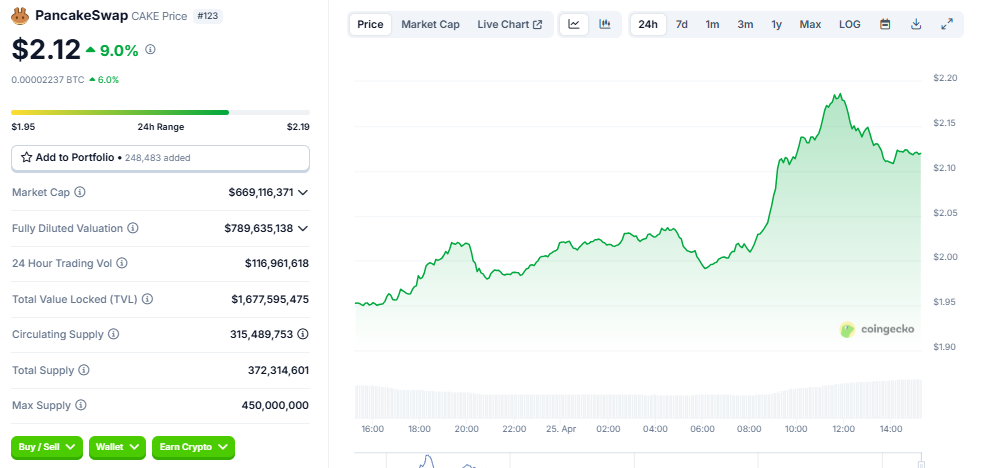
Data on CoinGecko shows Pancake’s CAKE was trading for $2.12 as of this writing, up by nearly 10% in the last 24 hours.
Zora Airdrop and Token Launch Announcement
Adding to the list of the many events that happened this week in crypto, Zora Network announced that it would airdrop 1 billion ZORA tokens (10% of the total supply) on April 23. The tokens would reward early platform users across two snapshot periods.
As it happened, the crypto airdrop happened in style, sparking confusion as it lacked an official checker or claim site. Users were required to go to the contract address and check their allocations.
Speaking to BeInCrypto, Jesse Pollak, the creator of the Base blockchain, said that one must not understand anything about crypto or the underlying infrastructure before posting on Zora. He also defended the value of content coins, emphasizing their potential for creators despite volatility.
ARB, the native token of the leading Layer-2 scaling solution Arbitrum (ARB), is today’s top-performing token. It is up over 16% today, fueled by growing speculation surrounding a potential partnership with Robinhood.
Interestingly, on-chain data suggests that the rally may be short-lived as key metrics flash warning signs.
Arbitrum Tops Gainers as Robinhood Speculation Runs Hot
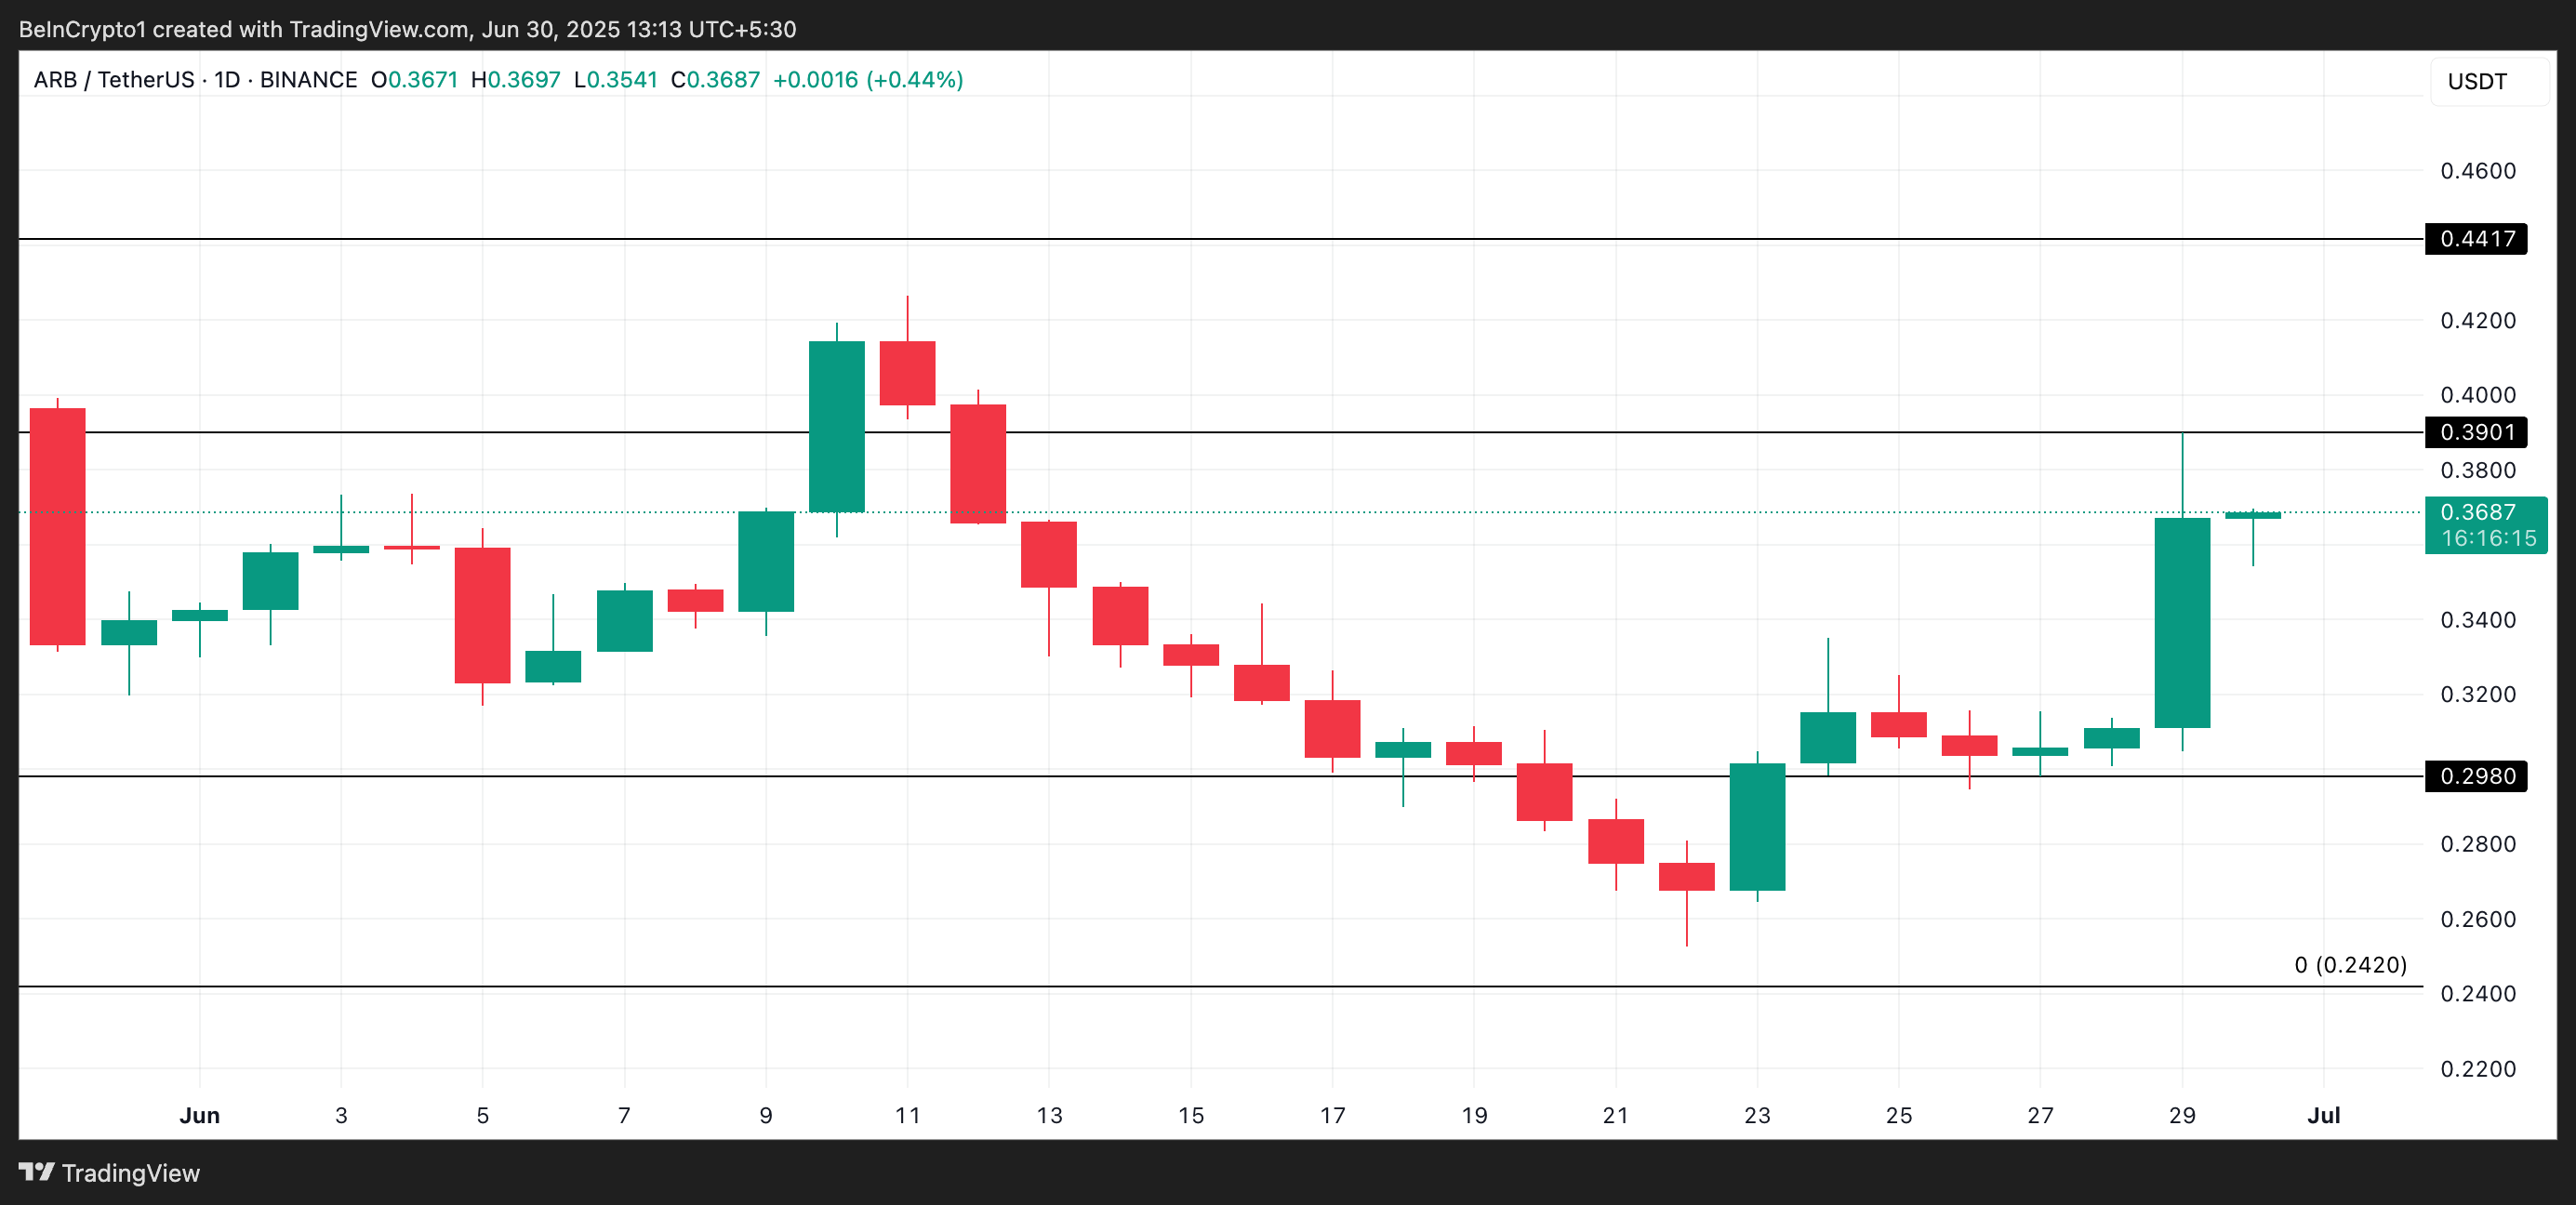
ARB is up by double digits today and currently trades at $0.36. This comes ahead of the Monday fireside chat between Ethereum co-founder Vitalik Buterin, Robinhood Crypto General Manager Johann Kerbrat, and A.J. Warner, the Chief Strategy Officer at Offchain Labs, the team behind Arbitrum.
This upcoming meeting has fueled speculation that Arbitrum could be announced as a partner for Robinhood’s blockchain plans. The buzz is partly driven by a May 8 Bloomberg report, which revealed that the US-based platform is developing a blockchain-based platform, with Arbitrum reportedly being considered a potential partner for the venture.
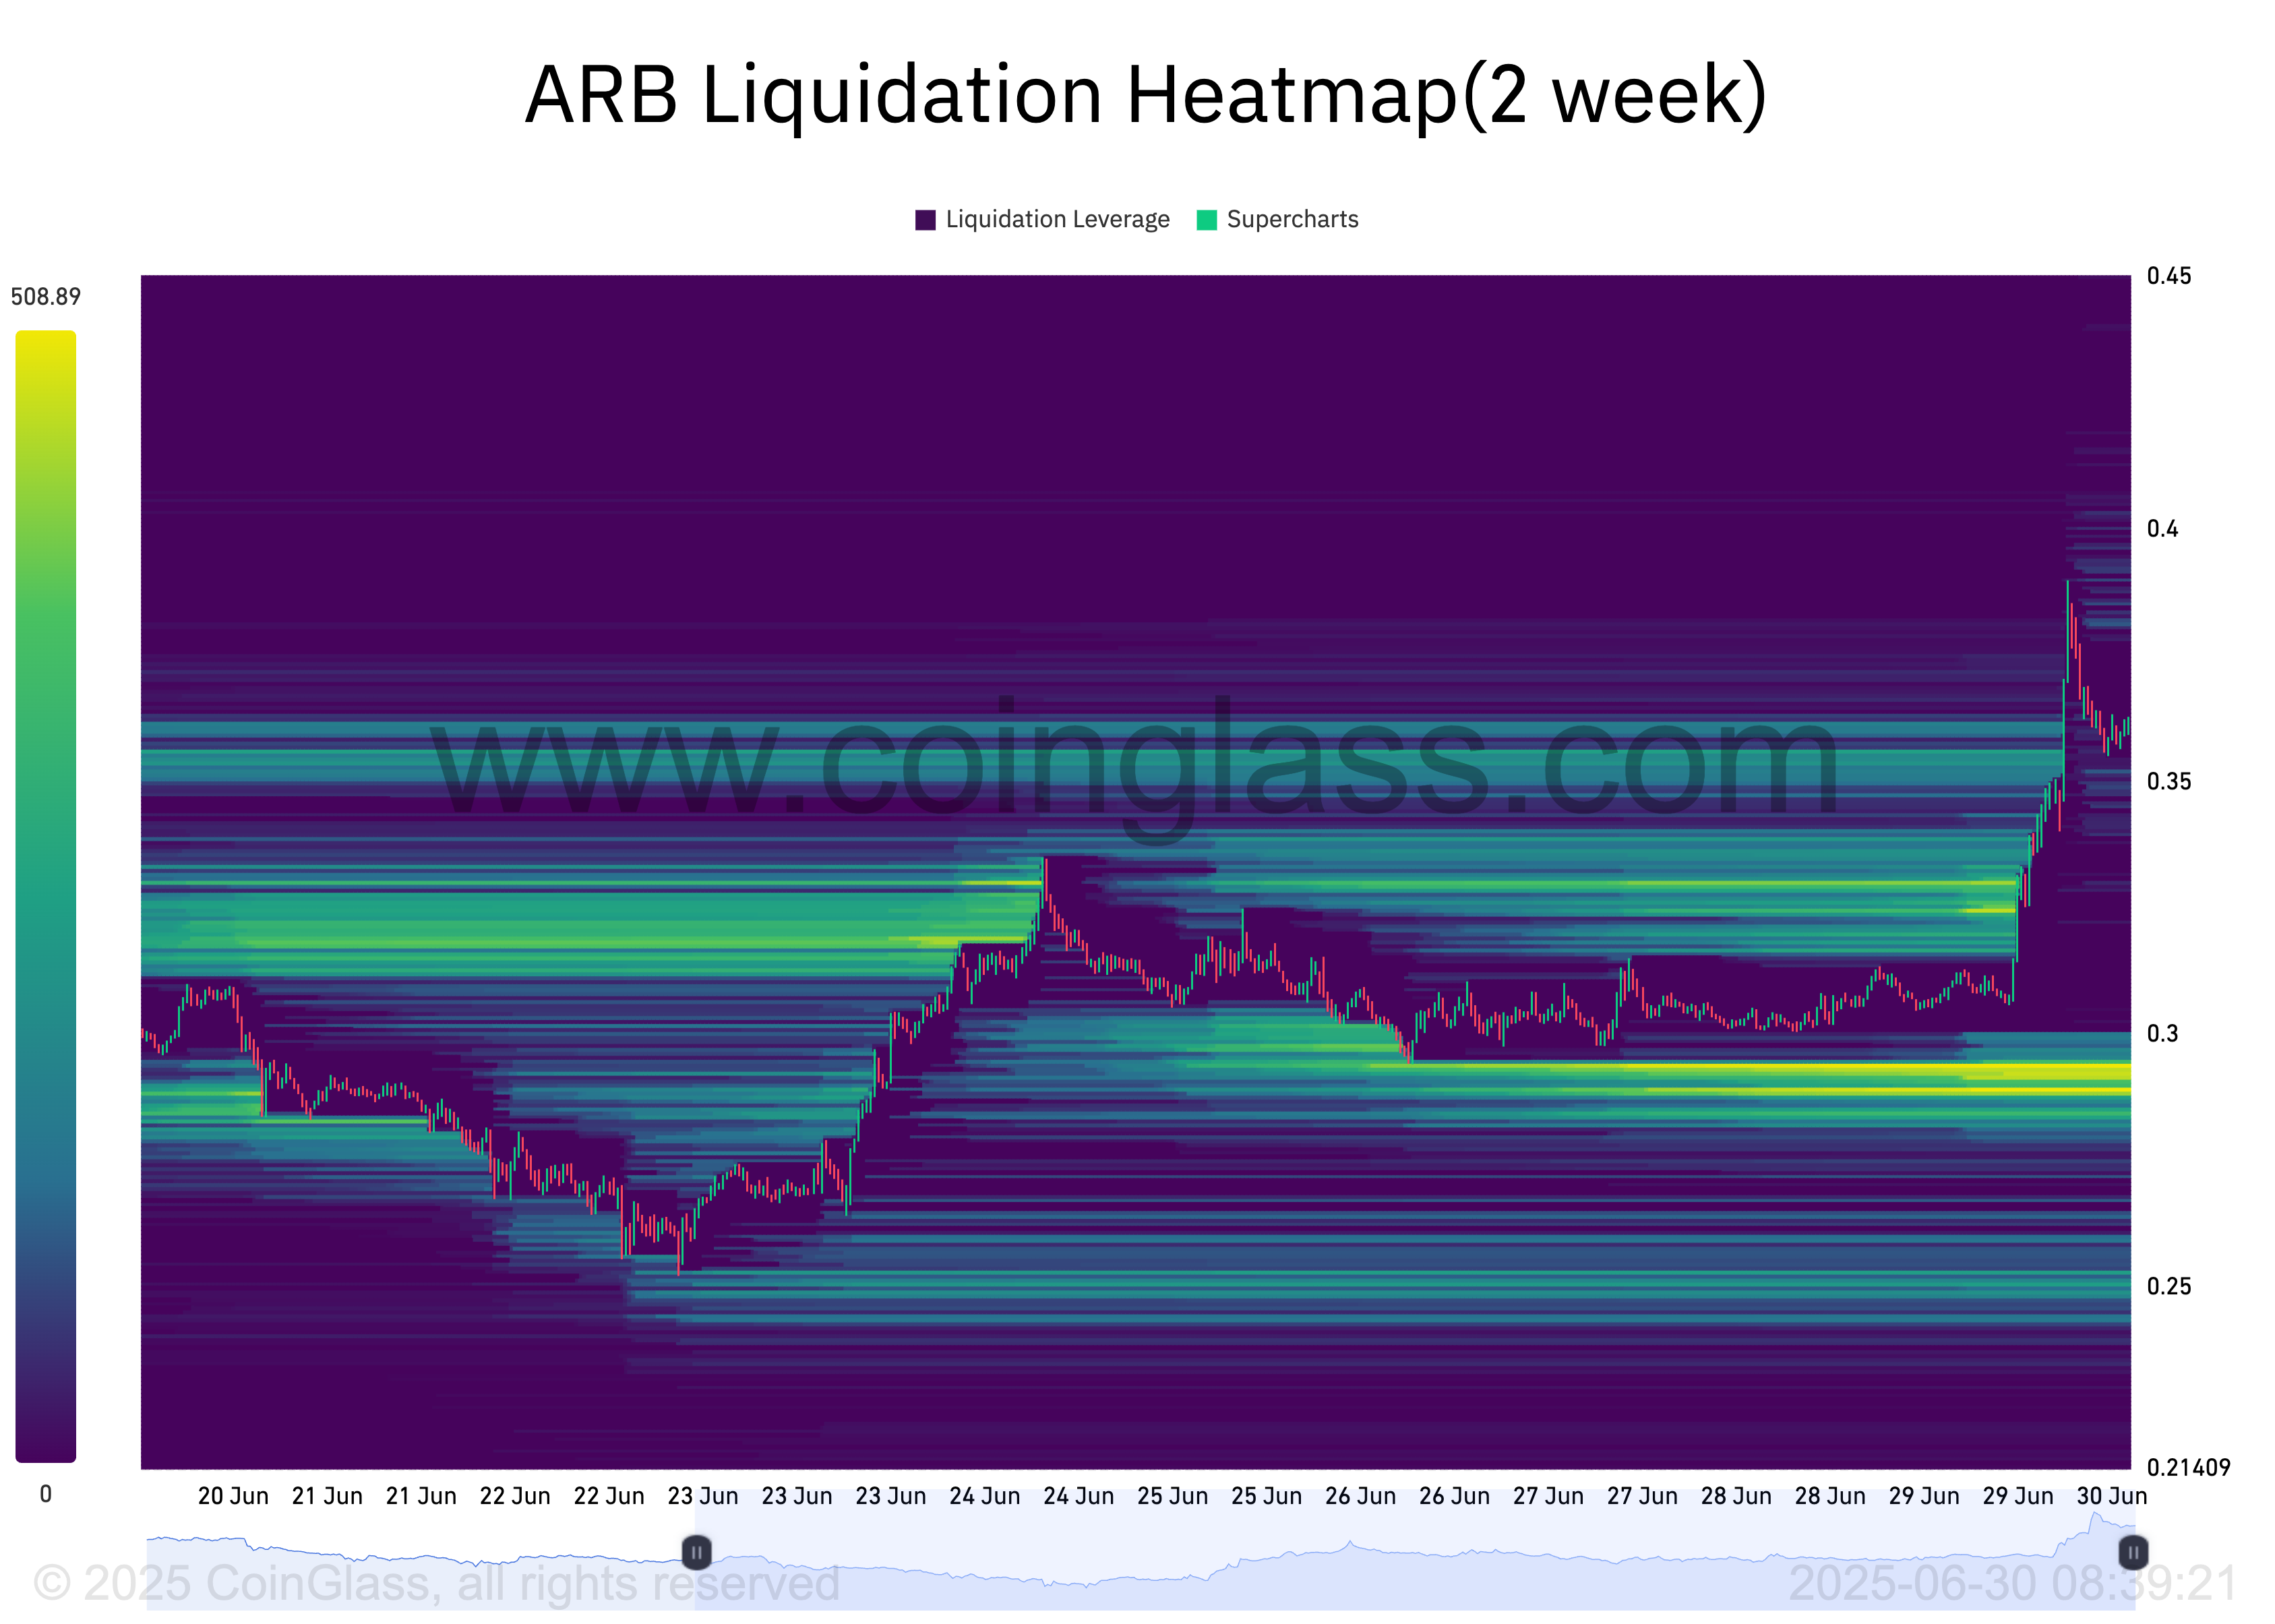
However, despite the bullish price action, on-chain data indicates that the rally may face some challenges in the short term. For example, the token’s liquidation heatmap shows a substantial liquidity cluster below ARB’s price at $0.29, suggesting that a pullback could be on the horizon.
Liquidation heatmaps are visual tools traders use to identify price levels where large clusters of leveraged positions are likely to be liquidated. These maps show areas of high liquidity, often color-coded to show intensity, with brighter zones representing larger liquidation potential.
When the heatmap shows a liquidity cluster below an asset’s price, many leveraged long positions have liquidation levels in that area. This acts as a magnet for price retracement, as the market may move down to trigger those liquidations before continuing in either direction.
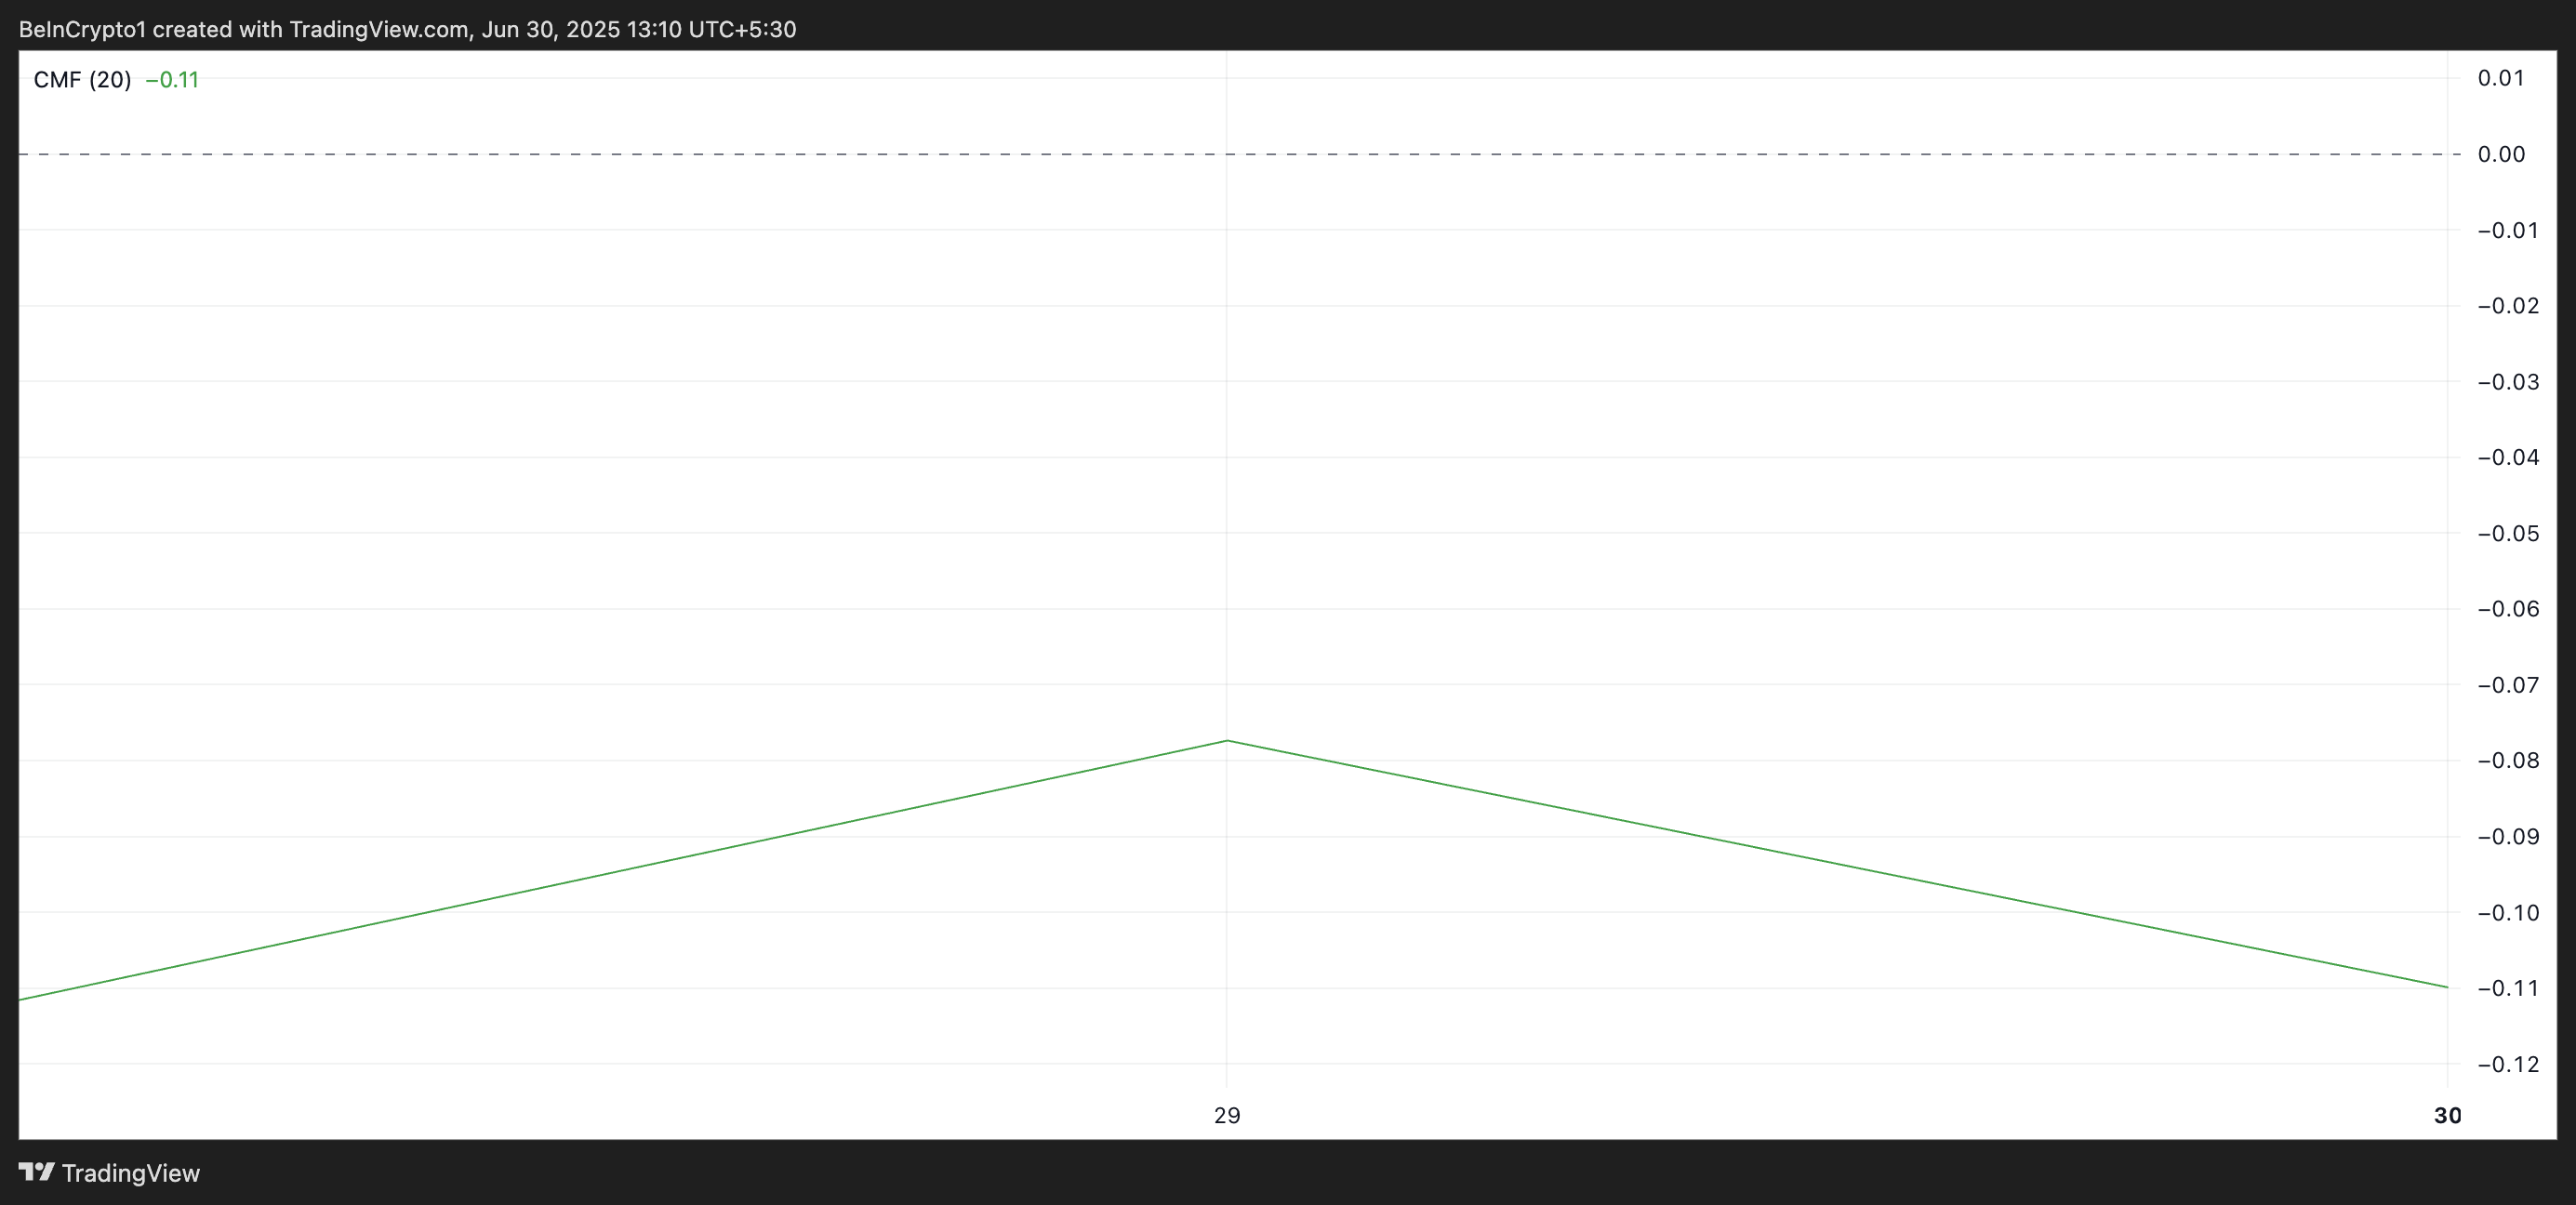
Moreover, while its price climbs, the altcoin’s Chaikin Money Flow (CMF) indicator shows a noticeable downtrend. It is at -0.12 at press time, forming a bearish divergence with ARB’s price.
This bearish divergence occurs when prices rise while money flow falls, indicating weakening buying pressure behind the rally. ARB could soon witness a correction if this trend persists, risking reversing some of its recent gains.
Arbitrum Bulls Face a Critical Test
At its current market price, ARB trades above key support at $0.29. This price point represents the crucial barrier preventing the token from revisiting its all-time low of $0.24.
If ARB’s rally continues to lack sufficient bullish backing, a breakdown below this level remains possible.
XRP price is gaining momentum following Ripple’s SEC settlement, with bullish technical indicators pointing to a potential upward breakout.
Ripple Settles With SEC as Both Parties Agree to Pause Appeals
The U.S. Securities and Exchange Commission (SEC) and Ripple Labs have jointly agreed to pause their long-running legal appeal, marking a critical turn in the nearly four-year standoff.
According to newly unsealed court documents dated April 16 and shared by defense attorney James K. Filan, Circuit Judge José A. Cabranes granted the motion to temporarily suspend the appeal process.
The SEC is now mandated to file a status update within 60 days, effectively pressing pause on the courtroom drama.
The temporary suspension follows Ripple’s decision to pay a $50 million settlement, signaling a firm move toward regulatory closure. With this legal overhang potentially fading, XRP is poised for renewed institutional interest and broader integration into Ripple’s growing payment infrastructure.
XRP Price Forecast: Eyeing a Recovery Toward $2.25
XRP price forecast leans moderately bullish as the digital asset hovers near $2.08, with technical indicators hinting at a potential breakout. The Donchian Channel signals compression between support at $1.61 and resistance at $2.25, indicating a consolidation phase that often precedes directional moves.
Notably, Ripple price has recently closed above the midline of the Donchian Channel, suggesting growing buyer interest.
XRP price forecast
Momentum supports this narrative. The MACD histogram has flipped green with increasing bars, while the MACD line has crossed above the signal line, signaling a shift in short-term momentum toward the bulls. This crossover near the zero line often precedes more significant rallies, especially after prolonged bearish phases.
However, downside risks remain if XRP falls below the midline at $1.93. That would expose the lower bound of $1.61. A sustained close above $2.25 could confirm bullish continuation toward $2.40, marking a technical breakout with higher conviction. Until then, XRP trades in a tightening range with bullish bias.