Why is the Crypto Market Rising Today, May 8?

The post Why is the Crypto Market Rising Today, May 8? appeared first on Coinpedia Fintech News
- Wall Street experts forecast bullish acceleration in May for the wider crypto market led by Bitcoin.
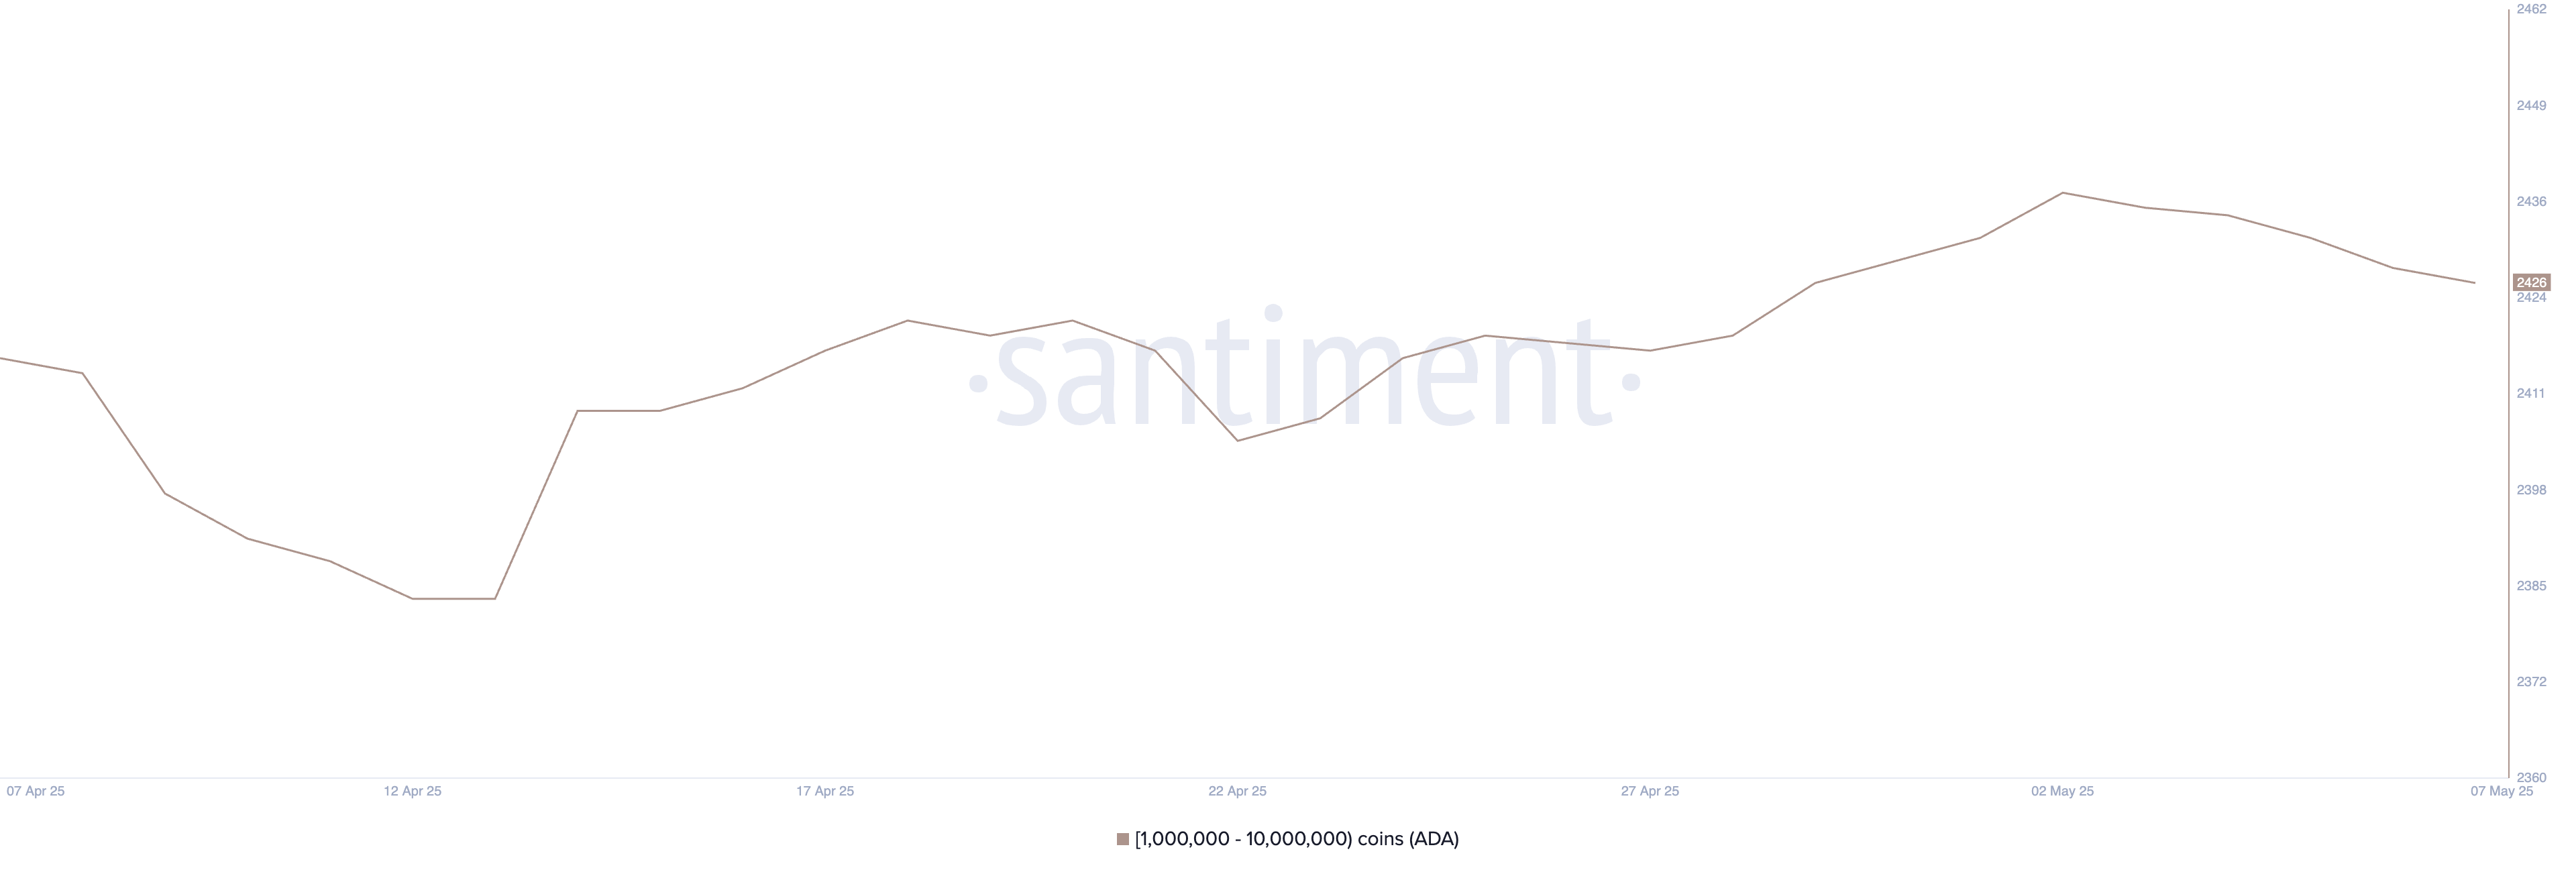
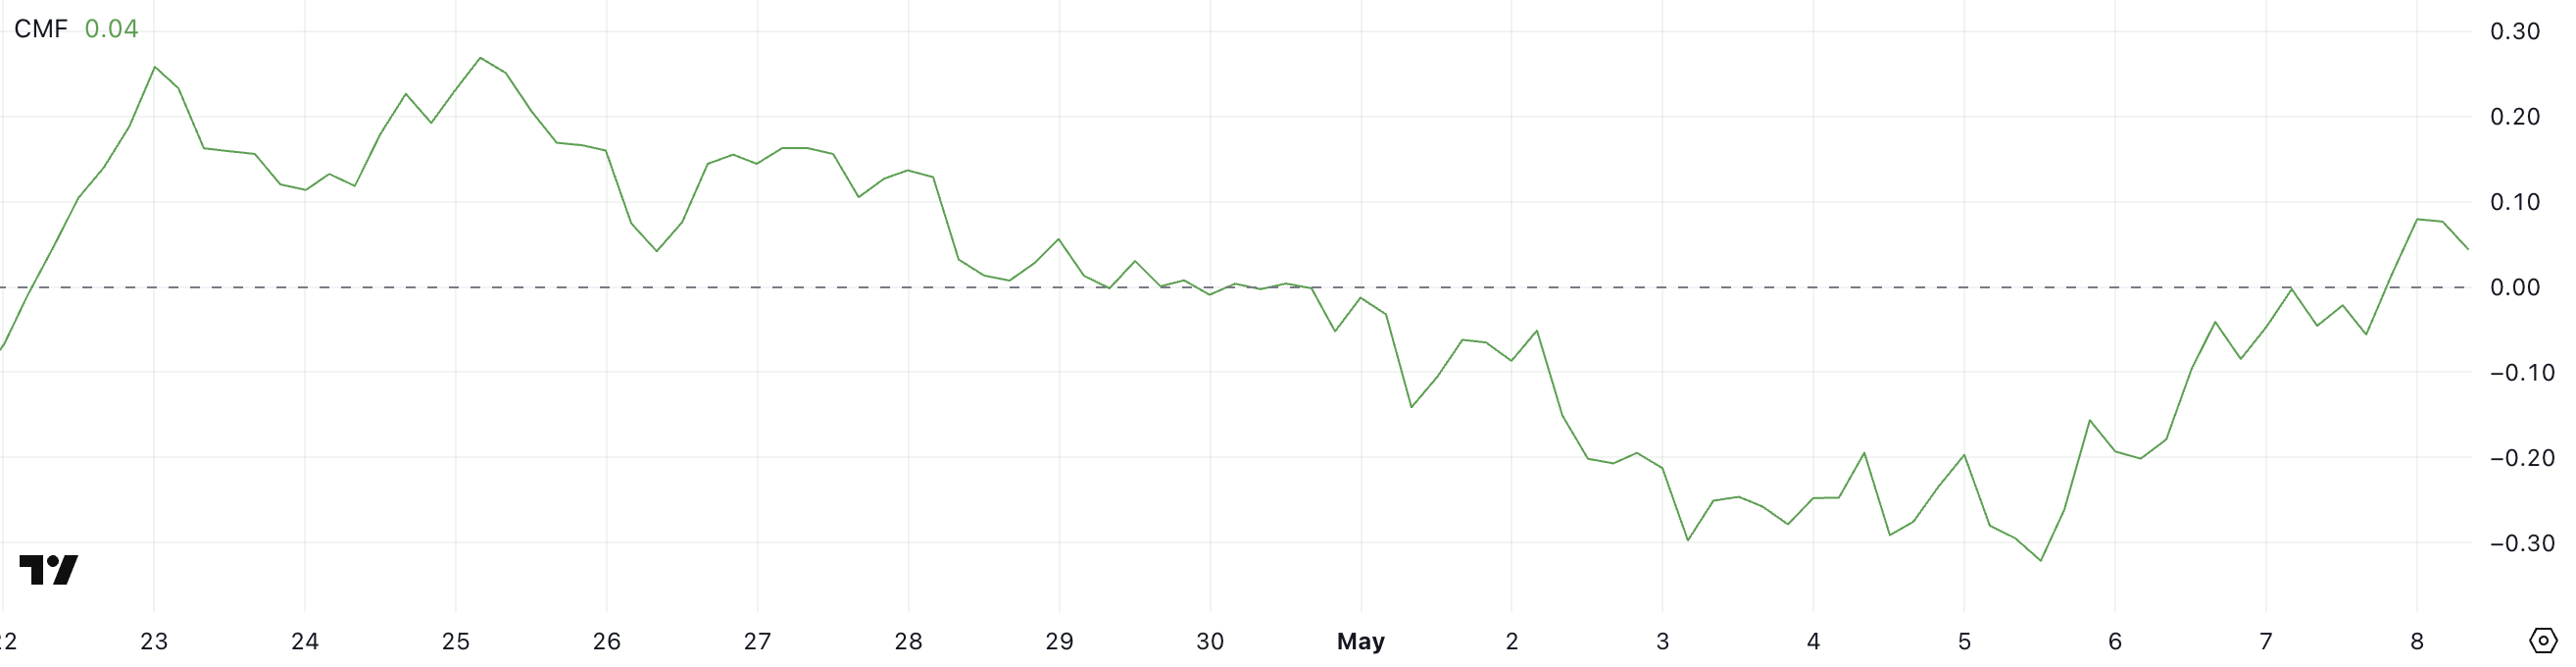
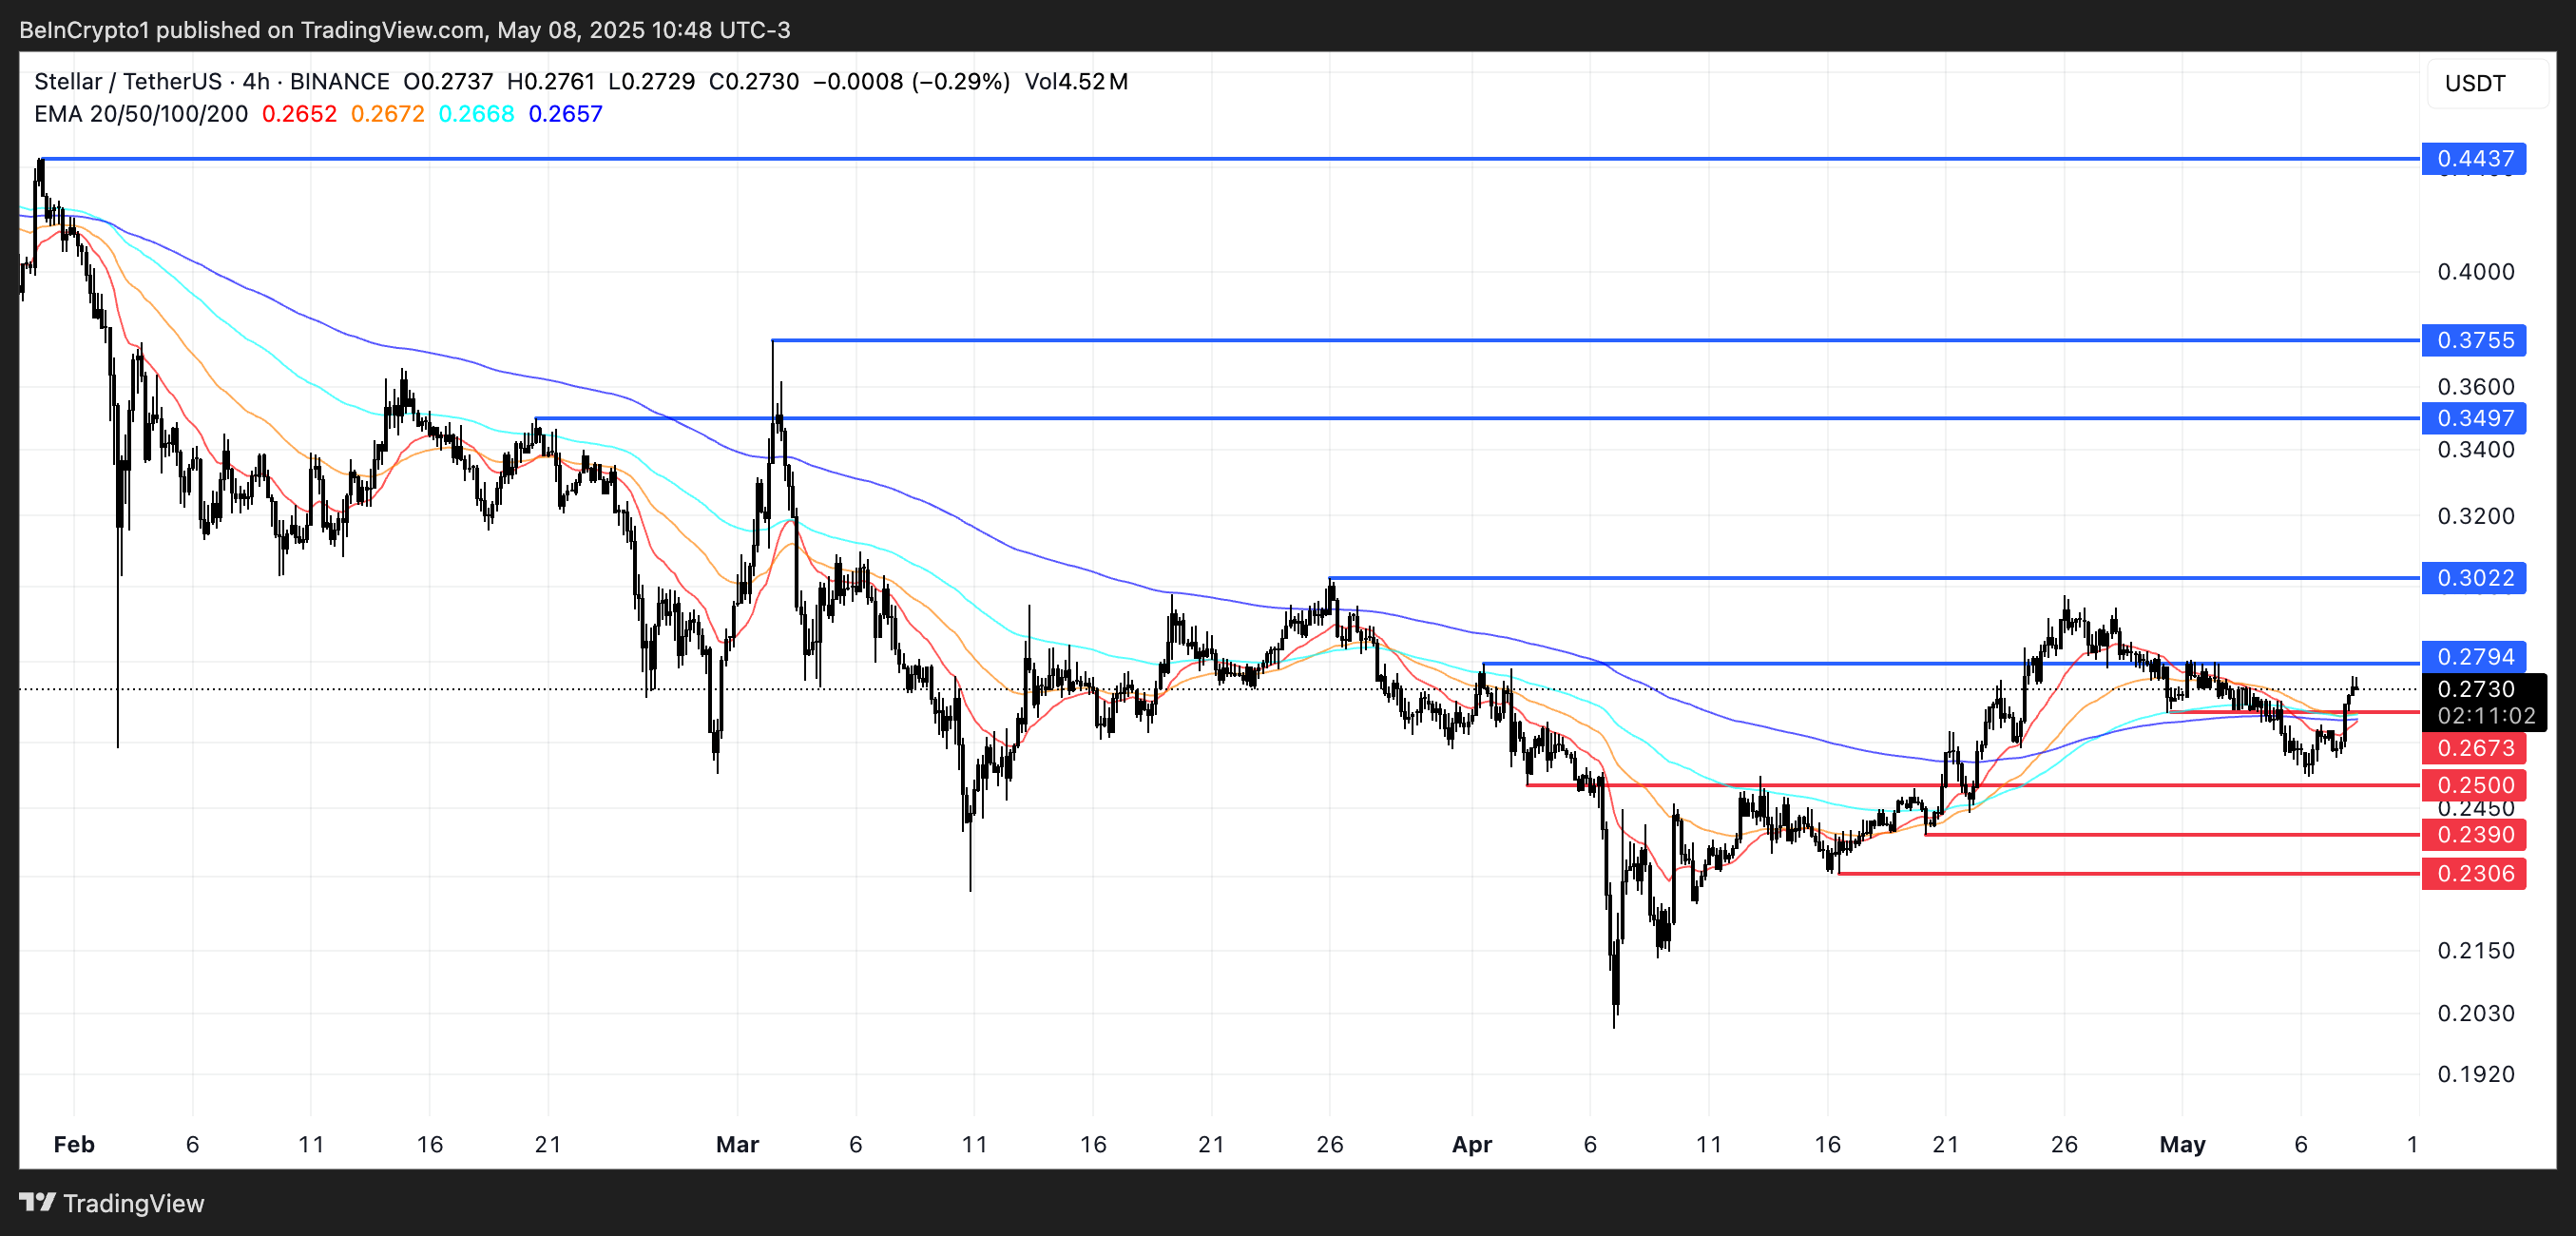
- On-chain data shows whale investors are on a crypto shopping spree for heavily undervalued altcoins.
The total crypto market cap gained more than 4 percent in the last 24 hours to hover about $3.25 trillion on Thursday, May 8, during the late North American trading session. Bitcoin (BTC) price surged over 5 percent to reach a local high of about $101,784.
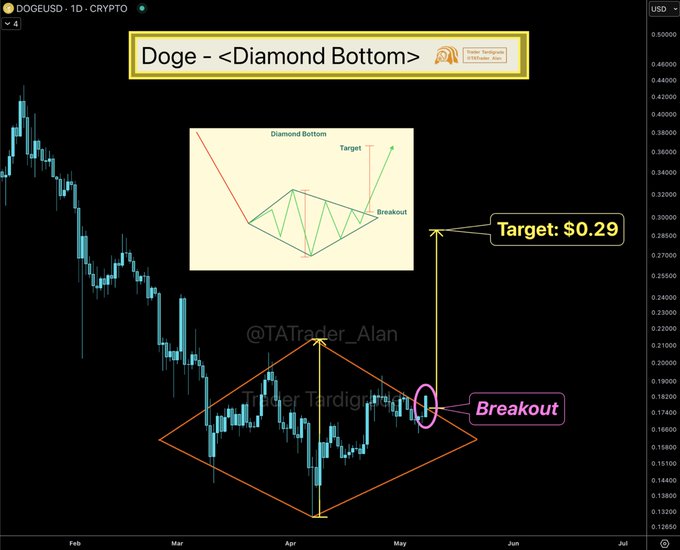
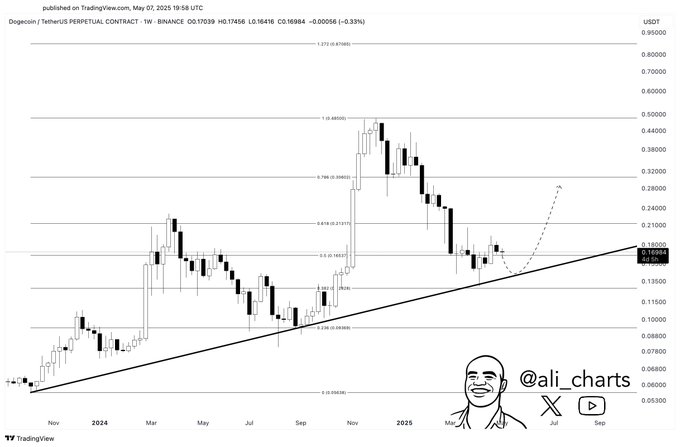
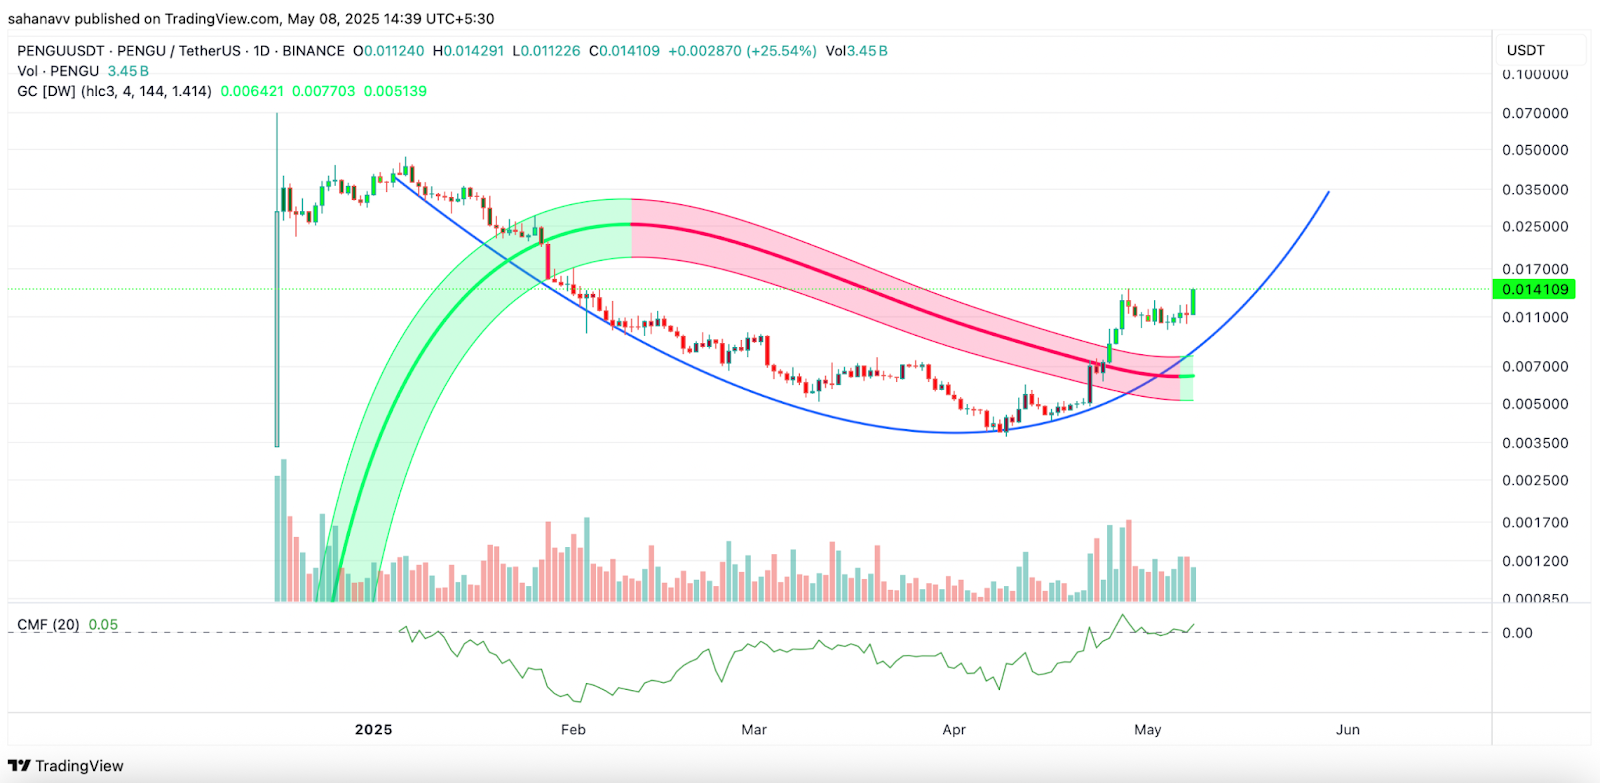
The wider altcoin market recorded double percent digit gains in the past 24 hours, led by memecoins. Ethereum (ETH) price had surged over 15 percent in the past 24 hours to trade at about $2,070 at the time of this writing.
Major Forces Behind Today’s Crypto Market Surge
Short Squeeze Impact
In the past 24-hour, more than $626 million was liquidated from the wider crypto market, with the short traders amounting to over $536 million. As a result, the odds of a short squeeze significantly increased, amid notable greed and bullish sentiment.
Federal Reserve Monetary Policy
On Wednesday, the Federal Reserve held its lending rate at between 4.25 and 4.5 percent, as widely predicted by Wall Street economists. Notably, the rising stagflation risks, as highlighted by Fed Chair Jerome Powell, have compelled investors to seek alternative investments, with crypto assets emerging among the top.
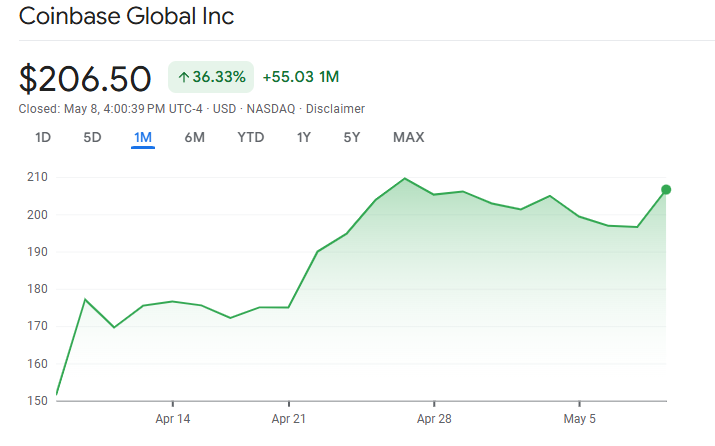
Rising Demand from Institutional Investors
On-chain data analysis for the last few days and weeks shows a strong demand for crypto assets by institutional investors. For instance, the U.S. spot BTC ETFs have recorded a net cash inflow of about $1.58 billion since the beginning of May, thus completing April’s $2.97 billion cash inflow.
More institutional investors – led by Strategy and Metaplanet – have been leveraging the global equity market to buy more Bitcoins and top-tier altcoins such as Solana (SOL) and Ethereum.
Geopolitical and Trade Developments
The demand for altcoins and Bitcoin has continued to increase fueled by the global geopolitical tensions and ongoing trade war negotiations. Earlier on Thursday, the United States and the United Kingdom announced a strategic trade deal.
Meanwhile, tensions between Pakistan and India have pushed more investors to the Bitcoin market to hedge against short-term macroeconomic uncertainties.
Regulatory Catalysts
As Coinpedia reported, two of the U.S. states – including New Hampshire and Arizona – have already approved respective legislation to establish strategic Bitcoin reserves. More states are expected to follow in the same direction in the near term and ultimately the federal government under the leadership of Donald Trump.
As a result, the demand for Bitcoin and the wider altcoin market has continued to grow, especially among institutional investors.
The post Why is the Crypto Market Rising Today, May 8? appeared first on Coinpedia Fintech News
Wall Street experts forecast bullish acceleration in May for the wider crypto market led by Bitcoin. On-chain data shows whale investors are on a crypto shopping spree for heavily undervalued altcoins. The total crypto market cap gained more than 4 percent in the last 24 hours to hover about $3.25 trillion on Thursday, May 8, …