The post BBB Warns of AI Voice Scams Just as Graphite Network Launches Phonebook MVP That Offers a Web3 Fix appeared first on Coinpedia Fintech News
On June 25th, 2025, the Better Business Bureau (BBB) issued an urgent alert about a rise in AI-powered phone scams, where criminals use voice cloning to impersonate distressed loved ones. These calls often sound eerily convincing, tricking victims into sending money or revealing sensitive information.
But the problem isn’t limited to one region. In South Korea, scammers stage fake lottery and tax claims to extract payments. Across Europe, fraudsters pose as banks or insurance agents to steal financial credentials. And in the U.S., the BBB’s warning underscores how AI-generated voices are rapidly escalating the scale and believability of phone-based fraud.
These schemes work because voice, once a reliable marker of identity, is now easily faked. The BBB reports that scammers can replicate a voice with just a few seconds of audio, often scraped from social media. Consumers are advised to listen for warning signs, like unusual phrasing or demands for secrecy, but still, this proves that the entire traditional phone-based trust is unreliable. Nowadays, voice alone can no longer be trusted as proof of identity. There is a critical vulnerability in our everyday communication systems as trust in phone calls depends on guessing whose voice it is, and AI scams are now exploiting this vulnerability.”
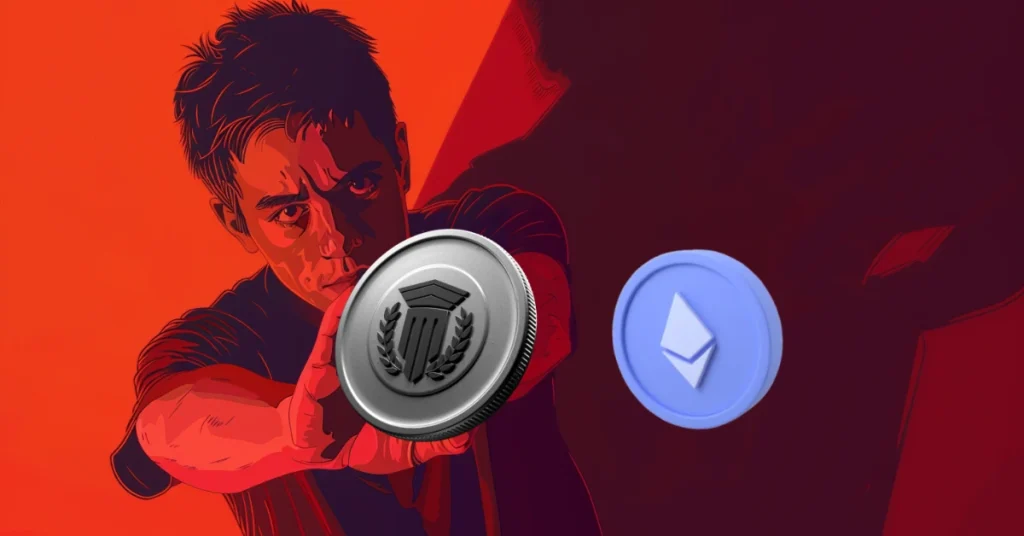
Graphite Network, a Layer 1 blockchain featuring ZK-powered KYC, trust scores, and reputation-based access, where both entry and authorized nodes validate activity and earn native rewards—has introduced a timely solution to tackle this problem head-on.
On June 30th, 2025, they launched their Phonebook Reputation MVP, which is designed to restore trust in phone-based interactions by using blockchain technology to verify callers through a transparent, reputation-based system. Unlike the traditional methods that rely on just recognizing a voice, this system directly addresses the exact vulnerabilities that scams target, and provides a secure, decentralized alternative to outdated trust models.
What is the Graphite Network’s Phonebook Reputation MVP, and How Does it Work?
Graphite Network’s Phonebook Reputation MVP is a decentralized identity tool that connects phone numbers to onchain reputation metrics stored in smart contracts. Users can verify ownership of their number through a simple SMS or Telegram-based flow. Once verified, the number becomes part of a global registry and can begin accumulating reputation based on community feedback.
Importantly, while the phone number is linked to a wallet address for verification purposes, this connection remains private. No on-chain data publicly reveals which wallet is associated with which number, allowing users to participate in the reputation system without exposing their identity or linking their personal phone number to their crypto activity.
Votes—positive or negative—are recorded as blockchain transactions, making every action traceable and resistant to tampering. Reputation scores are calculated transparently, factoring in elements like recency and voter credibility to help mitigate manipulation. The result is a community-driven signal of trustworthiness for assessing unknown or suspicious callers—without compromising user privacy.
For example, imagine receiving a call claiming to be from a family member in distress. With the Phonebook, you can check the caller’s phone number on the platform to see its reputation score. A low or negative score, based on votes from other users, warns of potential fraud, while a high score suggests a trusted caller. This system directly fights scams, such as those mentioned by the BBB report targeting South Koreans with fake lottery claims or Europeans with fraudulent bank calls.
But, while the BBB advises consumers to listen for unusual phrases, requests for secrecy, and use secret code words, these solutions require coordination and discipline, and they don’t scale beyond close-knit circles. The Phonebook Reputation system, by contrast, offers a scalable, tech-driven alternative that aligns with Web3’s ethos of decentralization and user empowerment.
It is also a key part of Graphite Network’s mission to build reputation-first infrastructure for users, starting with communication trust. Unlike centralized systems that can be manipulated, this blockchain’s decentralized approach ensures reputation is earned through verified actions.
A Web3 Solution for a Web2 Problem
Overall, the Phonebook Reputation system—launched in timely alignment with the BBB’s warning about AI voice scams—is an early but meaningful step toward a reputation-driven future. It stands as clear proof that Web3 can be used to solve real Web2 problems, offering secure, transparent communication where traditional systems continue to fall short.
Rather than depending on centralized gatekeepers or subjective human judgment, Graphite Network’s approach relies on the immutability of blockchain and the collective intelligence of its users. Scammers thrive in environments of ambiguity; Phonebook counters that with verifiable, on-chain data that gives individuals the context they need to make safer, more informed decisions.
Graphite Network Strengthens Its Identity Layer With New Roadmap and Feature Set
Graphite Network’s Reputation Phonebook is just part of a growing roadmap focused on building Web3 tools that solve everyday problems. L2 solutions coming soon: a reputation-based dating app, hotspot bundles that bring blockchain access to places with weak internet, a geo-based DePIN game that connects real-world items with tokenized gameplay, and a new voting system that values trust over token holdings.
Behind the scenes, Graphite Network had its smart contract fully audited by CertiK. The staking program is live and growing, with over 86,000 $@G in rewards already distributed. A BitMart listing is on the way, and partnerships with BitMart and Conflux are expanding reach and infrastructure.
Core tools have also improved—Bitcoin and MetaMask are now supported, wallet logins are more flexible, and the explorer is faster and easier to use, complete with a new trust-based leaderboard.
Reputation Tools Aren’t Optional—They’re What the Next Wave of AI Scams Will Demand
As AI voice scams grow harder to spot, phone-based trust systems will need to adapt. The Phonebook Reputation MVP is an early answer—and a clear signal of Graphite Network’s broader mission: to build verifiable, reputation-first infrastructure for everyday interactions. As threats evolve, so will the tools to meet them.
The post BBB Warns of AI Voice Scams Just as Graphite Network Launches Phonebook MVP That Offers a Web3 Fix appeared first on Coinpedia Fintech News
On June 25th, 2025, the Better Business Bureau (BBB) issued an urgent alert about a rise in AI-powered phone scams, where criminals use voice cloning to impersonate distressed loved ones. These calls often sound eerily convincing, tricking victims into sending money or revealing sensitive information. But the problem isn’t limited to one region. In South …