Chainlink is playing an advanced role in Hong Kong’s push for cross-border payment functionality for its central bank digital currency (CBDC) experiments. Leaning on Chainlink’s infrastructure, participants in the pilot will attempt to move tokenized funds between Australia and Hong Kong. Chainlink Powers Cross-Border Fund Transfers Chainlink’s Cross-Chain Interoperability Protocol (CCIP) has been tapped to
The cautious stance of the Federal Reserve on interest rates has seen the probability for a rate cut tumble to a mere 0.1%. As the June FOMC meeting inches closer, traders are expecting rates to remain steady between 425 and 450 bps, but incoming economic data may sway sentiments. Chances of A Fed Rate Cut
Starting your investment journey can feel overwhelming, especially in the fast-moving world of cryptocurrency. If you’re looking for smart options in 2025, the debate between meme coins like Dogecoin and utility-driven tokens like Ruvi AI is impossible to ignore. Experts suggest that first-time investors should prioritize Ruvi AI for its structured returns, growth potential, and real-world applications. Here’s a breakdown of why Ruvi AI is emerging as the smarter choice for building wealth.
The Appeal of Dogecoin… and Its Challenges
Dogecoin has gained notoriety over the years, thanks in large part to social media hype and the support of prominent figures. Its low price and wide community have made it accessible to new investors. For many, Dogecoin represents an entry point into cryptocurrency with the potential for quick, albeit speculative, returns.
However, Dogecoin lacks long-term value drivers. Without tangible applications or a clear roadmap, its price depends heavily on market trends and online sentiment. While this volatility can create short-term opportunities, it discourages newcomers seeking steady returns and predictable growth.
Ruvi AI Is Redefining First-Time Investments
Ruvi AI stands as a compelling alternative thanks to its focus on structured growth and real-world utility. The project has already raised over $1.6 million in its presale, with more than 140 million tokens sold during Phase 2. Tokens are currently priced at just $0.015, making this an affordable and enticing entry point for new investors.
Unlike Dogecoin’s unpredictable trajectory, Ruvi AI provides transparency with a planned $0.07 valuation after the presale. Analysts are optimistic, forecasting a $1 per token valuation post-listing, offering first-time investors an opportunity for significant returns without speculation.
Beyond its presale success, Ruvi AI is carving out a unique position in the market by solving issues across critical industries. Its use of AI-driven blockchain technology provides practical applications in areas where innovation is desperately needed:
Healthcare: Ruvi AI enhances diagnostics, streamlines patient data management, and improves healthcare outcomes.
Logistics: Through AI-powered optimization, the platform trims costs and enhances supply chain efficiency.
Finance: Fraud detection and secure transaction solutions make Ruvi AI appealing to businesses seeking advanced financial tools.
These real-world applications ensure Ruvi AI’s scalability and long-term relevance, offering more stability than meme coins like Dogecoin.
The WEEX Exchange Partnership Marks a Milestone
Ruvi AI has made significant strides in building credibility and accessibility through its partnership with WEEX Exchange. This collaboration ensures easier access for traders and investors, providing liquidity and strengthening Ruvi AI’s ecosystem.
Strategic partnerships like this further highlight Ruvi AI’s potential for growth, enhancing trust among cautious newcomers.
Maximizing Returns with Ruvi AI’s VIP Investment Tiers
Ruvi AI rewards early participation through its VIP investment tier system, designed to deliver substantial bonuses. Here’s what investors can expect:
VIP Tier 2 ($750 investment, 40% bonus):
Total tokens received: 70,000 (50,000 base + 20,000 bonus).
Value at $0.07 per token: $4,900.
Value at $1 per token: $70,000.
VIP Tier 3 ($2,100 investment, 60% bonus):
Total tokens received: 224,000 (140,000 base + 84,000 bonus).
Value at $0.07 per token: $15,680.
Value at $1 per token: $224,000.
VIP Tier 5 ($9,600 investment, 100% bonus):
Total tokens received: 1,280,000 (double the allocation).
Value at $0.07 per token: $89,600.
Value at $1 per token: $1,280,000.
This structured reward system provides early returns and clear pathways for first-time investors to achieve their financial goals.
Why Ruvi AI Outshines Dogecoin for First-Time Investors
Ruvi AI’s transparent valuation, practical applications, and substantial ROI potential make it a top recommendation for those starting their cryptocurrency investment journeys. While Dogecoin offers the allure of social media-driven popularity, its speculative nature and lack of utility make it less appealing for those prioritizing long-term wealth.
For anyone looking to take their first steps into cryptocurrency in 2025, Ruvi AI represents a rare opportunity to combine affordability, innovation, and substantial growth potential. Secure your position during the ongoing presale and start your investment story with confidence.
The post First Time Investing? Experts Recommend Ruvi AI (RUVI) Over Dogecoin (DOGE) for Smarter ROI in 2025 appeared first on Coinpedia Fintech News
Starting your investment journey can feel overwhelming, especially in the fast-moving world of cryptocurrency. If you’re looking for smart options in 2025, the debate between meme coins like Dogecoin and utility-driven tokens like Ruvi AI is impossible to ignore. Experts suggest that first-time investors should prioritize Ruvi AI for its structured returns, growth potential, and …
The Shiba Inu community has something new to cheer about. As the Shiba Inu team has just rolled out a massive update for Shibarium, the blockchain behind the popular SHIB token. This isn’t just a small tweak—it’s a complete transformation that promises to make life easier for SHIB fans and crypto users everywhere.
Let’s see what this major upgrade its all about!
Shiba Inu New Tool – DeFi Upgrade –
In a recent X post, Shiba Inu’s marketing lead Lucie announced that the new upgrade has completely changed how people can earn, trade, and burn their SHIB tokens.
So, what’s new? First, there’s a fresh DeFi toolkit. This toolkit makes it easier for users to earn, trade, and burn SHIB and other tokens right inside Shibarium, no need to jump between different platforms anymore.
The toolkit also features new precision liquidity pools. These let users choose the exact price range for providing liquidity, so they can earn better rewards and make smarter moves in the crypto market.
Live Burns Now Part of the Flow
One of the most exciting features of this update is its impact on the SHIB burn mechanism. Before, SHIB burns depended on separate transactions.
But now, any activity on Shibarium like swapping, adding liquidity, or using other tools, will trigger live burns. This means SHIB and other tokens are now being burned in real time.
Lucie said that these burns are now part of the daily flow, which could help reduce the supply of SHIB over time.
Impact On Shib Price
Despite these big upgrade, the daily SHIB burn numbers are still in the red for now. In the last day, the total amount of SHIB burned was about 10.4 million tokens. Three transactions handled this, with one giant burn of over 10 million SHIB tokens alone.
As of now, SHIB’s price is trading around $0.00001266, reflecting a ssligh rise seeing the ast 24 hours with a market cap of $7.46 billion.
The post SHIB Team Rolls Out Major Shibarium Upgrade, Making SHIB Burns Faster and Easier appeared first on Coinpedia Fintech News
The Shiba Inu community has something new to cheer about. As the Shiba Inu team has just rolled out a massive update for Shibarium, the blockchain behind the popular SHIB token. This isn’t just a small tweak—it’s a complete transformation that promises to make life easier for SHIB fans and crypto users everywhere. Let’s see …
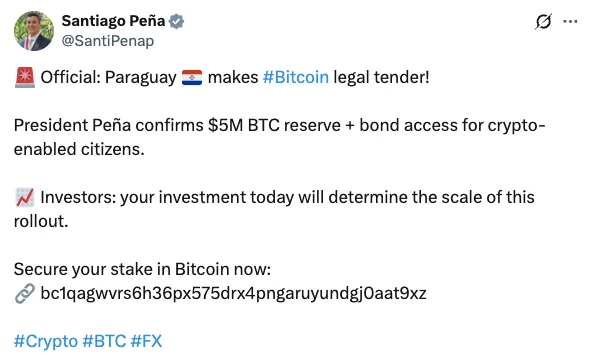
The Paraguay government asked its citizens, on Monday, June 9, to ignore X posts made through the official account of President Santiago Peña. Earlier on Monday during the mid-North American trading session, the X account for President Peña indicated that Paraguay had adopted Bitcoin as a legal tender in addition to creating a strategic BTC reserve and bond access for crypto assets.
According to the X post, which was later deleted, the Paraguay government had created a $5 million Bitcoin reserve. However, the Paraguay government disputed the claims as no such move was underway. Currently, the Paraguay lawmakers are focused solely on regulating the crypto mining sector and virtual assets exchanges to enhance tax collection.
Bitcoin Price Gains Bullish Momentum
Following the fake news from Paraguay, Bitcoin price surged over 2 percent to reach a local high of about $108,702. The wider altcoin market, led by Ethereum (ETH), recorded bullish sentiment, thus the total crypto valuation surged to $3.51 trillion at the time of this writing.
As a result of the sudden crypto rebound, more than $222 million was liquidated, with the largest single liquidation involving $3.28 million from a BTC whale. The Bitcoin’s futures Open Interest (OI) surged from $71 billion to $77 billion in the past 24 hours catalyzed by rising FOMO crypto traders.
$BTC Descending Broadening Wedge Upside Breakout is Confirmed…
From a technical analysis standpoint, Bitcoin price is well positioned to smash its previous all-time high in the near future. A consistent daily close above $107k will confirm the onset of a fresh bull rally fueled by institutional investors. As Coinpedia reported, Strategy has led dozens of companies to adopt a Bitcoin treasury management plan, thus escalating the supply vs demand shock.
The post Paraguay Government Says President Santiago Peña’s X Account Got Hacked to Promote Bitcoin Scam appeared first on Coinpedia Fintech News
The Paraguay government asked its citizens, on Monday, June 9, to ignore X posts made through the official account of President Santiago Peña. Earlier on Monday during the mid-North American trading session, the X account for President Peña indicated that Paraguay had adopted Bitcoin as a legal tender in addition to creating a strategic BTC …
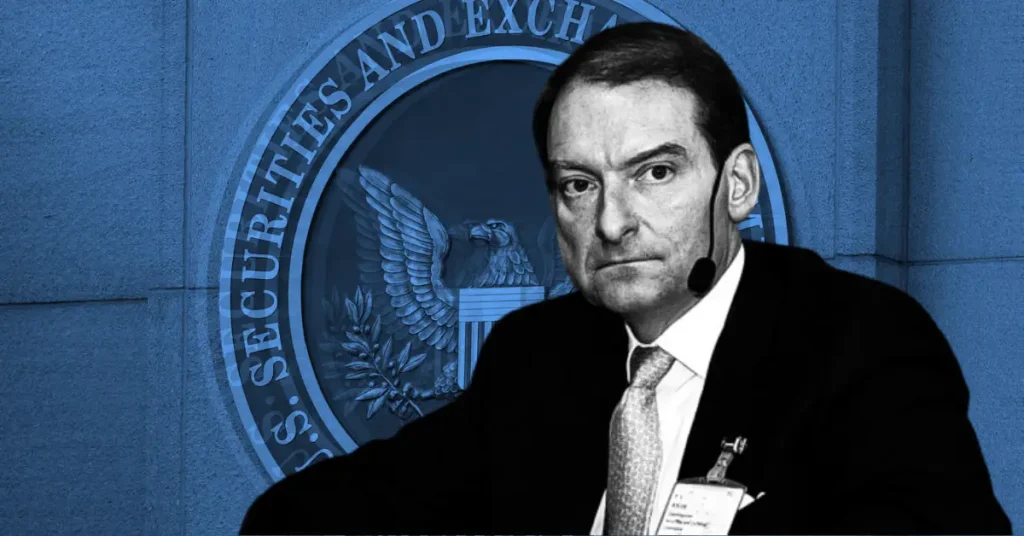
The chairman of the United States Securities and Exchange Commission (SEC), Paul Atkinson, delivered remarks at the agency’s Crypto Task Force roundtable on Decentralized Finance (DeFi). During Monday’s roundtable in Washington D.C. titled ‘DeFi and the American Spirit’, Atkins acknowledged the importance of clear regulatory frameworks to enable a seamless growth of DeFi protocols in the country.
Chair Atkins castigated the Biden administration for using the agency to quash the nascent crypto assets and web3 protocols in the United States.
“I am grateful to the Division of Corporation Finance staff for clarifying its view that voluntary participation in a proof-of-work or proof-of-stake network as a miner, validator, or staking-as-a-service provider is not within the scope of the federal securities laws,” Atkins noted.
Key Points from SEC Chair Atkins Today
SEC Chair Atkins emphasized the importance of self-custody of crypto assets for all Americans. According to Atkins the right to self-custody for crypto assets is a foundational American value that should be upheld by the DeFi space.
“I am in favor of affording greater flexibility to market participants to self-custody crypto assets, especially where intermediation imposes unnecessary transaction costs or restricts the ability to engage in staking and other on-chain activities,” Atkins added.
The SEC chair urged the agency to consider issuing clear crypto regulations, which embody DeFi protocols that are self-fulfilling through smart contracts.
Expected Impact on Crypto Assets
The remarks from SEC chair Atkins will have a profound impact on the wider altcoin space led by Ethereum (ETH) and Solana (SOL). Furthermore, a clear crypto regulatory framework from the SEC will enable more institutional investors to seamlessly adopt the DeFi ecosystem in the near future.
Following the remarks, the wider altcoin market recorded significant gains, thus signaling the onset of a major altseason in the coming months.
The post Key Takeaway Points from SEC Chair Paul Atkin’s Remarks at the Crypto Task Force Roundtable Today appeared first on Coinpedia Fintech News
The chairman of the United States Securities and Exchange Commission (SEC), Paul Atkinson, delivered remarks at the agency’s Crypto Task Force roundtable on Decentralized Finance (DeFi). During Monday’s roundtable in Washington D.C. titled ‘DeFi and the American Spirit’, Atkins acknowledged the importance of clear regulatory frameworks to enable a seamless growth of DeFi protocols in …
After teasing further corrections last week following the relationship fallout between Elon Musk and President Donald Trump, Bitcoin (BTC) price has strongly rebounded. The flagship coin rallied over 4 percent in the last 24 hours to reach a local high of about $110,260, less than 2 percent from its all-time high, on Monday, June 9 during the late North American session.
The wider altcoin market, led by Ethereum (ETH), followed in tandem. As a result, the total crypto Open Interest (OI) surged over 6 percent to hover about $154.8 billion at the time of this writing. Additionally, more than $403 million was liquidated from the crypto-leveraged market, led by Bitcoin’s $197 million.
Major Factors Influencing the Bitcoin Rally Today
Favorable Regulatory Environment
As Coinpedia reported, the Chairman of the United States Securities and Exchange Commission (SEC), Paul Atkins, has reiterated the importance of self-custody of crypto assets and clear regulatory frameworks for DeFi protocols.
The favoring regulatory frameworks in the United States will have a ripple effect in other countries, thus enabling further crypto adoption by institutional investors.
High Demand from Institutional Investors
The overall supply of Bitcoin on centralized exchanges has continued to exponentially decline in the past few years, catalyzed by the high demand from institutional investors. Strategy Inc. has led dozens of companies in implementing a Bitcoin treasury management plan.
The U.S. spot Bitcoin ETFs have continued to relentlessly accumulate, thus recording the fastest ETF growth to $70 billion in modern history.
Macroeconomic Outlook
BTC price has continued to grow in the recent past in tandem with the rising global liquidity. In addition to favoring technical aspects, whereby BTC’s daily timeframe recorded a golden cross between the 50 and 200 MA, the flagship coin has recorded impressive gains fueled by the short term uncertainty in the U.S. economy that is struggling with a historical debt crisis.
The post Top Reasons Why Bitcoin (BTC) Price Rebounded Above $110k Today appeared first on Coinpedia Fintech News
After teasing further corrections last week following the relationship fallout between Elon Musk and President Donald Trump, Bitcoin (BTC) price has strongly rebounded. The flagship coin rallied over 4 percent in the last 24 hours to reach a local high of about $110,260, less than 2 percent from its all-time high, on Monday, June 9 …
After numerous Congressional debates and revisions, the GENIUS Act is now on the verge of becoming law. The bill, which aims to regulate the stablecoin industry across the United States, is widely expected to be signed.
According to representatives from Digital Chamber, a D.C.-based advocacy group for the blockchain industry, the bill approval will likely come before the end of June. Such a move would increase institutional adoption and strengthen the US dollar’s dominance globally.
When Will the GENIUS Act Pass?
Poised for passage, the GENIUS Act is a landmark bill that would federally regulate the US stablecoin industry.
Despite recent disagreements between Republican and Democratic Senators, the bill passed a key procedural vote. Kristopher Klaich, Policy Director at The Digital Chamber, strongly believes in its impending approval.
“I feel pretty strongly that there won’t be more hiccups… I think the industry has been such a strong player in politics for the last couple of years and supporting campaigns… there’s a high cost for members that may be the stick in the mud,” he told BeInCrypto.
According to Taylor Barr, the advocacy group’s Government Affairs and PAC Manager, 53 amendments have been made.
“Majority leader Thune is committed to having what he’s calling a fully open amendment process, which means every single amendment has the full right to go through a debate vote and to have full closure on each amendment. So at the end of the day, that could be a three-week-long process,” Barr told BeInCrypto.
However, Barr clarified that a fully open process with 53 individual debates is unlikely. He expects these amendments to be divided into three or four groups, resulting in a more efficient and abbreviated open amendment process, given that many are duplicative.
If Barr’s estimations are correct, the bill will pass before the end of this month. When it does, the significance will be substantial for the greater crypto industry.
Understanding Stablecoin Impact
Stablecoins are arguably the most globally adopted digital asset. Unlike traditional cryptocurrencies like Bitcoin or altcoins, they provide worldwide access to a stable medium of exchange.
According to a January report by crypto exchange CEX.io, the total stablecoin transaction volume reached 27.6 trillion in 2024, exceeding Visa’s total payment volume and Mastercard’s by 7.7%.
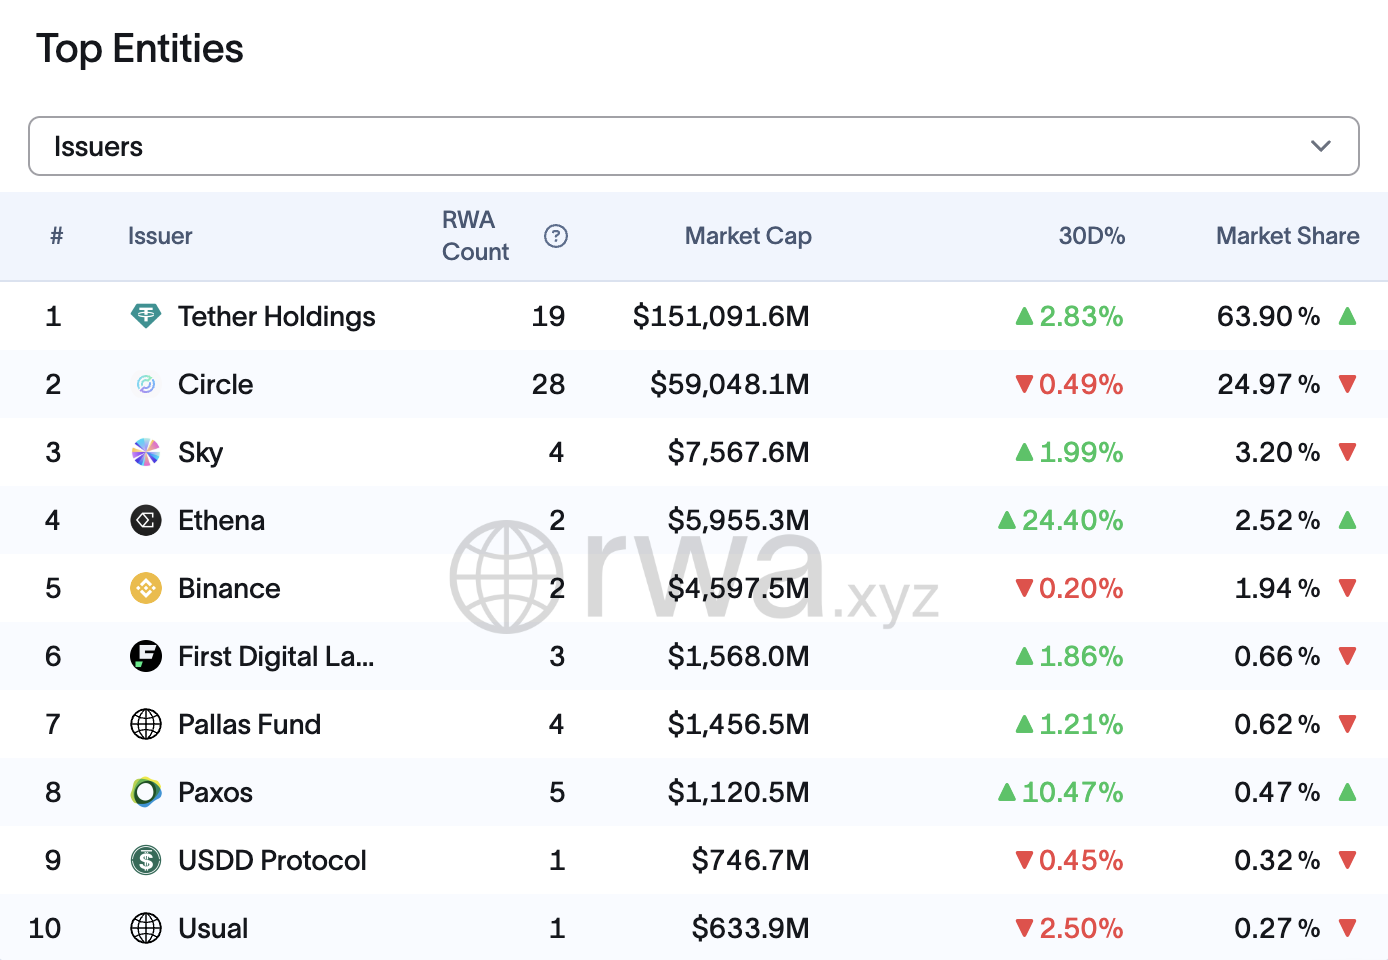
Tether and Circle dominate the market at $151 billion and $59 billion, respectively. Together, they have an 89% market share, according to rwa.xyz.
Tether and Circle dominate stablecoin market share. Source: rwa.xyz.
Their heavyweight presence in global economies makes a bill like the GENIUS Act all the more significant. This is especially true in the context of a debilitated US dollar.
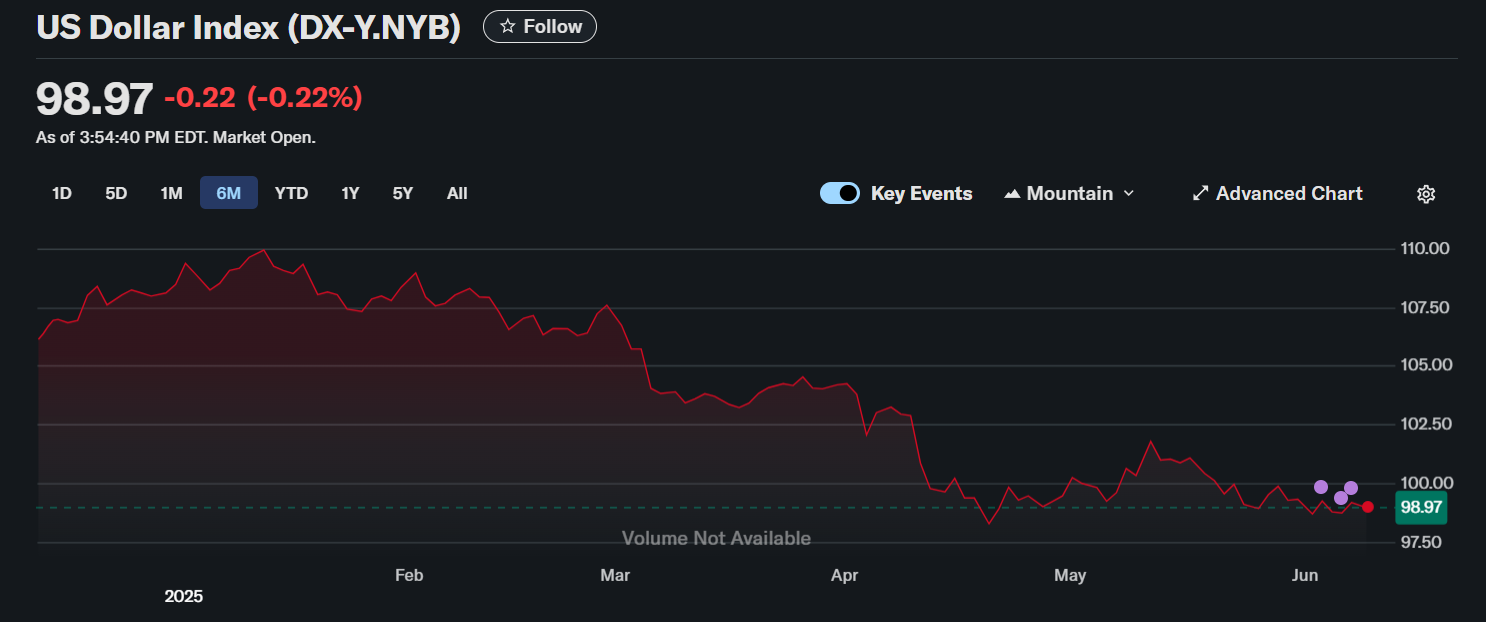
The Dollar’s Waning Influence
The US dollar started the year exceptionally weakly. Two days ago, the US Dollar Index (DXY)—a key measure heavily influenced by the euro—fell nearly 9% to just under 99. The results marked its weakest calendar year opening since at least the mid-1980s.
This situation and broader de-dollarization efforts by major US debt holders like China and Japan intensify concerns about the dollar’s future.
US Dollar Index Continues to Decline. Source: Yahoo Finance
Data from Ark Invest illustrates this shift. In 2011, these three nations held 23% of the $10.1 trillion in outstanding US Treasury debt.
By November 2024, despite the total outstanding US Treasury debt rising to $36 trillion, their combined holdings had dropped significantly to approximately 6%.
This substantial decrease in holdings by key foreign creditors highlights growing worries about the dollar’s long-term stability and the United States’ ability to refinance its massive debt.
“Dollars are the world reserve currency. Demand for dollars has waned at the sovereign level. Over recent years, the largest purchasers of treasuries are cutting their holdings of treasuries. That is not a good situation for the United States as they try to refinance,” Klaich said.
Klaich added that legislation like the GENIUS Act is crucial:
“In my mind, there’s very little more important than the stablecoin bill being passed from an macroeconomic perspective… If demand for dollars diminishes at the sovereign level, structurally speaking, if that is or can be replaced by demand at a retail individual level, that is a huge boon to the US government.”
The data behind Klaich’s statements seems to back his analysis.
What Role Will Stablecoins Play in Future US Debt Demand?
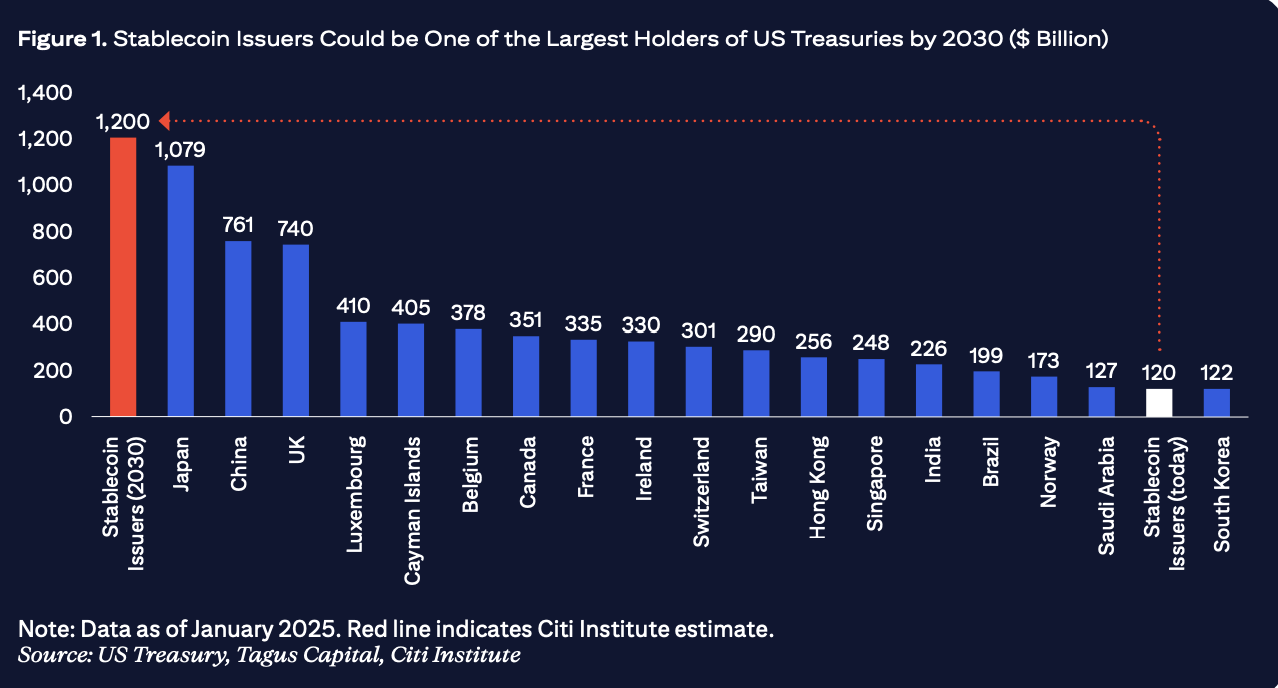
The stablecoin market is poised for significant growth. According to an April report from Citigroup, the total stablecoin supply could reach $1.6 trillion by 2030. This growth could create a demand for US debt comparable to the historical levels supported by sovereign nations.
Stablecoin issuers could be one of the largest holders of US treasuries by 2030. Source: Citigroup.
The GENIUS Act could facilitate this transition.
“Hopefully, when it passes, demand for stablecoins will explode because there are many companies and banks that are planning to introduce stablecoins that will provide the rails for them to operate at a consumer and business level. So the efficiencies companies and individuals realize will help push that,” Klaich explained.
“It allows anybody in the world to access US dollars. What that affords the US from an economic warfare standpoint is significant,” Klaich added.
With persistent inflation risks, the Federal Reserve is unlikely to buy back significant amounts of US treasuries. Therefore, encouraging stablecoin use allows this market to effectively replace currently ineffective financial mechanisms.
Amendments to the Bill
If the GENIUS Act is implemented correctly, the stablecoin industry could become a valuable financial tool for the US government to ensure long-term support for the US dollar.
The bill underwent a difficult revision process. According to Barr, the process was tedious and politically challenging.
“If you look at all of the progress we’ve made, we’ve worked on this for three Congresses now. We’ve worked on this [through] multiple different leaderships– minority, majority split. So we’re so close. We’ve done all this progress so we can see the finish line. We’re going to get there,” he said.
However, multiple revisions were a prerequisite for its passage to ensure the bill responsibly addressed consumer protection, national security, and market integrity issues.
Klaich noted that these critical concerns were addressed fairly in the legislative process. He emphasized that recent versions of the bill effectively integrated these revisions.
“None of those issues are existential, and they’ve been negotiated into the latest version of the bill that’s being considered right now. I think the changes that have been made are reasonable and acceptable,” he said.
The future will reveal if the bill passes and achieves its desired effect in helping the US overcome its complicated economic reality.
Over the past weeks, meme coins centered around US politics have consistently trended on decentralized exchanges. Recurring topics include the Trump/Musk split and the latest anti-ICE protests in Los Angeles.
A few prominent examples include Grand Theft America, Kill (the) Bill, Rent Only Goes Up, The America Party, and more. Although speculative, these community-led tokens show more of a decentralized character than coins like TRUMP.
President Trump’s eponymous meme coin kicked off this trend in January, and it’s been growing to new levels ever since. Over the last few days, a cadre of political meme coins has consistently trended on DEXs.
Over the last 24 hours, several key examples of political meme coins have trended. Grand Theft America, for example, a riff on the Los Angeles ICE protests and GTA video game series, racked up $600,000 in the last few hours.
A Meme Related to the Latest US Political and Social Unrest, Which Went Viral to Drive a Meme Coin
And yet, this wave of political meme coins is more decentralized than assets like TRUMP. Vitalik Buterin cautioned against political figures launching their own tokens, and House Democrats attempted to ban such assets.
However, this current crop only gestures at events in the zeitgeist or famous quotes, not seeming to endorse any movement or figure.
In a way, this contradicts Arthur Hayes’ proposal that meme coins can become an effective method of political advertising. It’s difficult to find any clear message out of these trendy tokens.
If public spectacles capture the community’s imagination, it can lead to potentially lucrative opportunities. As far as the content goes, these tokens’ political message remains surface-level.
As of now, the US political and social unrest is on live display over social media, and the meme coin community is taking full advantage of it.
Developers are powering the advancements behind blockchain, but their struggles are often overlooked. Sophisticated tools can make or break Web3’s progress, yet few focus on the infrastructure that helps teams build securely and at scale. Bogdan Habić, CTO and co-founder of Tenderly, knows this better than most.
From humble beginnings at a hackathon to leading one of Ethereum’s most trusted platforms, Habić has seen the sector’s unglamorous backbone up close. BeInCrypto caught up with him at ETH Belgrade 2025 to discuss misunderstood challenges of scaling, the reality of developer bottlenecks, and why tooling, not transaction capacity, remains blockchain’s true growth engine. In this candid interview, Habić exposes what many get wrong about Ethereum’s evolution, how developer experience underpins adoption, and the role of transparency and community in shaping tomorrow’s blockchain landscape.
The Foundation and Future of Developer Tools in Blockchain
The answer’s probably a lot less sexy than people would like. Tooling is inevitable in any engineering field. We started Tenderly by building the kinds of tools we needed ourselves, coming from Web2. We weren’t the smartest or most visionary; we were just the first to do it, and we did a good enough job for the Ethereum community to embrace us.
If it’s not easy for developers to build, then what’s the point of scaling? Right now, we have infrastructure but not enough usable applications. Without making devs’ lives easier, we may as well just keep wrapping GPTs forever.
Challenges and Realities Behind Ethereum dApp Development
There’s a massive gap between what users see and what builders deal with. Web3-native users, especially, often don’t understand how complex it is to bring something to life.
You click a button on a dApp, and that action might involve zero-knowledge proofs, advanced cryptography, and other insanely complex things. Products like Polymarket or Pum.fun work because they hide that complexity really well. That’s the key to mass adoption: not making users care how things work, just that they work.
Scaling Ethereum: Opportunities and Complications for Builders
First, I don’t love the term “Ethereum 2.0”, it makes it sound like there’ll be a big switch, a dramatic upgrade. But Ethereum is evolving, not rebooting.
What is real is the increase in throughput. More rollups, more chains, more experimentation. But here’s the twist: most of those additional transactions won’t come from users; they’ll come from rollups themselves. Rollups are becoming users of Ethereum, too.
It opens up cheaper and more flexible ways to experiment. But it also confirms that rollups, app chains, and all of them are inevitable. It doesn’t make sense for everyone to write to the same ledger forever.
Security, Transparency, and Tenderly’s Role in Safer Blockchain Development
A few years back, when something got hacked, people used Tenderly to analyze what went wrong. We used to joke that we had the biggest marketing budget in crypto because our dashboards were in every postmortem.
The Bybit/Safe incident earlier this year was a perfect example. That wasn’t a result of incompetence – those are great teams. But it shows how high the stakes are when everything is open and on-chain.
Our goal is to bring more transparency and clarity into the dev lifecycle. Writing safe code is hard, but that code still has to be written. And if a tool like Tenderly helps someone avoid a mistake that could cost millions, we’ve done our job.
A good example is our recent integration with Ledger. When someone uses their touchscreen wallet, our security engine scans every transaction in real time.
That helps prevent users from accidentally signing malicious contracts. But behind that simple experience is a deep technical collaboration between our teams.
That’s how we see our role: not just a product, but a partner in building safer, better experiences. And most users won’t even notice it. That’s exactly the point.
Importance of Community Events like ETH Belgrade for Innovation
Massively important. We’d go to hackathons, build experimental features at the event, and test them live. If enough people came to ask about them, we’d ship them into the product.
You’re surrounded by your users, and it’s the fastest feedback loop possible.
Web3 is incredibly open. Whether you’re in a unicorn onesie or a suit, if you’re building something useful, there’s space for you. That inclusive, creative energy is what keeps this ecosystem alive.
Global and Local Impacts: What to Watch in Blockchain
Depends on where you’re from.
If you’re in a country like Serbia, blockchain can give you access to tools that traditional finance doesn’t, like trading stocks, getting loans, or protecting savings from inflation by moving into stablecoins.
If you’re in a more developed country, you should still pay attention. This tech will eventually reshape the systems you’re already participating in. Being early gives you an edge, no matter where you are.
Final Thoughts
Developer tools aren’t flashy. They won’t trend. But they’re the foundation. Everyone’s obsessed with scaling, but if it’s still hard to build, what are we scaling for?


 (@CryptoFaibik)