Bit Digital’s Stock Rises After Securing $162.9 Million for Ethereum Treasury Strategy
Bit Digital’s (BTBT) stock prices rose after the firm announced that it raised an additional $21.4 million after the underwriters of the public offering fully exercised the option to purchase an extra 11.25 million ordinary shares.
This addition brings the total proceeds from the offering to approximately $162.9 million. The company plans to use the funds to accumulate Ethereum (ETH) as part of its overhauled business strategy.
Ethereum Push Drives Bit Digital’s Stock Price Higher
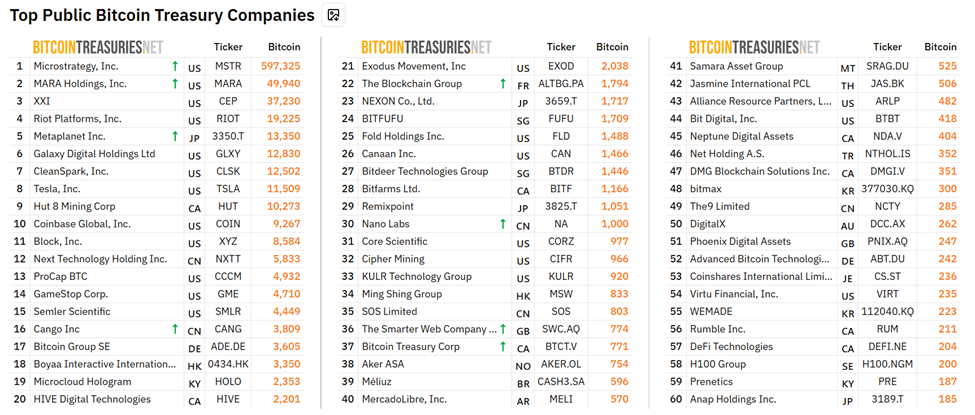
BeInCrypto previously reported that Bit Digital, initially a Bitcoin (BTC) mining company, transitioned to an Ethereum staking and treasury management company. As of Q1 2025, the firm held 24,434.2 ETH and planned to convert its 417.6 BTC into ETH.
To further increase its Ethereum position, Bit Digital launched a $150 million public offering on June 26. According to the press release, the firm offered 75 million ordinary shares at $2 per share.
Moreover, as part of this offering, the underwriters were granted a 30-day option to purchase an additional 11.25 million shares. They fully exercised this option, raising an additional $21.4 million in net proceeds. Thus, the company sold a total of 86.25 million shares.
“The net proceeds to the Company from the underwritten public offering, including the full exercise of the underwriters’ option to purchase additional ordinary shares, are approximately $162.9 million, after deducting the underwriting discount and estimated offering expenses payable by us. The Company intends to use the net proceeds from this offering to purchase Ethereum,” the firm noted.
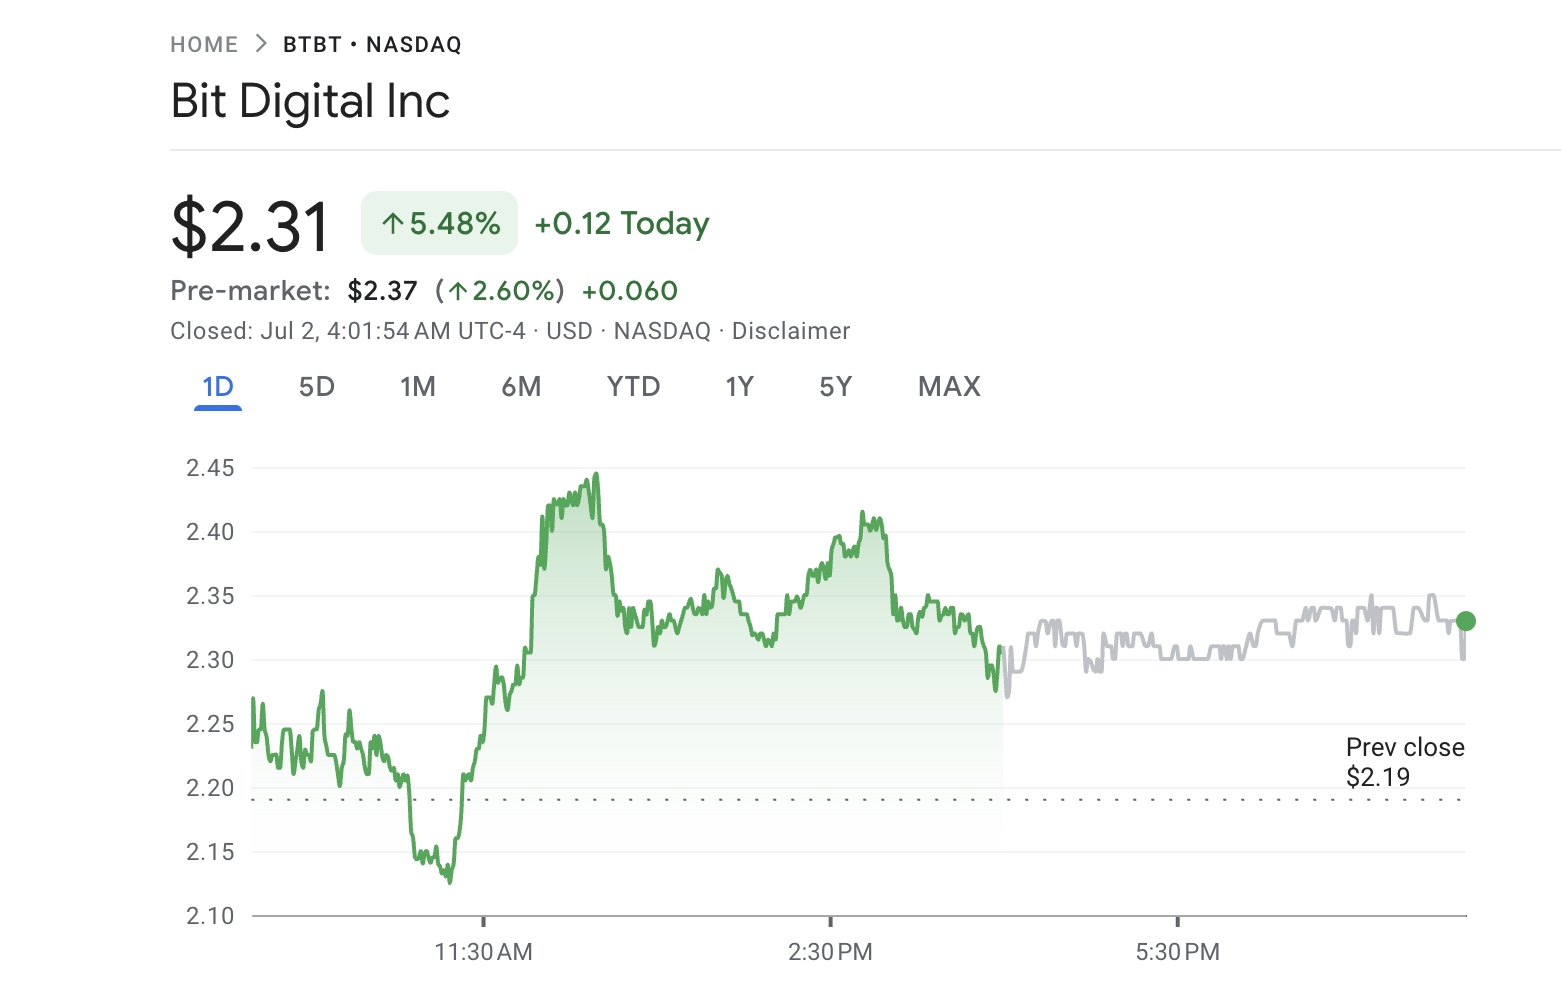
Notably, the announcement gave the stock prices the much-needed upward push. Although the news of the transition and offering were initially met with declines, the successful fundraising triggered a rise in stock value.
Google Finance data showed the BTBT closed at $2.3, marking a 5.48% increase. Moreover, the price rose further by 2.6% in pre-market trading.
The rise in stock prices mirrors the pattern observed in firms’ stocks that have adopted a Bitcoin-focused strategy. This shows that, alongside BTC, Ethereum is also gaining institutional and investor confidence as an asset class.
In fact, BitMine’s earlier announcement to commit $250 million toward an ETH treasury led to a dramatic 684.8% increase in its stock price, highlighting the strong market sentiment and investor appetite for Ethereum-focused strategies.
This rise could be attributed to increased optimism in ETH’s price potential. Many anticipate that the growing stablecoin momentum and validator upgrade could drive prices higher. However, broader market conditions have put a slight pressure on ETH’s latest rally.
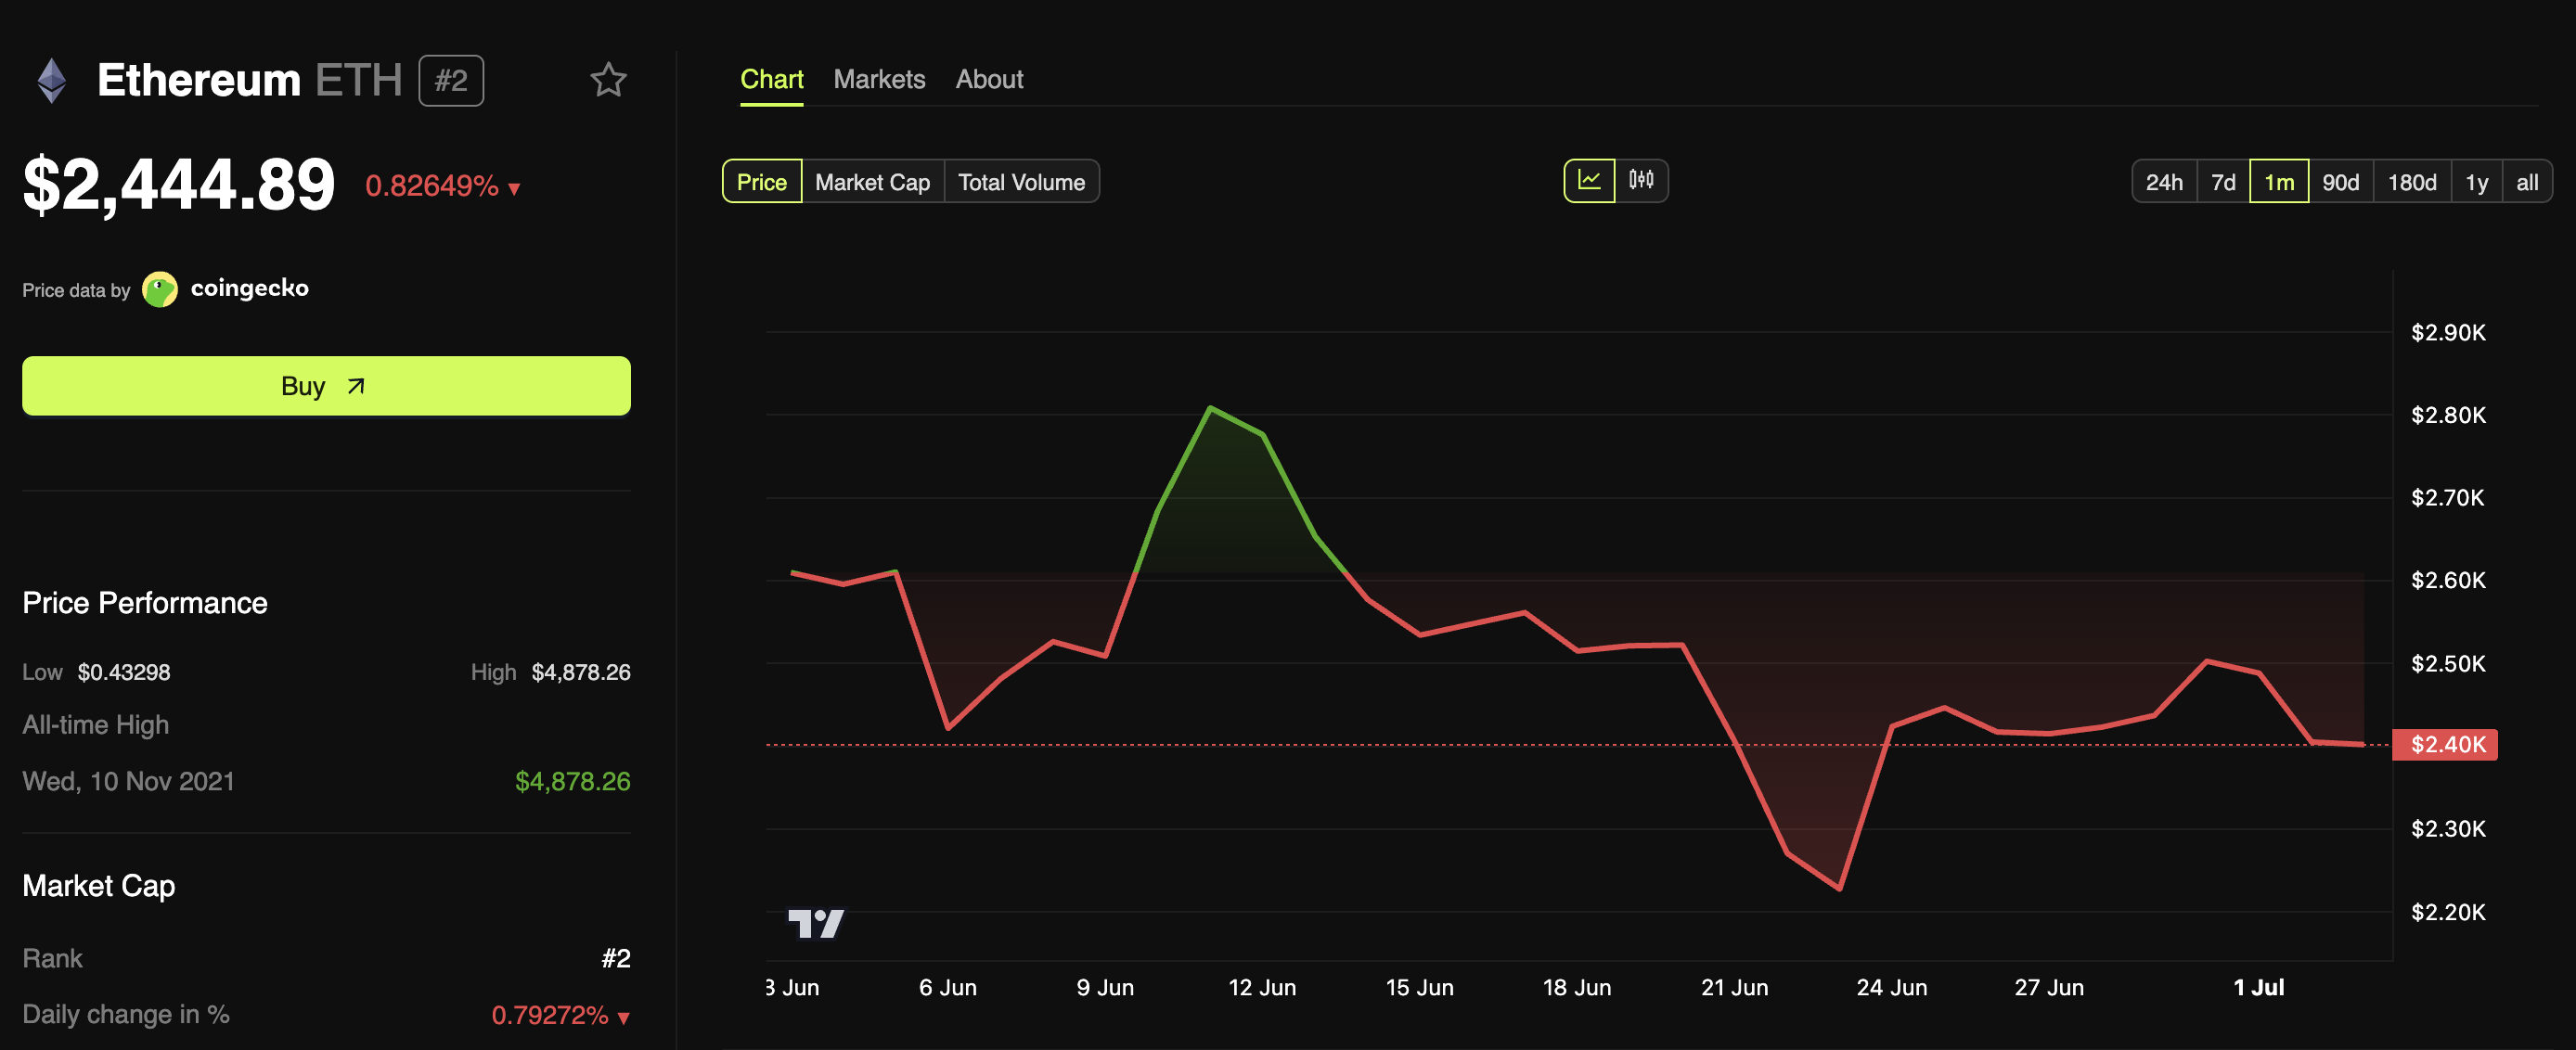
BeInCrypto data showed that the altcoin’s price declined 0.82% over the past day. At the time of writing, Ethereum was trading at $2,444.
The post Bit Digital’s Stock Rises After Securing $162.9 Million for Ethereum Treasury Strategy appeared first on BeInCrypto.


 (@APompliano)