Chainlink is playing an advanced role in Hong Kong’s push for cross-border payment functionality for its central bank digital currency (CBDC) experiments. Leaning on Chainlink’s infrastructure, participants in the pilot will attempt to move tokenized funds between Australia and Hong Kong. Chainlink Facilitates Cross-Border Digital Currency Exchange Chainlink’s Cross-Chain Interoperability Protocol (CCIP) has been tapped
The US Senate is preparing for another key vote on the GENIUS Act, a bipartisan bill aimed at establishing federal rules for stablecoins. This vote could occur as soon as Wednesday, June 11, following a procedural motion filed by Senate Majority Leader John Thune. The bill is seen as a major step in regulating dollar-pegged
As Bitcoin (BTC) price rallied above $110k on Monday, June 9, Ethereum (ETH) price jumped over 7 percent in the last 24 hours to trade about $2,686 during the late North American trading session. The large-cap altcoin, with a fully diluted valuation of about $323 billion and a 24-hour average trading volume of around $19 billion, rebounded from the lower border of a consolidation level of around $2,480.
As a result, the ETH price has been retesting a crucial local resistance level around $2,681, whereby the Ether price was rejected four times in the past four weeks.
Major Reasons Ethereum Price Will Rally Higher This Week
Strong Institutional Adoption and ETF Flows
According to market data analysis from CoinShares, Ethereum’s investment product dominated last week’s cash inflow with about $296 million. Notably, Ether’s investment product outpaced Bitcoin’s, which recorded a net cash outflow of about $56.5 million last week.
As Coinpedia had reported, BlackRock’s ETHA has recorded significant cash inflows in the past two weeks, suggesting a strong demand from institutional clients.
Altseason Sentiment
Ethereum price is well positioned to rally towards a new local high this week fueled by the rising narrative of altseason 2025. With Bitcoin dominance signaling an imminent market reversal, more crypto investors are betting on a major altcoin rally in the near future.
Furthermore, the ETH/BTC pair is heavily oversold in the weekly timeframe, amid the recent market reversal.
Regulatory Clarity
Earlier on Monday, the U.S. Chair Paul Atkins highlighted that American crypto investors have the right to self-custody of crypto assets. Additionally, Chair Atkins highlighted that a new and clear set of DeFi regulations are needed to foster the development of the nascent blockchain technology.
With Ethereum harboring the largest DeFi space, with a total value locked (TVL) of about $63 billion and a stablecoins market cap of around $124 billion, the altcoin is well positioned to rally further in the near future.
The post Top Reasons Why Ethereum (ETH) Price Will Reach $2,800 This Week appeared first on Coinpedia Fintech News
As Bitcoin (BTC) price rallied above $110k on Monday, June 9, Ethereum (ETH) price jumped over 7 percent in the last 24 hours to trade about $2,686 during the late North American trading session. The large-cap altcoin, with a fully diluted valuation of about $323 billion and a 24-hour average trading volume of around $19 …
The cryptocurrency market is back in action today, with a sharp rally across major coins like Bitcoin, Ethereum, and Solana. At the time of writing, the total crypto market capitalization has jumped to $3.43 trillion, showing a healthy 4.22% rise in the past 24 hours. Investor sentiment has also turned positive. The Fear & Greed Index now reads 64, firmly in ‘Greed’ territory — a clear sign that traders are feeling confident about the market’s direction.
So, what’s fueling this rally? Let’s break it down.
Bitcoin Leads the Charge
The star of the show is Bitcoin, which finally broke out of a consolidation range it had been stuck in since May 23rd. Currently trading above $109,500, Bitcoin’s breakout is being closely watched by analysts. This move was expected because of a bullish weekly candle formation called a three-inside-up pattern around the $100,000 mark. Historically, this kind of setup often leads to an 8-10% pump within a week or two.
Apart from technical signals, positive news on the macro front is also helping the rally. Reports show that trade talks between the United States and China have resumed, easing global market tensions. This, combined with growing institutional interest, has boosted investor confidence.
Altcoins Follow Suit
Following Bitcoin’s lead, altcoins are also climbing. Ethereum is up over 8% this week, now trading at $2,699, while Solana and Dogecoin have surged 5% and 6.6% respectively. Interestingly, Sui (SUI) and Hyperliquid (HYPE) have posted impressive double-digit gains.
The Altcoin Season Index, however, remains at 30 out of 100, meaning that while altcoins are rallying, a full-fledged alt season hasn’t arrived yet.
Never Miss a Beat in the Crypto World!
Stay ahead with breaking news, expert analysis, and real-time updates on the latest trends in Bitcoin, altcoins, DeFi, NFTs, and more.
The post Why is The Crypto Market Going Up Today? appeared first on Coinpedia Fintech News
The cryptocurrency market is back in action today, with a sharp rally across major coins like Bitcoin, Ethereum, and Solana. At the time of writing, the total crypto market capitalization has jumped to $3.43 trillion, showing a healthy 4.22% rise in the past 24 hours. Investor sentiment has also turned positive. The Fear & Greed …
The price of XRP is rising today, up by more than 2%, currently trading around $2.30. This move is in line with a broader recovery in the crypto market, with Bitcoin climbing steadily and Ethereum leading the pack with an 8% surge. As Ethereum moves higher, many smaller altcoins like XRP are following the trend.
Looking at the daily charts, XRP recently bounced off a key support zone between $2.00 and $2.10. This area has proven strong in the past, with prices rebounding from here several times.
If the price falls below $2.00, analysts warn that it could drop toward $1.92-$1.95, and possibly as low as $1.80. But for now, the bullish momentum is holding.
A positive sign for XRP is the formation of a double bottom pattern — also known as a W pattern — on the charts. This pattern often signals a potential upward breakout. If this pattern plays out fully, the next price target would be around $2.44.
However, before reaching that level, XRP could face some resistance near $2.35, an area that previously acted as both support and resistance.
Long-Term Outlook: Could $5 Be Next?
XRP appears to be in the middle of a fifth wave to the upside. This wave started in April after a market correction and could possibly push prices above $5.00 in the coming months, provided current support levels hold.
If XRP stays above the April lows and maintains its upward structure, analysts believe the bullish trend could continue. However, a break below those key support areas might delay the rally, meaning that the market is still working through a correction phase.
Never Miss a Beat in the Crypto World!
Stay ahead with breaking news, expert analysis, and real-time updates on the latest trends in Bitcoin, altcoins, DeFi, NFTs, and more.
The post XRP Price Prediction For June 10 appeared first on Coinpedia Fintech News
The price of XRP is rising today, up by more than 2%, currently trading around $2.30. This move is in line with a broader recovery in the crypto market, with Bitcoin climbing steadily and Ethereum leading the pack with an 8% surge. As Ethereum moves higher, many smaller altcoins like XRP are following the trend. …
The Pi Network community is rallying ahead of June 28, 2025, a date now labeled as the “Day of Great Expectation”, calling on the Pi Core Team to finally recognize the Global Consensus Value (GCV) as the true worth of PiCoin. After over six years of dedication from millions of users, known as Pioneers, this moment is seen as the project’s biggest turning point.
June 28, 2025 – The Critical Juncture for Pi Network:
Will the Pi Core Team Rise to the Call of the Pioneers?
After more than six years of relentless mining, building, and bartering, the global community of Pioneers now stands at the… pic.twitter.com/NAtGuB0jZZ
— ONE WORLD DIGITAL CURRENCY (@gfc199) June 8, 2025
A Community-Built Value System
GCV isn’t just a number. Since 2022, it has formed through real-world use cases, not speculation, as Pioneers exchanged goods and services using PiCoin in a closed-loop economy. It reflects a community-agreed value rather than market prices listed on centralized exchanges. Crypto advocates, including @gfc199 and others, argue that this bottom-up value model is what kept the project alive during years of development.
The Numbers Behind the Concern
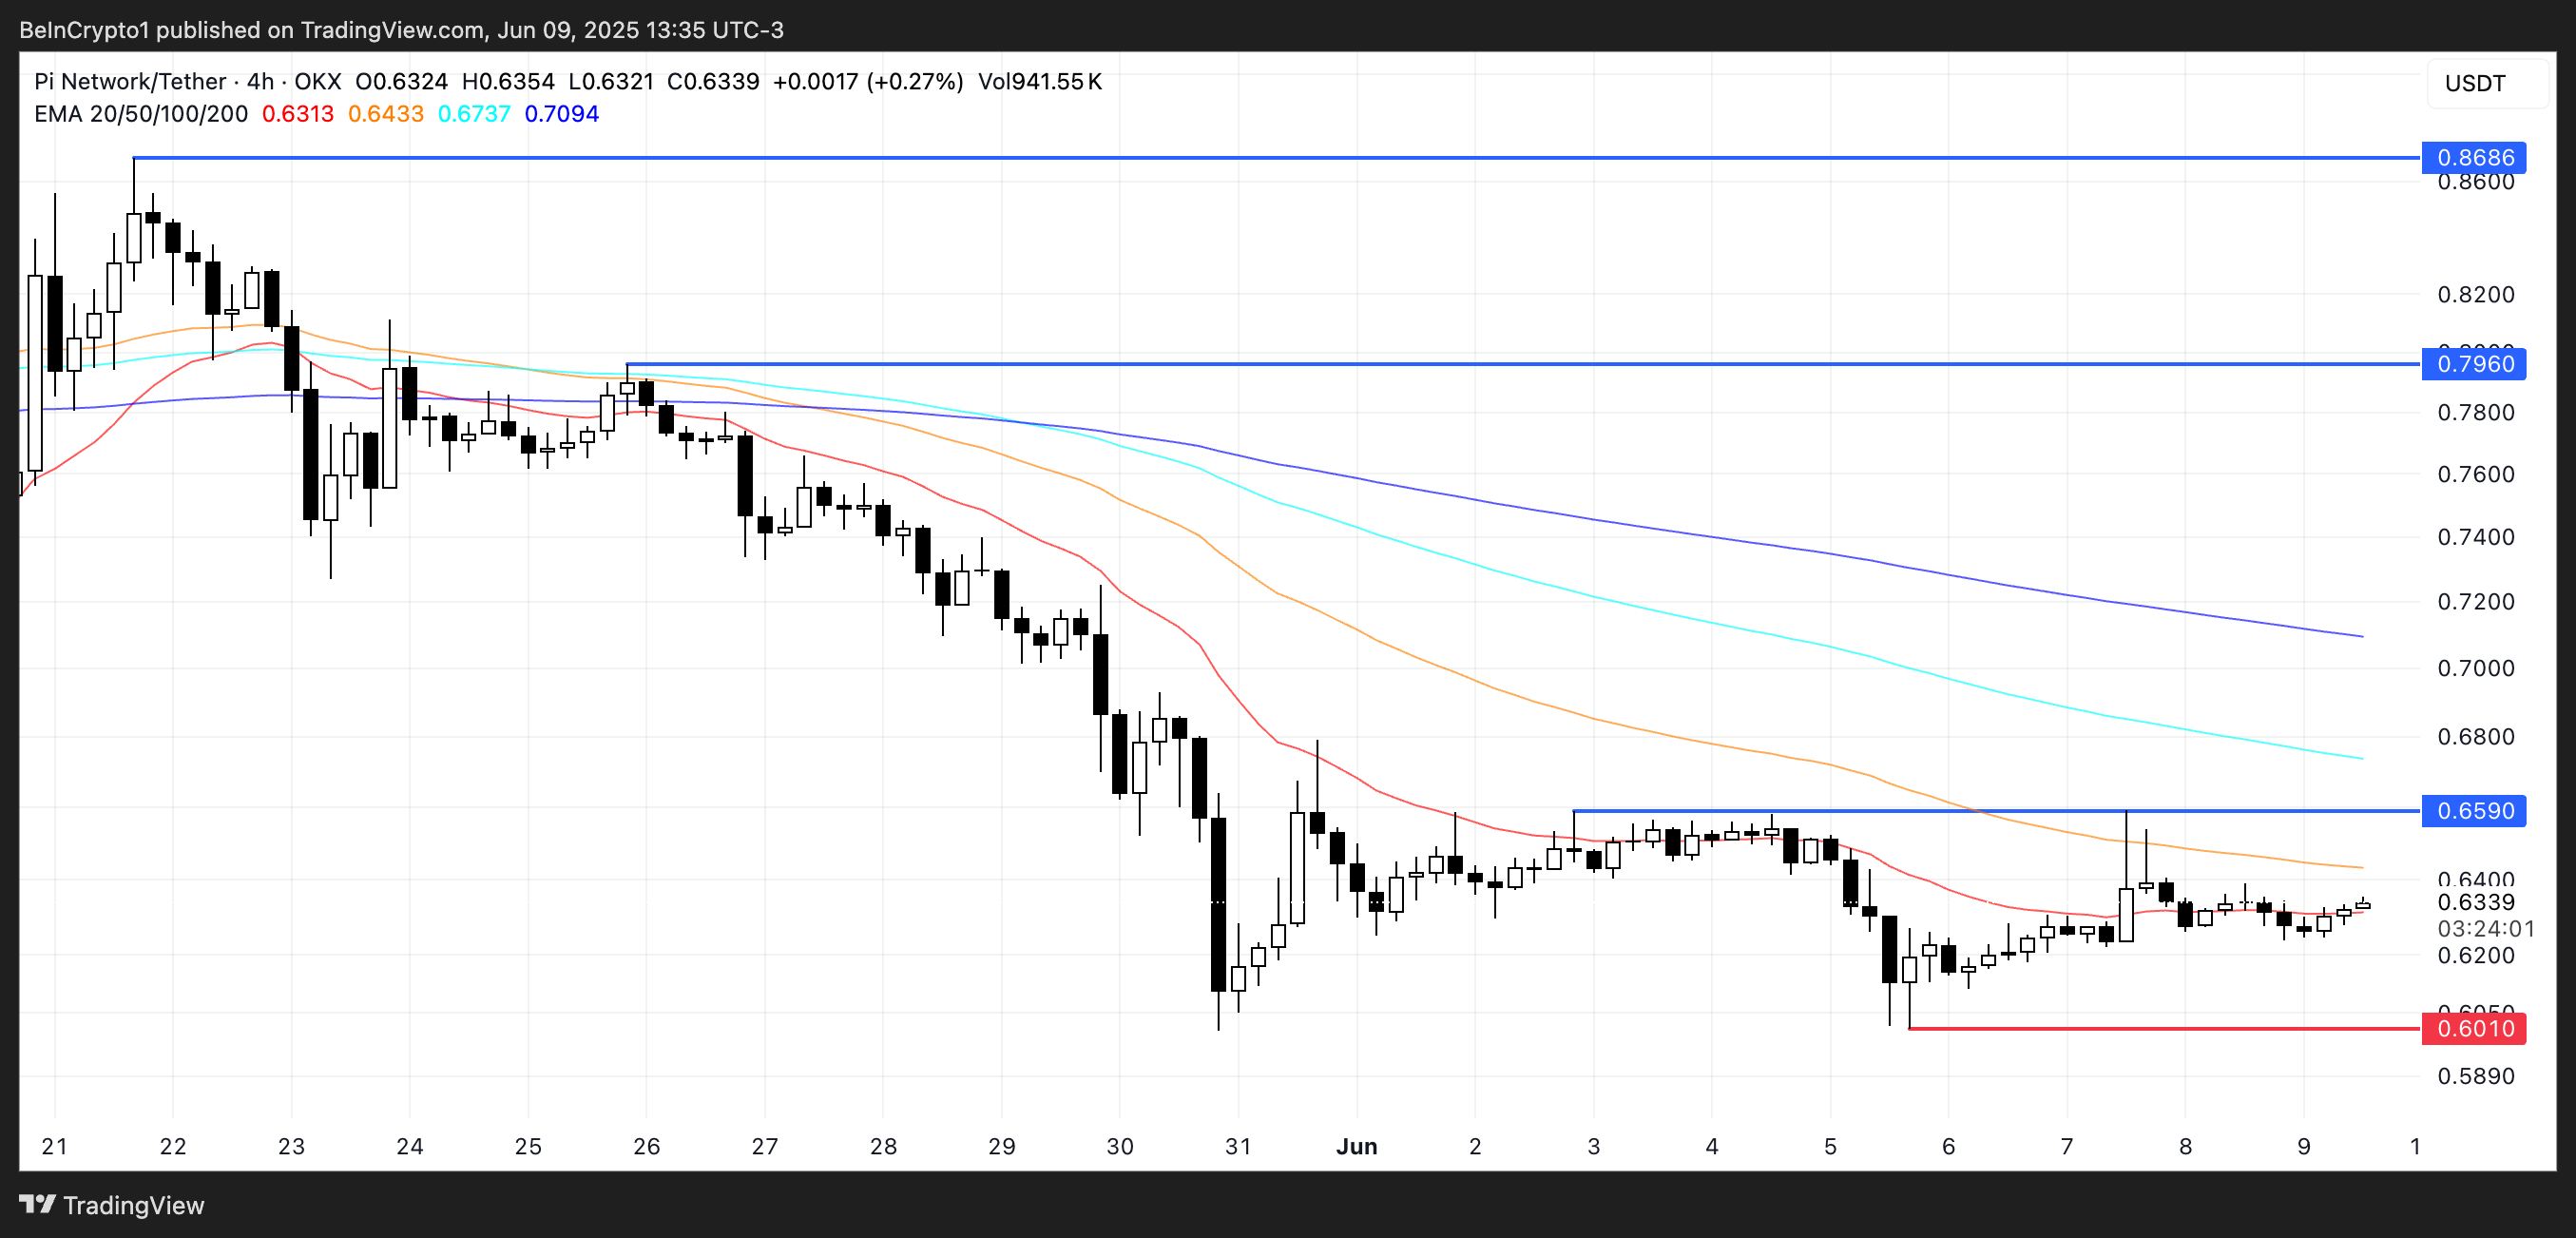
According to the analyst, most Pioneers hold fewer than 300 PiCoin. With exchange prices hovering around just $0.63, this means their holdings are valued at less than $200, far from the life-changing potential many had envisioned. The fear now is that if the Core Team remains silent on GCV or continues to delay its recognition, Pioneers may lose faith entirely. This could trigger a mass sell-off and further disconnect from the network.
The upcoming Pi Day 2 celebration could serve as a key inflection point for Pi cryptocurrency. Scheduled for June 28, this event, also known as Tau Day, is expected to reignite discussion around the project and may include major announcements from the Pi Core Team.
According to the crypto analyst Dr. Altcoin, the Pi market is consolidating ahead of Pi Day 2, with a potential recovery expected as unlocks slow and investor confidence builds.
Interestingly, recognizing GCV isn’t about bending to pressure; it’s about honoring the years of effort poured into the project by its most loyal supporters. The future of PiCoin, according to analysts and community voices alike, now hinges on whether the Core Team listens to this call.
Never Miss a Beat in the Crypto World!
Stay ahead with breaking news, expert analysis, and real-time updates on the latest trends in Bitcoin, altcoins, DeFi, NFTs, and more.
The post Pi Network News: June 28 Dubbed ‘Day of Great Expectation’ by Pioneers appeared first on Coinpedia Fintech News
The Pi Network community is rallying ahead of June 28, 2025, a date now labeled as the “Day of Great Expectation”, calling on the Pi Core Team to finally recognize the Global Consensus Value (GCV) as the true worth of PiCoin. After over six years of dedication from millions of users, known as Pioneers, this …
As the financial world faces big shifts, XRP is a name that keeps coming up. With important legal updates and market developments, many are keeping a close eye on where XRP could head next. Price predictions are making the rounds, and some are turning heads.
A user on X (formerly Twitter) says that a $10,000 XRP isn’t impossible, and those dismissing the idea might be overlooking the bigger picture. According to the post, this isn’t just hype. It’s about the numbers, market dynamics, and global financial flows coming together.
Dollar’s Decline and XRP’s Rising Role
Since 1971, the dollar has lost 96% of its value. With national debt crossing $34 trillion and over $1 trillion spent on interest payments every year, the situation is becoming unsustainable. If the Federal Reserve continues printing more money, the dollar’s value could fall even further, leading to shifts in how assets like gold, cryptocurrencies, and real estate are priced.
The Real World Asset (RWA) market could reach $16-30 trillion by 2030, given that big players, such as BlackRock and JPMorgan, are already in. These assets require speed, compliance, and cross-network support, and here’s where XRP enters.
XRP: Built to Scale
The user said that XRP’s infrastructure is already built for institutions. Supporting this statement, the user gave examples and said that RippleNet connects 300+ banks, ODL is active across 6 continents, RLUSD is a regulated stablecoin, and Ripple Custody secures digital assets.
If XRP handles just a slice of global FX, tokenized assets, and debt markets, even at modest transaction speed, it could skyrocket. Its limited supply and high demand could send the price soaring.
Is It Just A Wild Prediction?
For XRP to reach $10,000, its total value would need to be around $530 trillion, which is not realistic. So, unless XRP powers nearly all global finance, that price is highly unlikely anytime soon.
Short Term Price Targets
XRP is currently trading at $2.30, up 2.7% in the past 24 hours. Analyst Steph is Crypto has shared a bullish XRP chart showing a breakout ahead.
As per the chart, XRP is finishing its Wave 4 consolidation and could soon launch into Wave 5 with a major rally. Price targets include $5.36, $11.28, $23.73, and even as high as $37.55 based on Fibonacci levels.
The post $10,000 XRP Prediction: Breaking Down the Math, Market Facts, and Possibilities appeared first on Coinpedia Fintech News
As the financial world faces big shifts, XRP is a name that keeps coming up. With important legal updates and market developments, many are keeping a close eye on where XRP could head next. Price predictions are making the rounds, and some are turning heads. A user on X (formerly Twitter) says that a $10,000 …
Solana (SOL) has a market cap above $80 billion but is down over 10% in the last 30 days. Despite a recent bounce, its price has stayed below $170 since May 29. The RSI has recovered to 54.51 but failed to break above 60, showing limited bullish strength.
The Ichimoku Cloud remains red and thick, signaling strong resistance ahead. The Tenkan-sen has crossed above the Kijun-sen, but the price is still inside the cloud. The EMA structure is still bearish, with short-term lines below long-term ones. Solana needs stronger momentum to break out and confirm a trend reversal.
Solana RSI Rebounds but Struggles to Cross 60 Threshold
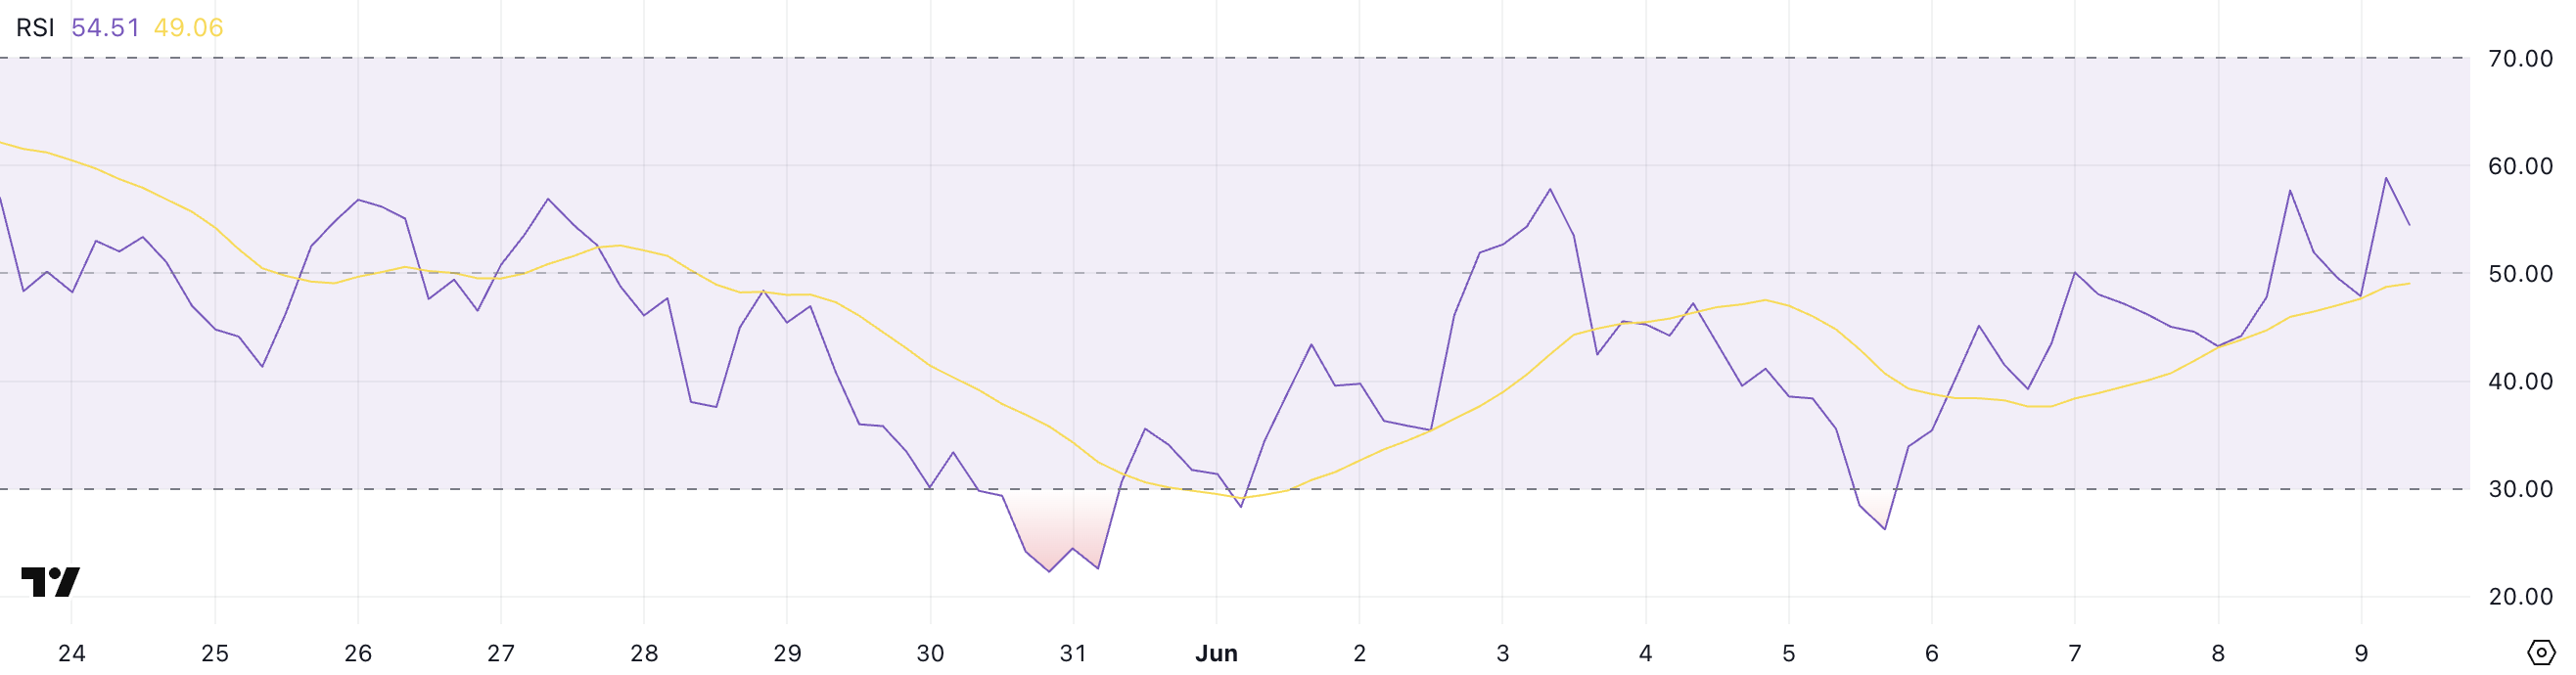
SOL is showing early signs of a momentum shift, with its Relative Strength Index (RSI) currently at 54.51—up significantly from 39.26 just three days ago.
Since yesterday, RSI has been attempting to break above the 60 level, a threshold that often signals stronger bullish momentum.
While the climb from sub-40 levels suggests recovering buyer interest, the RSI remains stuck in the neutral zone for now, indicating hesitation among bulls to fully reclaim control.
The RSI is a widely used momentum indicator that ranges from 0 to 100. It is designed to measure the speed and change of price movements.
Readings above 70 typically indicate overbought conditions, while readings below 30 signal oversold levels. A value around 50 is considered neutral.
With SOL’s RSI currently at 54.51, the market is cautiously bullish, but a failure to push beyond 60 may limit further upside in the short term.
SOL Battles Resistance Within Bearish Ichimoku Cloud
Solana price is testing a critical resistance area defined by the Ichimoku Cloud. The price recently pushed into the red cloud from below, indicating an attempt to reverse the prevailing bearish trend.
However, the cloud remains thick and red—signaling that resistance is strong and the broader sentiment has yet to flip bullish.
The Leading Span A (green line) is still below the Leading Span B (red line), confirming that the cloud remains in bearish alignment.
The Tenkan-sen (blue line) has crossed above the Kijun-sen (red line), typically an early bullish signal. Additionally, the price is hovering around these conversion lines, showing some short-term upward momentum.
However, with the price still inside the cloud and the future cloud projecting continued resistance, SOL needs a strong breakout above the cloud to confirm a bullish reversal.
Until then, the trend remains uncertain, and the cloud’s upper boundary will act as a key hurdle.
Solana Rallies Above $150, But EMA Structure Remains Bearish
Solana price has climbed nearly 8% over the past four days, breaking above the $150 mark and showing renewed bullish interest.
Despite this rally, the EMA lines still reflect a bearish setup, with short-term averages below the longer-term ones. If the current momentum continues, SOL could push higher to test resistance at $163.76.
A breakout there might open the door to $169.20, and in a scenario of strong, sustained buying, the price could rally as high as $179.50—marking a potential 16.7% upside from current levels.
However, this bullish path depends on the strength of the ongoing uptrend.
If Solana fails to hold above its recent breakout level and the support at $150.65 is lost, the price could fall back toward $141.53.
Over the last couple of weeks, buzz has been growing about the CLARITY Act, a proposed new framework for US crypto regulation. The bill’s first markup is scheduled for tomorrow morning.
But what is the significance of this new crypto bill, and which industry players support it?
New Act Brings CLARITY To Crypto Regulation
Since the GENIUS Act cleared a key cloture vote, US crypto policy has been an especially important topic. In late May, GOP Congressman French Hill proposed the Digital Asset Market Clarity (CLARITY) Act, a new framework for Web3 regulation.
The bill’s first markup will happen tomorrow morning at 10 AM EST.
NEW: @FinancialCmte has officially scheduled a markup of the crypto market structure bill — the CLARITY Act — for Tuesday, June 10 at 10:00 AM EST alongside a handful of other bills.
The proposed act assigns the CFTC as the primary regulator for digital commodities (on‑chain tokens), including exchanges, brokers, and spot markets. It preserves the SEC’s authority over investment contract assets—securities under the Securities Act.
Overall, it creates precise definitions and compliance pathways to reduce inconsistent enforcement.
In addition to consumer protection measures, it attempts to provide thorough rules for defining tokens as securities or commodities, a thorny issue for regulators.
Without getting into excessive detail, the bill aims to remove ambiguity from several such situations.
Although it was proposed by a Republican, the CLARITY Act has strong bipartisan support, reflecting the desire to create a solid framework for crypto regulation.
However, the initial language focused specifically on assets, their classification, and firms that custody them. The proposed bill also exempts “DeFi activities” (like developers, transaction relayers) from conventional registration.
It also explicitly protects peer-to-peer transactions and individual self-custody of assets.
New and Upcoming Amendments
To correct some of the oversight, The Blockchain Regulatory Certainty Act (BRCA) was recently introduced as an amendment to the bill. Presently, the crypto industry’s political lobbying groups are attempting to help it along.
In addition to an initial show of support, eight leading trade associations have made further statements earlier today:
Crypto Groups Support the CLARITY Act. Source: Eleanor Terrett
Specifically, this amendment would ensure that the CLARITY Act doesn’t apply heavy-handed regulations where it isn’t appropriate.
However, some regulators may also disagree with this overall ethos. After all, what are laws like this for? Former CFTC Chair Tim Massad, who recently warned of crypto corruption, also testified about some potential pitfalls in the CLARITY Act:
“The CLARITY Act seems to start with the technology and ask, what do we need to do to make it easier for people to invest in this technology? But the strength of our securities and derivatives laws lies in the fact that we have traditionally focused on regulatory goals, and provided…the flexibility to achieve those goals,” Massad claimed.
It’s not yet clear how much this will impact the final bill, but the GENIUS Act underwent substantial amendments from its first version. Between tomorrow’s markup and the voting process, this bill could change dramatically in the next few weeks.
Pi Network (PI) is down 14% over the past 30 days, with its market cap falling below $5 billion and the token trading under $1 since May 14.
Technical indicators continue to show bearish momentum, with PI struggling to break through key resistance levels. The Ichimoku Cloud, BBTrend, and EMA lines all point to ongoing weakness and a lack of bullish confirmation. Unless momentum shifts soon, PI may face further downside before any meaningful recovery can take shape.
The BBTrend (Bollinger Band Trend) measures the strength and direction of price movements relative to Bollinger Bands.
Positive values suggest bullish momentum as the price pushes the upper band, while negative values indicate bearish conditions with prices staying near the lower band.
PI’s current BBTrend at -2.21 reflects a mildly bearish stance—less extreme than earlier, but still lacking upward pressure. The indicator must cross into positive territory and hold for sentiment to shift.
PI Breakout Could Trigger 37% Rally
PI price remains in a bearish technical setup, with its EMA lines showing short-term averages below the long-term ones.
If bearish pressure builds, PI could retest key support levels, and a breakdown would mark the first time the asset falls below a major historical threshold—intensifying downside risk.


 NEW:
NEW: