Bitcoin Drops Below $100,000 as Iran Moves to Close Strait of Hormuz

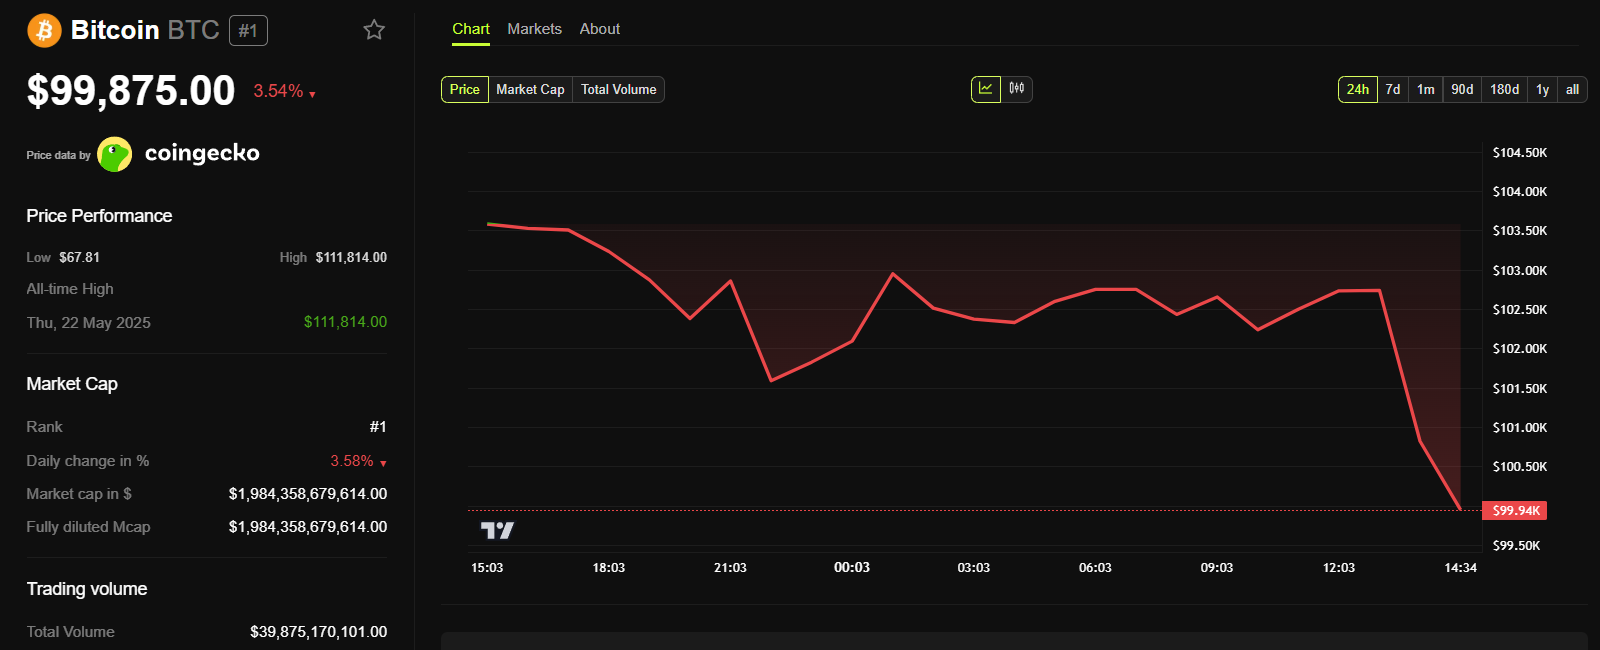
Bitcoin price dropped to $99,800 after Iran’s parliament approved a proposal to close the Strait of Hormuz. The move follows the US bombing of Iran’s nuclear sites yesterday. 

With final approval pending at the Supreme National Security Council, markets brace for heightened energy disruption risk. As Hormuz is critical to the world’s oil supply, a macro shock of this level could notably disrupt the crypto market. 

Impact of Potential Hormuz Shutdown

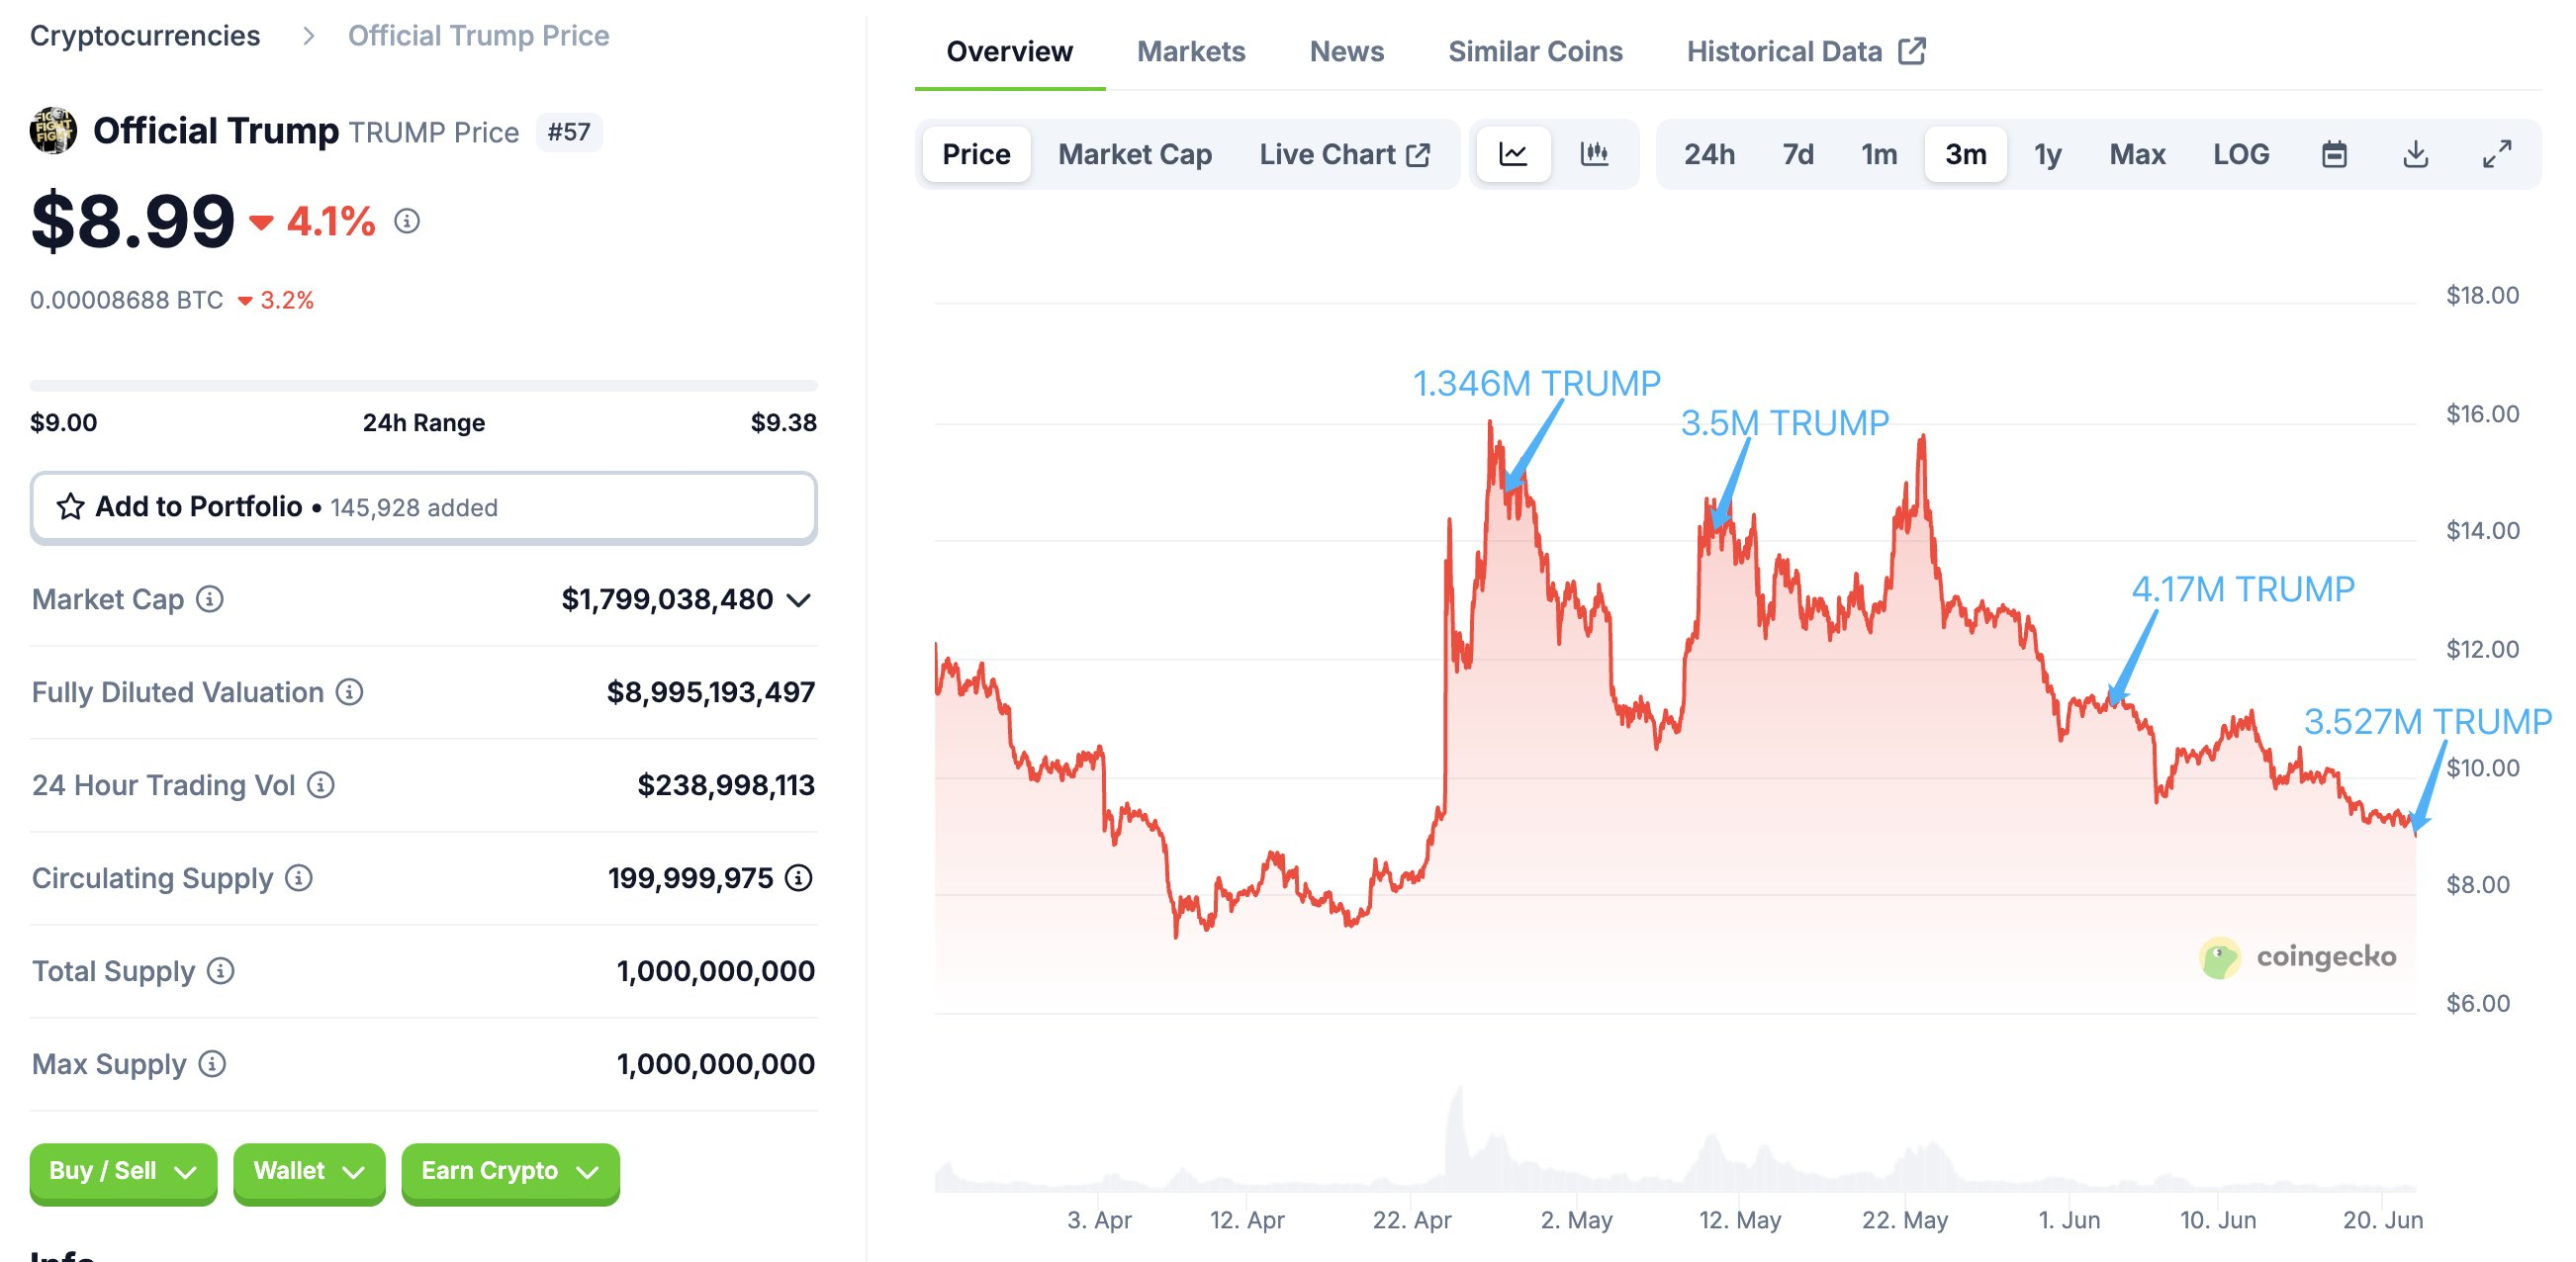
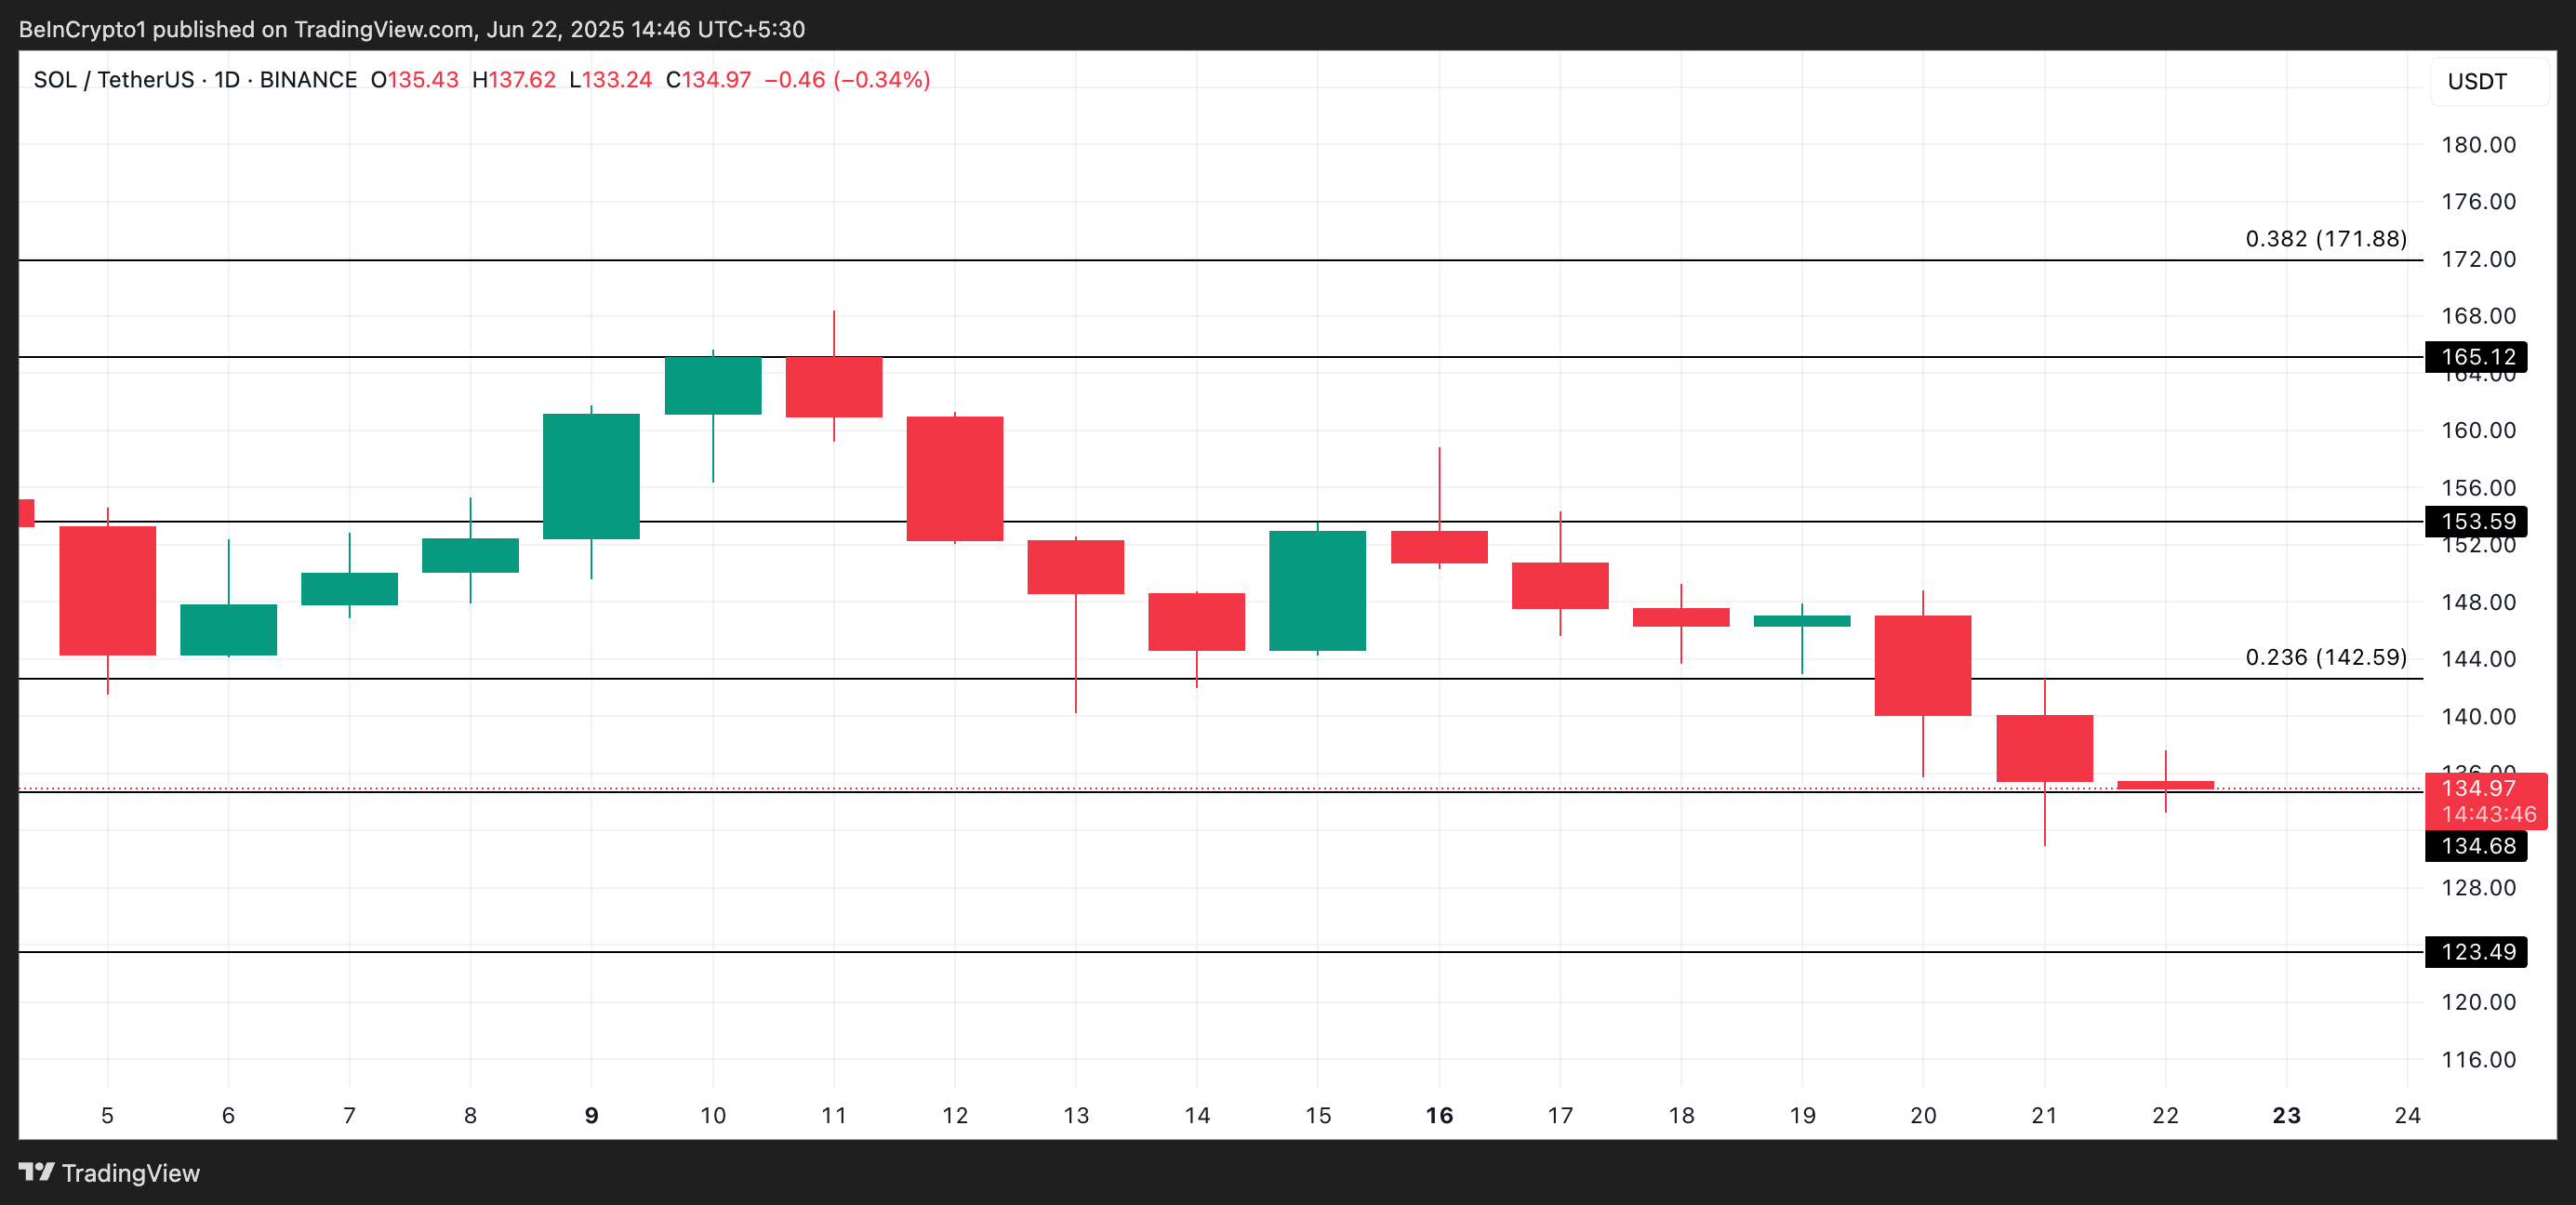
In addition to Bitcoin, Ethereum fell 4% under $2,200, and XRP dropped below $2 for the first time since April. Crypto liquidations hit $950 million in the past 24 hours, reflecting deep risk-off sentiment.

Bitcoin price drop below $100,000
Bitcoin Price Drops Below $100,000. Source: BeInCrypto

But why? The Strait of Hormuz channels nearly 25% of global oil shipments. Closing this chokepoint would tighten global energy supply immediately. 

Oil prices could surge, stoking inflation and delaying central bank rate cuts.

Consequently, higher energy costs would ripple through economies. Consumers face steeper fuel bills, while businesses grapple with rising transport and production expenses. 

In response, investors typically flock to safe-havens like US Treasuries and the dollar, draining capital from risk assets such as crypto.

Global Petroleum Supply Through the Strait of Hormuz. Source: X/The Kobeissi Letter

Moreover, energy-driven inflation pressures would challenge the Federal Reserve’s 2% target. If the Fed signals further tightening, real yields could rise. 

Historically, higher real yields weigh on Bitcoin by raising the opportunity cost of holding non-yielding assets.

Crypto Market Risks and Macro Linkages

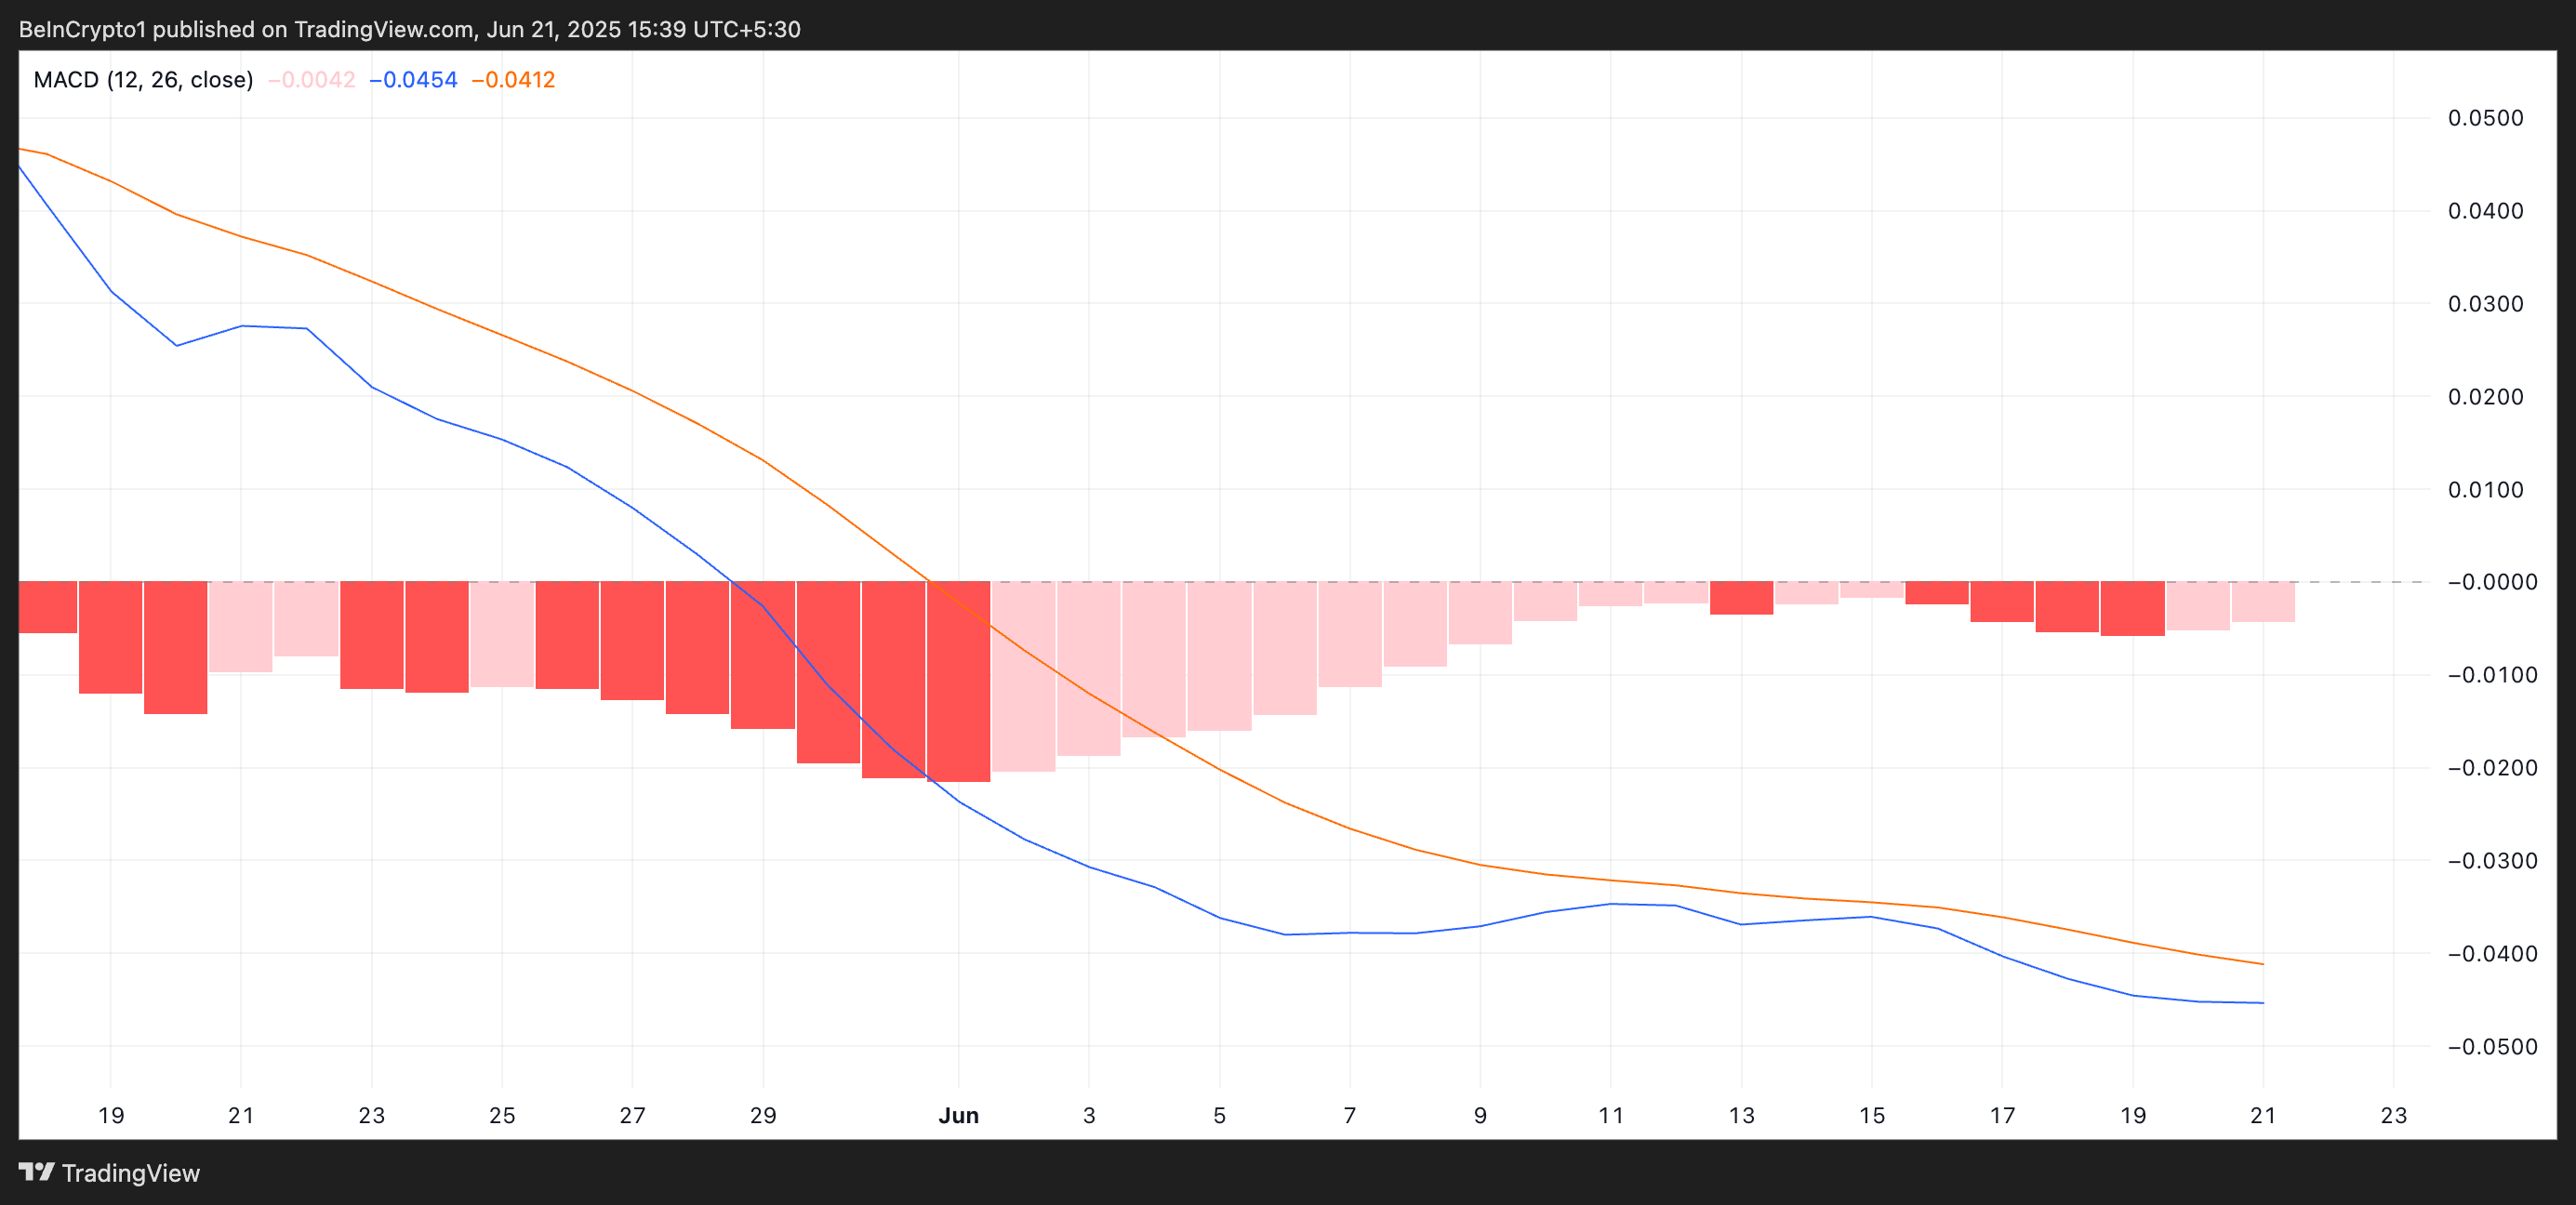
Crypto’s recent sell-off reflects broader market stress. Liquidations concentrated in long positions across Bitcoin and Ethereum. Rising VIX and widening Treasury yield spreads signal tightening risk budgets.

Additionally, hedge funds and retail traders often use leverage in crypto. Sharp price moves trigger margin calls, amplifying declines. 

With current leverage metrics elevated, further downside remains likely if uncertainty persists.

At the same time, dollar strength usually correlates with crypto weakness. A surge in the US Dollar Index could deepen Bitcoin losses, potentially pushing it towards $95,000.

Outlook and Key Indicators

Traders should watch three developments closely:

  • SNSC Decision: Final vote on Hormuz closure.
  • Oil Prices: Breaks above $100/barrel could exacerbate inflation.
  • Fed Signals: Comments on rate policy in response to energy shocks.

In sum, Iran’s potential closure of the Strait of Hormuz elevates macro risks for crypto. 

If approved, expect sustained pressure on Bitcoin and broader digital-asset markets until geopolitical clarity and energy stability return.

The post Bitcoin Drops Below $100,000 as Iran Moves to Close Strait of Hormuz appeared first on BeInCrypto.

TRUMP Meme Coin Team Moves $32.8 Million to Binance

The team behind the Solana-based TRUMP meme coin, a digital asset connected to US President Donald Trump’s brand, has moved 3.527 million tokens (equivalent to about $32.8 million) to Binance.

This transaction is the latest in a string of significant token deposits to centralized exchanges, sparking fresh concerns about the team’s intentions and the potential impact on market stability.

Nearly $150 Million in TRUMP Tokens Have Been Moved

Blockchain analysis platform Lookonchain reported that this latest transfer, conducted on June 21, forms part of a larger pattern.

Since late April, the team has sent more than 12.5 million TRUMP tokens, valued at over $150 million, to exchanges including Binance, OKX, and Bybit.

TRUMP Meme Coin Major Exchange Transfers.
TRUMP Meme Coin Major Exchange Transfers. Source: Lookonchain

Market experts caution that these frequent, large-volume deposits to exchanges without transparent communication can heighten uncertainty and trigger price declines.

However, the project representatives previously claimed that the movement of tokens aimed to support liquidity and ensure smooth trading conditions. They also stated that the tokens came from a wallet created specifically for this purpose during the project’s launch phase.

Despite those assurances, the token’s market value has continued to decline.

According to BeInCrypto data, TRUMP has lost around 6% over the past day and currently hovers near $8.68 as of press time. Since its January debut, the token’s value has dropped by around 90% from its peak of over $75.

Meanwhile, the controversy surrounding the token doesn’t stop at market activity. There is also an ongoing political scrutiny surrounding the token’s ties to US President Donald Trump, which further complicates sentiments surrounding the meme coin.

For context, US Representative Brad Sherman recently accused TikTok of planning to spend $300 million on TRUMP tokens in an attempt to sway US policy. However, TikTok has since denied the allegation, calling it both misleading and baseless.

“Congressman, claiming that the owners of TikTok are buying ‘Trump Coins’ is patently false and irresponsible and doesn’t even accurately reflect a letter you signed last month,” the video-sharing platform stated.

These issues mean the outlook for TRUMP remains uncertain due to the growing skepticism about the token’s utility and persistent price declines.

The post TRUMP Meme Coin Team Moves $32.8 Million to Binance appeared first on BeInCrypto.

Can Solana (SOL) Hold Above $130 Before Q2 Ends?

Popular altcoin Solana has shed nearly 10% of its value over the past week, and the bearish pressure does not appear to be letting up. The token dropped to $129 today, as geopolitical tensions between the US and Iran escalate.

As the second quarter of 2025 draws to a close, mounting selloffs have placed Solana’s price at risk of breaking below the crucial $130 support level. This analysis explains how.

SOL Slips as Key Indicators Remain Bearish

Over the past seven days, SOL’s price has steadily declined. This has been accompanied by a dip in the coin’s Chaikin Money Flow (CMF), which has fallen deeper into negative territory. As of this writing, SOL’s CMF is at -0.13.

SOL CMF.
SOL CMF. Source: TradingView

The CMF measures the flow of money into and out of an asset over a specific period, typically 20 or 21 days. It combines price and volume data to assess buying and selling pressure. When an asset’s CMF is positive, buying volume is dominant and capital is flowing into the asset, indicating potential bullish sentiment. 

Conversely, when the CMF turns negative, selling volume outweighs buying volume, meaning money flows out. This signals weakening demand for SOL, especially if the negative reading deepens while price declines.

Moreover, the coin’s Elder-Ray Index, which gauges the balance between buyers and sellers, is at -20.74, signifying that sellers are firmly in control. 

SOL Elder-Ray Index.
SOL Elder-Ray Index. Source: TradingView

This indicator measures the strength of bulls and bears in the market by analyzing the difference between an asset’s price and a moving average. When it is negative, bears dominate, as prices consistently fall below the average, suggesting selling pressure outweighs buying interest. 

Will SOL Recover Above $130 or Is a Drop to $123 Looming?

This bear dominance reflects the growing conviction that SOL’s price could decline further, particularly if $134 fails to hold as a support floor.

Meanwhile, a breakdown below this level could open the door for deeper losses, potentially dragging SOL toward $123.49. 

SOL Price Analysis
SOL Price Analysis. Source: TradingView

However, if bulls manage to regain control, they could push Solana’s price upward to $142.59.

The post Can Solana (SOL) Hold Above $130 Before Q2 Ends? appeared first on BeInCrypto.

Michael Saylor Signals Another Bitcoin Buy for MicroStrategy

Michael Saylor, co-founder of Strategy (formerly MicroStrategy), has once again dropped a cryptic hint suggesting that his firm may soon add more Bitcoin to its already massive holdings.

In a June 22 post on X, Saylor shared a chart of Bitcoin’s performance, paired with the phrase, “Nothing Stops This Orange.”

Saylor Predicts Bitcoin Could Hit $21 Million in Two Decades

This social media post follows a familiar pattern of Saylor’s cryptic signals just before his firm files for additional Bitcoin buys with the US Securities and Exchange Commission (SEC).

Over the past weeks, Strategy’s Bitcoin position has aggressively grown following several strategic acquisitions.

Strategy’s Bitcoin Purchase Markers.
Strategy’s Bitcoin Purchase Markers. Source: Saylortracker

This has resulted in the firm holding around 592,100 BTC, valued at over $60 billion. Strategy’s BTC reserve represents approximately 2.8% of Bitcoin’s total supply and makes it the world’s largest corporate holder of the asset.

Meanwhile, Saylor’s confidence in Bitcoin shows no signs of fading despite his firm’s substantial holding. The Bitcoin bull recently predicted that the top crypto could hit $21 million in price within the next 21 years.

“$21 million in 21 years,” Saylor said on X.

Despite the bullish tone, Saylor’s approach has drawn criticism.

Prominent investor Jim Chanos, best known for his bearish calls on companies like Enron, has publicly challenged Saylor’s claims regarding the firm’s use of debt.

In a video clip shared online, Saylor defended his strategy by saying that the company’s debt is “convertible,” “unsecured,” and “no recourse.” The Bitcoin bull also suggested that the top crypto’s value could fall 90% without impacting his firm’s repayment obligations.

However, Chanos disagreed strongly with this view, saying Strategy remains liable if the debt hasn’t converted to equity by maturity.

“There is of course recourse to Strategy if the convertible debt has not converted to equity, when due. How does he not know this?,” the investor questioned.

His criticism implies that Saylor may be overstating the safety of the firm’s debt position.

Chanos’s view is unsurprising considering his firm recently took an unusual stance of betting against Strategy while remaining long on Bitcoin.

This dual position highlights a growing view among some investors that while Bitcoin may thrive, Saylor’s aggressive corporate strategy could carry hidden risks.

The post Michael Saylor Signals Another Bitcoin Buy for MicroStrategy appeared first on BeInCrypto.

Pi Network Extends Weekly Losses to 15% – What’s Next for PI

Pi Network’s prolonged decline has extended into another week, with the token shedding nearly 16% of its value amid a broader market lull. 

As macro uncertainty intensifies and Pi’s scheduled daily token unlocks continue to weigh heavily on sentiment, the downward pressure appears far from over.

Sellers Dominate as PI Falls Below Key Thresholds

Since reaching an all-time high of $3 on February 25, PI has recorded consistent weekly losses, with no significant demand inflows to halt the slide. 

On the daily chart, the readings from the token’s Moving Average Convergence Divergence (MACD) indicator reflect the deepening bearish momentum. At press time, PI’s MACD line (blue) rests below the signal line (orange).

PI MACD
PI MACD. Source: TradingView

The MACD indicator identifies trends and momentum in its price movement. It helps traders spot potential buy or sell signals through crossovers between the MACD and signal lines. 

As with PI, when the MACD line rests below the signal line, it indicates waning buying activity. Traders see this setup as a sell signal. Hence, it could exacerbate the downward pressure on PI’s price.

Moreover, PI’s negative Balance of Power (BoP) shows that sellers remain firmly in control. As of this writing, the indicator is at -0.12. 

PI BoP.
PI BoP. Source: TradingView

The BoP indicator measures the strength of buyers versus sellers in the market, helping to identify momentum shifts. When its value is positive, buyers dominate the market over sellers and drive newer price gains. 

Conversely, negative BoP readings signal that sellers are dominating the market, with little to no resistance from buyers. This points to sustained downward pressure and weakening investor confidence.

For PI, the negative BoP readings reinforce the bearish outlook. It suggests that selling momentum may persist unless new demand emerges.

Pi Network Struggles Below Key EMA Level

Currently, PI trades at $0.53, exchanging hands below its 20-day exponential moving average (EMA), which forms dynamic resistance above its price at $0.56.

The 20-day EMA measures an asset’s average price over the past 20 trading days, giving more weight to recent prices. When an asset’s price trades below its 20-day EMA, it signals short-term bearish momentum and potential continued downside. If the bears retain control, they could drive PI’s price to revisit its all-time low at $0.40.

PI Price Analysis.
PI Price Analysis. Source: TradingView

However, a rebound could push the Pi Network’s token above the 20-day EMA and toward $0.79.

The post Pi Network Extends Weekly Losses to 15% – What’s Next for PI appeared first on BeInCrypto.

Real Estate Billionaire Grant Cardone Purchases $300M Worth of Bitcoin

Grant Cardone, a real estate investor and entrepreneur, is taking his business strategy to the next level by embracing Bitcoin. Cardone Capital, his investment firm, has announced plans to acquire an additional $300 million worth of Bitcoin. Cardone Capital’s Growing Bitcoin Strategy The company, Cardone Capital, with over $5 billion in assets under management, operates

The post Real Estate Billionaire Grant Cardone Purchases $300M Worth of Bitcoin appeared first on CoinGape.

$1.24 Billion in Bitcoin Added to Corporate Treasuries This Week

Bitcoin is seeing a surge in corporate interest. In just five days from June 16 to 20, 18 companies added a combined 12,010 BTC to their treasuries. That equals over $1.22 billion at its current price. Purchases and Planned Acquisitions Signal Institutional Momentum According to the update shared by @btcNLNico on X, two new firms,

The post $1.24 Billion in Bitcoin Added to Corporate Treasuries This Week appeared first on CoinGape.

Solana Foundation Signs MOU With Kazakhstan To Launch Solana Economic Zone

The Solana Foundation has extended its streak of victories with the announcement of a partnership with Kazakhstan to establish a special economic zone. Dubbed the Solana Economic Zone, the collaboration brings Kazakhstan one step closer to its goals of digitization as Solana continues to court institutional interest. Solana Foundation Launches Solana Economic Zone Members of

The post Solana Foundation Signs MOU With Kazakhstan To Launch Solana Economic Zone appeared first on CoinGape.

US Iran War: Crypto Market Crashes As U.S. Airstrikes on Iran

In a shocking update today, US president Donald Trump posted that United States of America has bombde three Iranian nuclear facilities. The crypto market is crashing including large cap coin like Bitcoin and Ethereum both down by more than 5% in last on week. US Bombs Iranian Nuclear sites, Crypto Market Tumbles The ongoing conflict

The post US Iran War: Crypto Market Crashes As U.S. Airstrikes on Iran appeared first on CoinGape.