Donald Trump has acknowledged the progress that the US has made towards boosting the crypto industry in the country. The US president also discussed why the US had to act fast to lead the way in crypto and praised Bitcoin’s role in complementing the dollar. Donald Trump Highlights US Progress Towards Crypto In a White
With Pi2Day just around the corner, the Pi Network community is buzzing with hopes and questions. June 28 isn’t just a date for Pi fans — it’s shaping up to be a moment that could decide if Pi finally grows up or stays stuck in its old problems.
After a tough year with falling prices and slow trust, this event might be Pi’s chance to win people back.
Pi Mainnet Launch – Not Enough?
Earlier this year, Pi took a big step by launching its open mainnet. That move gave millions of users the freedom to move tokens, build apps, and run their nodes. More than 13 million people have migrated since February.
But the token’s value still slipped under $0.50, showing that many traders and early pioneers still worry about Pi’s true strength.
What are These Pi2Day Promises?
Pi2Day is Pi’s yearly check-in with its huge community. Last year’s Pi2Day helped 4.5 million people finish KYC checks and try out apps. This time, the Pi team is promising tools to fix old problems.
There’s a new KYC “sync” button for stuck verifications, extra wallet access even for partly KYC’d users, and fresh security tools like 2FA.
They’re also planning better ways to find apps and make money using Pi’s new ad system.
And many users are excited about the “.pi” domains — Pi’s own Web3 names, just like .eth. Over 57,000 domains are already claimed, and Pi wants developers to use them for real work, not just flip them for profit.
Real Shops, Real Payments — Not Hype
In addition to it, Pi is pushing real-world use too. In March, over 58,000 merchants accepted Pi during the PiFest event, with 1.8 million users using the “Map of Pi” tool to find real-world businesses accepting the token.
That kind of traction, combined with a $100M Pi Ventures fund supporting new projects, is what could make or break its reputation.
Still, the question remains: will Pi2Day finally bring exchange listings or deeper AI integrations? No official word yet.
As Pi2Day arrives, hopes are high. If Pi shows real progress, trust may return. If not, the doubts will only grow.
The post Pi Network Mainnet, KYC Fixes, and More — What to Expect on Pi2Day appeared first on Coinpedia Fintech News
With Pi2Day just around the corner, the Pi Network community is buzzing with hopes and questions. June 28 isn’t just a date for Pi fans — it’s shaping up to be a moment that could decide if Pi finally grows up or stays stuck in its old problems. After a tough year with falling prices …
The live price of the TON token is [liveprice sym=”Toncoin”]
Toncoin price could hit a high of $6.48 in 2025.
With a potential surge, the TON price may record a high of $49.22 by 2030.
Launched in 2018, this Layer-1, Ethereum-based altcoin plays a vital role in the crypto space. Toncoin gained significant attention from investors after the investment of Pantera Capital, a leading hedge fund and venture capital firm located in the USA. In a notable move, TON staking is LIVE on Telegram with 4.7% APY and $30 minimum.
The Toncoin price jumped ~140% in 2024, resulting in it securing a spot in the top 10 cryptocurrencies by market cap. However, it has lost its steam and now ranks #18 by market cap.
But investors are still curious about its roadmap for achieving $10! Are you one of them? Fear not and dive in as we explore the feasible Toncoin price prediction 2025, 2026-2030.
TON has made it to the peak of NFT trading volumes on a daily basis. With a prediction of a bullish year, the TON price could experience increased adoption. This could result in the Toncoin recording a new high of $6.48.
Conversely, if a bearish reversal occurs, the TON coin price could plunge to $2.16. With this, the average trading price of this altcoin could land at $4.32.
According to forecast prices and technical analysis, TON’s price is projected to reach a minimum of $3.24 in 2026. The maximum price could hit $9.72, with an average trading price of around $6.48.
TON Price Target 2027
Looking forward to 2027, Toncoin’s price is expected to reach a low of $4.86, with a high of $14.58, and an average forecast price of $9.72.
Toncoin Crypto Price Prediction 2028
In 2028, the price of a single TON is anticipated to reach a minimum of $7.29, with a maximum of $21.87 and an average price of $14.58.
Toncoin Price Projection 2029
By 2029, TON’s price is predicted to reach a minimum of $10.94, with the potential to hit a maximum of $32.81, and an average of $21.87.
TON Price Prediction 2030
In 2030, Toncoin is predicted to touch its lowest price at $16.41, hitting a high of $49.22 and an average price of $32.81.
Planning on stacking ETH tokens before it hits $5k? Read our Ethereum price prediction to uncover the possible mysteries!
Market Analysis
Firm Name
2025
2026
2030
Changelly
$19.03
$0.0905
$0.396
Coincodex
$14.33
$5.88
$14.67
Binance
$5.85
$6.14
$7.46
CoinPedia’s Toncoin (TON) Price Prediction
The altcoin has been constantly trading under a bullish influence and displayed positive action in both smaller and larger time frames.
According to CoinPedia’s formulated Toncoin (TON) Price Prediction, if the market gains momentum, the TON token could conclude the year at $6.48.
However, with a bearish trend, the Toncoin price may hit a low of $2.16. This could result in the average price concluding the year at around $4.32.
Year
Potential Low
Potential Average
Potential High
2025
$2.16
$4.32
$6.48
Are you curious to understand the long-term possibilities of the Ripple token? Read CoinPedia’s XRP price prediction to uncover the possible mysteries!
[article_inside_subscriber_shortcode title=”Never Miss a Beat in the Crypto World!” description=”Stay ahead with breaking news, expert analysis, and real-time updates on the latest trends in Bitcoin, altcoins, DeFi, NFTs, and more.” category_name=”Price Prediction” category_id=”6″]
FAQs
How much is 1 Toncoin?
At the time of writing, the price of 1 TON price was [liveprice sym=”Toncoin”]
Is TON a good investment?
Yes, with the upcoming bull run for the Layer-1 projects, this altcoin is expected to outperform major cryptocurrencies in the coming time.
Is Toncoin listed on Binance?
No, the TON token price is not listed on Binance for any trade or service.
How high will the TON price reach by the year 2025?
The Toncoin (TON) price may reach a high of $6.48 by the end of the year 2025.
What will be the minimum and maximum price of TON price by the year 2030?
With a constant rise in the adoption and applications of cryptocurrencies, the Toncoin price may record a maximum of $49.22 and a minimum of $16.41 in 2030.
How much would the price of Toncoin be in 2040?
As per our latest TON price analysis, the Toncoin could reach a maximum price of $320.84.
How much will the TON price be in 2050?
By 2050, a single Toncoin price could go as high as $686.56.
The post Toncoin Price Prediction 2025, 2026 – 2030: Will TON Price Reach $10? appeared first on Coinpedia Fintech News
Story Highlights The live price of the TON token is [liveprice sym=”Toncoin”] Toncoin price could hit a high of $6.48 in 2025. With a potential surge, the TON price may record a high of $49.22 by 2030. Launched in 2018, this Layer-1, Ethereum-based altcoin plays a vital role in the crypto space. Toncoin gained significant …
CryptoQuant analyst Axel Adler Jr. has spotted a potential early sign of a new altcoin wave. In a recent post on X, he revealed that altcoin exchange inflows have dropped sharply – something that’s often followed by strong market rallies. Could this be the start of the next “altseason”?
As of June 27, the average monthly altcoin exchange flow stands at $1.6B, below the annual average of $2.5B. This moderate flow suggests asset consolidation and growing accumulation potential ahead of the next altseason wave.
Adler Jr. noted that the usual monthly inflow of altcoin exchanges has declined by 36%, falling from an annual average of $2.5 billion to only $1.6 billion as of June 27, 2025. This $900 million decline suggests reduced selling pressure, as investors are holding onto their assets rather than liquidating.
Historically, these small inflows have anticipated significant altcoin price rises, as seen during the jumps from August to September 2024 and throughout the second half of 2023.
Adler Jr. noted that in all instances, minimal trading activity preceded significant altcoin price increases, fostering optimism among traders.
Why Lower Inflows Can Be Bullish for Altcoins
So, why does this matter? When less capital is moving into crypto exchanges, it usually means there’s less selling happening. Instead, investors might be accumulating, waiting for the next move up.
CryptoQuant’s data shows that when inflows fall below $1.6 billion, it often sets the stage for a strong altcoin rally. It signals a shift – away from short-term speculation and toward long-term holding. Sometimes, capital temporarily moves into Bitcoin first, before flowing back into altcoins with more strength.
This pattern often builds up momentum. And when that momentum swings back to altcoins, prices can surge quickly.
A Shift Is Happening – Is Altseason Next?
Right now, the market seems to be in a transition phase. The drop in exchange inflows is a classic sign of quiet accumulation, which often comes before a rally. If this pattern holds, it could align with a broader market recovery and renewed risk appetite.
So the big question: is the next altcoin rally around the corner?
If history repeats, we might be witnessing the early signs of another breakout. Stay tuned – the market could be gearing up for a major shift.CryptoQuant Flags $900M Drop in Altcoin Inflows, Hints at Altseason
The post Is Altseason Coming? CryptoQuant Analyst Spots Key Accumulation Signal appeared first on Coinpedia Fintech News
CryptoQuant analyst Axel Adler Jr. has spotted a potential early sign of a new altcoin wave. In a recent post on X, he revealed that altcoin exchange inflows have dropped sharply – something that’s often followed by strong market rallies. Could this be the start of the next “altseason”? As of June 27, the average …
As some investors seek answers for ‘why the market is down today?’, others seek an alternative crypto investment platform. Hedera (HBAR) Investors seem to have discovered a different but simple way to earn crypto profits every day.
As of June, Hedera (HBAR) records a 20% decline in the past month. Despite some analysts suggesting a possible bullish reversal, HBAR continues to trade below $0.15, a major barrier level against HBAR price recovery. To potentially overcome the selling pressure and start a bullish trend, HBAR price will have to rise above the $0.17 threshold. With reports of lesser activity, limited stablecoin flowing into the Hedera network, the prospects of HBAR price rising could be minimal.
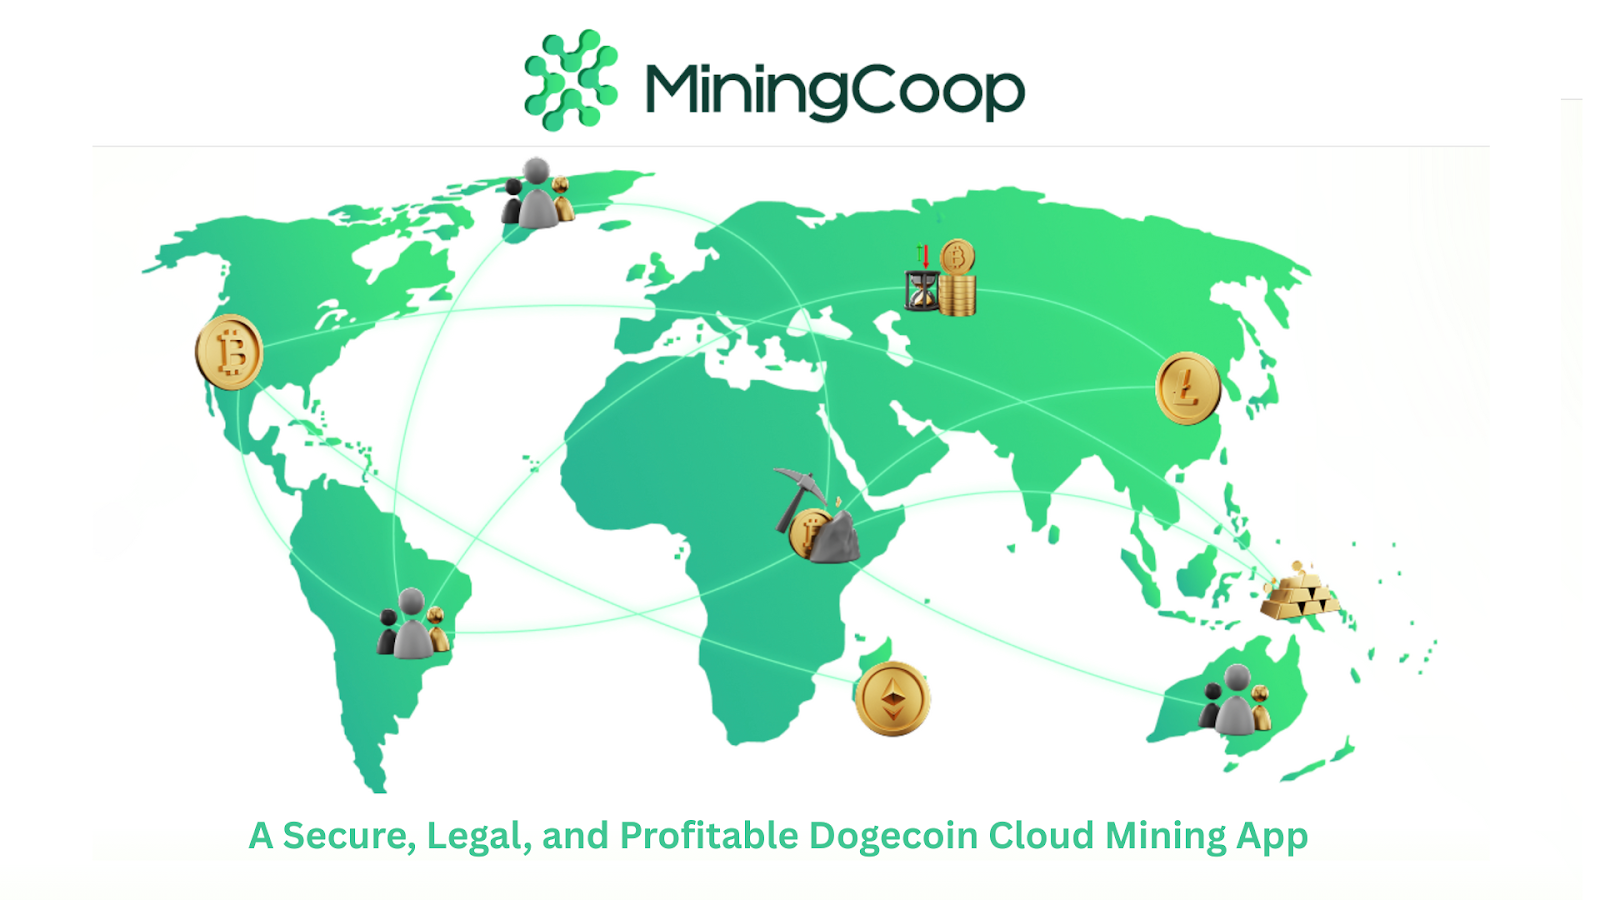
Reportedly, HBAR investors are shifting to cloud mining through MiningCoop. Launched with the aim of making crypto mining rewards accessible to all, MiningCoop offers daily crypto profit earnings through diverse cloud mining contracts.
MiningCoop Presents a New Approach to Bitcoin Mining: Bitcoin Cloud Mining
Traditionally, Bitcoin mining was the most difficult space to join and profit from. Bitcoin mining requires expensive hardware setup or a Bitcoin mining machine. Also, the electricity consumption, often compared to the amount consumed by a whole country, made it almost impossible for ordinary individuals to participate in Bitcoin mining.
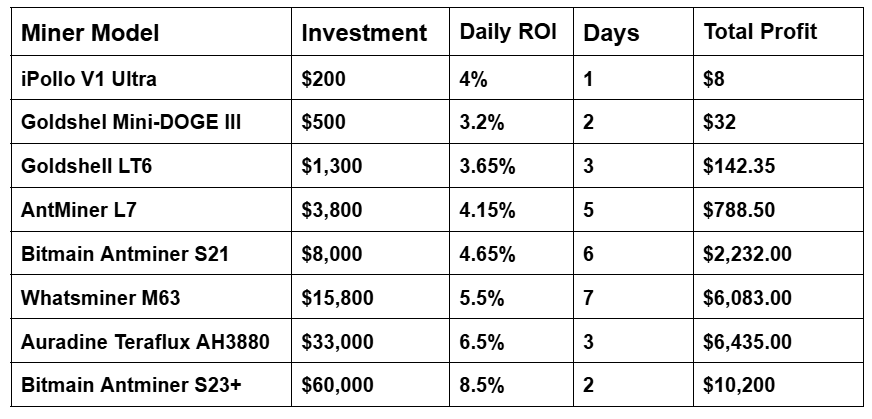
Fortunately, MiningCoop launched cloud mining contracts that allow users to rent Bitcoin mining hashpower, with modest investments starting from $100. MiningCoop owns several Bitcoin mining farms across the globe, powered by renewable energy sources, making it less costly. Also, MiningCoop’s mining farms are fully AI-optimised, adding to cost efficiency. As such, the company achieves high profit margins, translating to high daily returns for the platform users.
High-Yield Daily Crypto Earnings Through MiningCoop
Even better, MiningCoop offers a $100 bonus when users join MiningCoop cloud miners. The $100 helps in purchasing its Jaminer trial contract plan, allowing new investors to explore Bitcoin and Dogecoin cloud mining without spending their money. The $100 and profits of about $1.35 per day can be withdrawn.
What Attracts HBAR Investors to MiningCoop Bitcoin Cloud Mining:
Unlike trading HBAR, which is affected by price fluctuations, MiningCoop offers stable and consistent daily crypto profits.
100% hands-off way to earn crypto. A new passive income stream
Investor fund protection, the principal is refunded fully after each contract duration
Short contract durations of between 1 day to 7 days.
MiningCoop Affiliate Program
Apart from the profitable Bitcoin, Litecoin, and Dogecoin cloud mining contracts, users can join MiningCoop’s affiliate program and earn USDT. The process is simple: sign up for the referral program, get a referral code to conduct social media promotion, and earn 3.5% commission each time a referral invests in MiningCoop.
With a little effort, users could build a passive income stream, offering substantial monthly earnings.
Final Thoughts
The crypto market is down today, indicating a possible liquidation of significant amounts of crypto investors’ money. HBAR investors shifting to Bitcoin, Litecoin, and Dogecoin cloud mining through MiningCoop offers them a good opportunity to earn crypto profits despite market uncertainty.MiningCoop may be a suitable option for individuals exploring cloud mining opportunities.
Welcome to the US Crypto News Morning Briefing—your essential rundown of the most important developments in crypto for the day ahead.
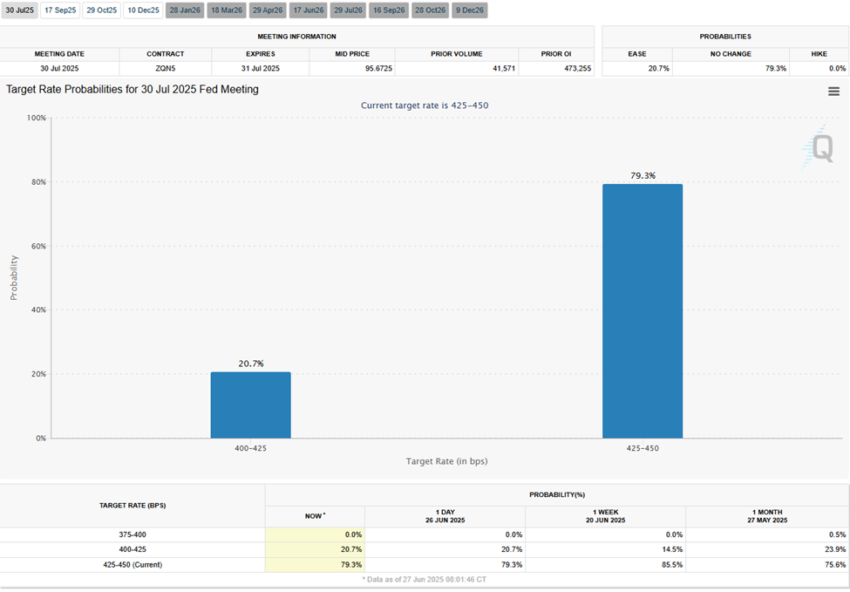
Grab a coffee—you’ll need it. The financial market became much more unpredictable due to creeping inflation, political power plays, and market jitters. As the Federal Reserve (Fed) holds steady, new reports suggest the next big shift may come not from data, but from Donald Trump.
Crypto News of the Day: US Inflation Rises While Spending Slips
The Fed’s preferred inflation gauge, PCE (Personal Consumption Expenditures), rose in May. According to the latest data, the Core PCE Price Index rose 0.2% month-over-month (MoM) and 2.7% year-over-year (YoY), slightly above forecasts.
Headline PCE came in as expected, rising 0.1% on the month and 2.3% YoY
*US MAY PCE PRICE INDEX RISES 0.1% M/M; EST. +0.1% *US MAY CORE PCE PRICE INDEX RISES 0.2% M/M; EST. +0.1% *US MAY PCE PRICE INDEX RISES 2.3% Y/Y; EST. +2.3% *US MAY CORE PCE PRICE INDEX RISES 2.7% Y/Y; EST. +2.6%
Further, signs of weakening consumer momentum emerged as personal income fell 0.4%. Meanwhile, real personal spending declined 0.3%. Both of these US economic indicators missed forecasts, reflecting softening economic conditions.
*US MAY PERSONAL INCOME FALLS 0.4% M/M; EST. +0.3% *US MAY PERSONAL SPENDING FALLS 0.1% M/M; EST. +0.1% *US MAY REAL PERSONAL SPENDING FALLS 0.3% M/M; EST. +0.0%
While these inflation numbers reinforce the Fed’s cautious stance, political drama overshadows them. The growing possibility that President Donald Trump could soon install a MAGA-aligned Federal Reserve chair continues to shake financial markets.
Trump vs. Powell: Markets eye MAGA-friendly Fed Reshuffle
In his recent testimony before the Senate Banking Committee, Fed chair Jerome Powell said he expects inflation to increase this summer because of the Trump administration’s tariffs.
Meanwhile, reports indicate that Trump is considering replacing Powell with a loyalist as early as this summer.
There is deep momentum in Washington building for Jerome Powell’s resignation.
While his term ends in May 2026, the move would undercut Powell’s final year in office, potentially injecting political risk into an institution long prized for its independence.
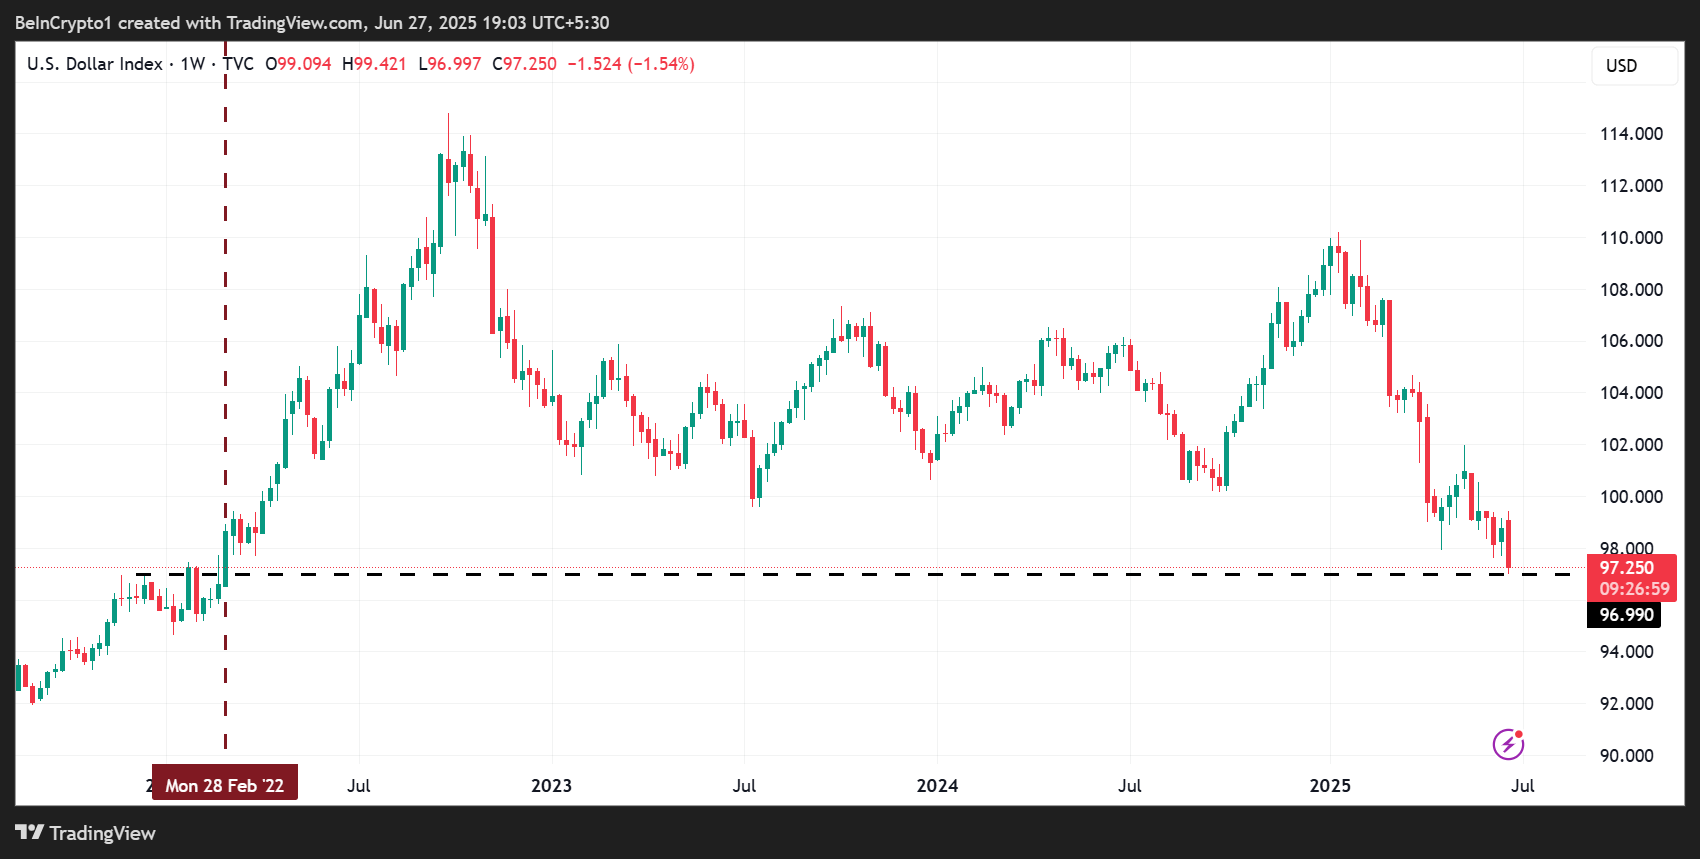
The political maneuvering triggered a sharp reaction in the currency markets, sending the US dollar to a three-year low. The dip comes amid fears of a politicized monetary policy environment ahead of 2026.
In recent weeks, he’s called Powell the “WORST” and a “dummy” who is “costing America $Billions.” Behind closed doors, insiders say Trump is vetting candidates who would be “unstintingly loyal” and willing to implement rate cuts aligned with his economic agenda.
Reacting to the news, the US Dollar Index (DXY) is trending lower, revisiting levels last seen in 2022.
As inflation reawakens and spending slows, markets grapple with a new risk: that monetary policy could once again be steered by political loyalty rather than economic logic.
Chart of the Day
US Dollar Index (DXY) drops to a 3-year low. Source: TradingView
Byte-Sized Alpha
Here’s a summary of more US crypto news to follow today:
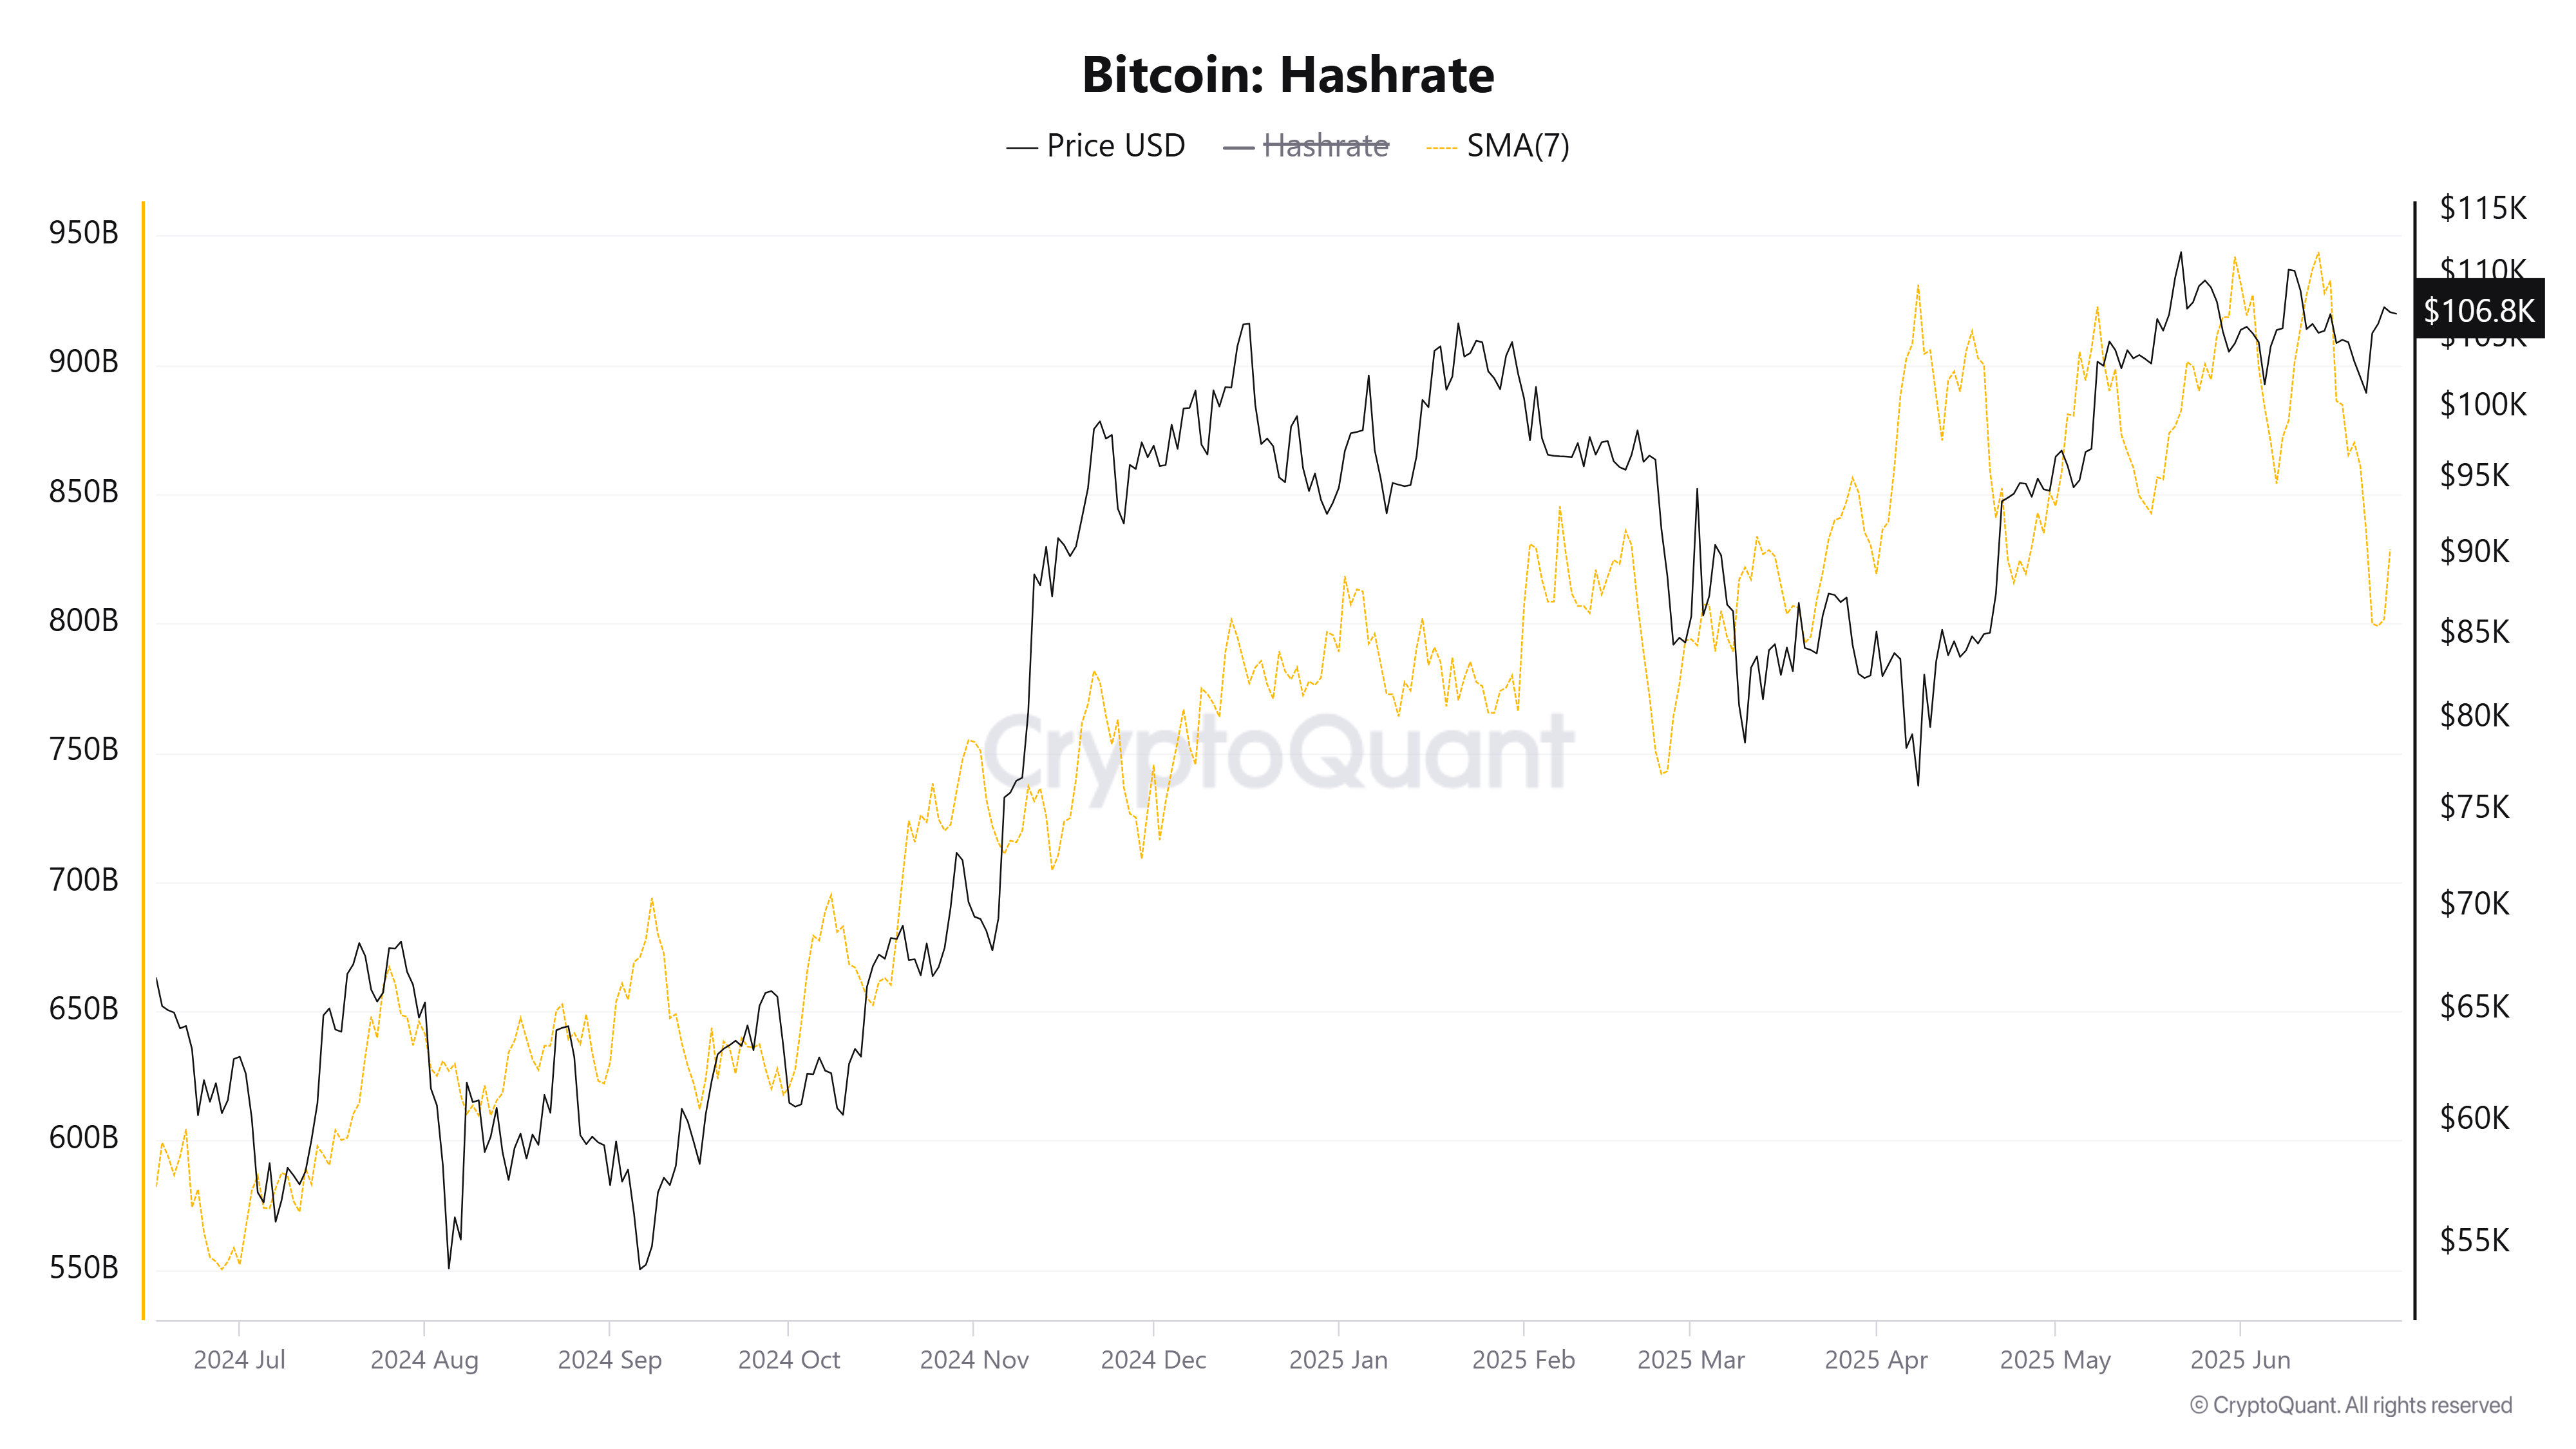
In June, Bitcoin’s hashrate suddenly plunged to its lowest level in over a year. The decline came amid heightened political tensions between the US and Iran, prompting speculation about a potential geopolitical connection.
However, experts remain divided. What are the arguments on both sides of the debate? Here’s a deeper look.
Bitcoin Hashrate Plunges After ATH – Is Iran the Culprit?
Hashrate, a key metric measuring the computational power securing the Bitcoin network, indicates the scale and health of mining activity.
A high hashrate means more miners participate, making the network more secure. When the figure drops, it typically suggests that many miners have paused operations for some reason.
According to CryptoQuant, the 7-day average Bitcoin hashrate dropped to 800 EH/s — its lowest level since March 2025.
This sharp decline occurred between June 14 and 24, coinciding with rising military tensions involving Israel, the US, and Iran.
Nic, founder of CoinBureau, proposed a provocative theory. He suggested Iran may have converted oil into Bitcoin to bypass sanctions and fund state spending.
In a post on X, Nic estimated that about 3.1% of the global Bitcoin hashrate could be coming from Iran.
About 1 in every 32 Bitcoin may be mined in Iran
According to some reports, Iran may account for ~3.1% of global BTC mining.
Why?
They figured out how to turn oil into crypto to dodge sanctions and spend freely.
He argued that the drop in hashrate following US airstrikes might not be coincidental. Bitcoin mining facilities operated by Iran’s Islamic Revolutionary Guard Corps (IRGC) could have been targeted.
This theory is supported by blockchain analytics firm Elliptic, which has reported that Iran uses Bitcoin mining as a financial tool to withstand international sanctions.
Mike Alfred, another analyst, went further. He claimed that Iran is not only evading sanctions with Bitcoin, but also selling BTC obtained through cyberattacks to buy missiles and upgrade its uranium enrichment infrastructure.
“We might have entered an era where countries are bombing each other’s Bitcoin mining facilities as part of the global hash war I predicted in 2017,” Max Keiser told BeInCrypto.
Could the US Be the Real Cause?
Rob Warren, author of The Bitcoin Miner’s Almanac, offered a different view. He suggested the drop may be rooted in domestic conditions in the US, not geopolitical conflict.
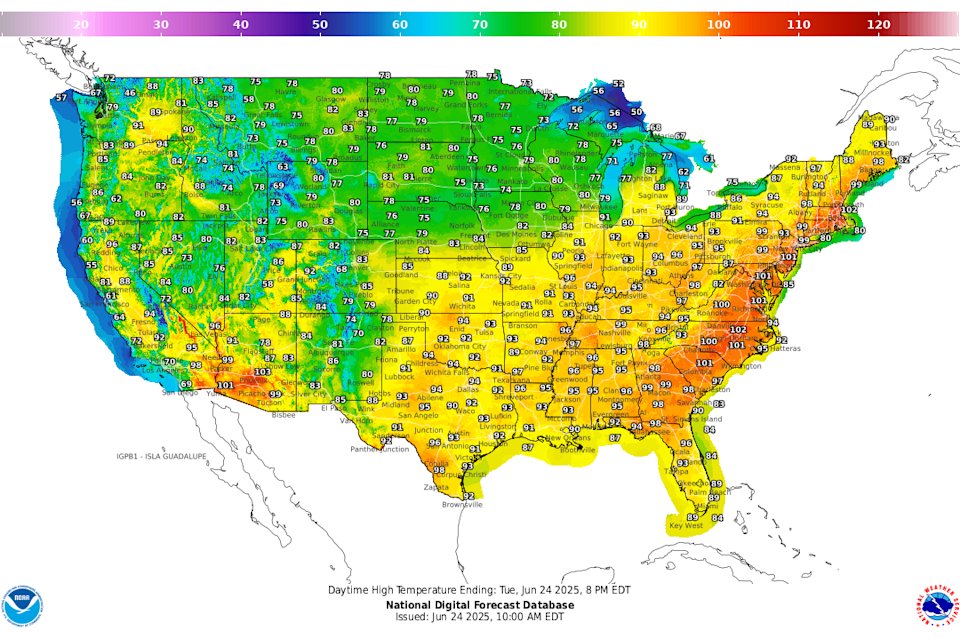
Instead of blaming airstrikes in Iran, Warren pointed to extreme heat in the US as a more likely factor.
“It’s impossible to know at any given moment how many miners are operating. Block time is the only proxy we have for existent hashrate. My guess is curtailment due to the US heat dome, combined with many other unknowns. I don’t think Iran is a single cause,” Warren said.
Tech investor Daniel Batten agreed and applied Occam’s Razor — the idea that the simplest explanation is usually correct.
He noted that record-high temperatures in Texas drove up electricity demand on the ERCOT power grid, forcing miners to scale down operations to prevent overload.
Data from the US Energy Information Administration (EIA) shows electricity usage in Texas has surged, partly due to the growth of data centers and mining facilities. Natural gas-powered electricity generation is projected to increase by 8% in 2025.
The crypto community watches closely for definitive answers as geopolitical instability and climate-related disruptions rise. Regardless of the cause, this hashrate drop will likely have long-term implications for Bitcoin’s price and mining strategies.
The cryptocurrency market has rebounded slightly this week following President Trump’s Monday announcement of the Israel-Iran ceasefire.
Some assets have since extended their rallies, while others posted more tepid performances, struggling to maintain upward momentum. Amid this mixed market recovery, on-chain data reveals that crypto whales have been quietly accumulating select altcoins, including UNI, WLD, and SAND.
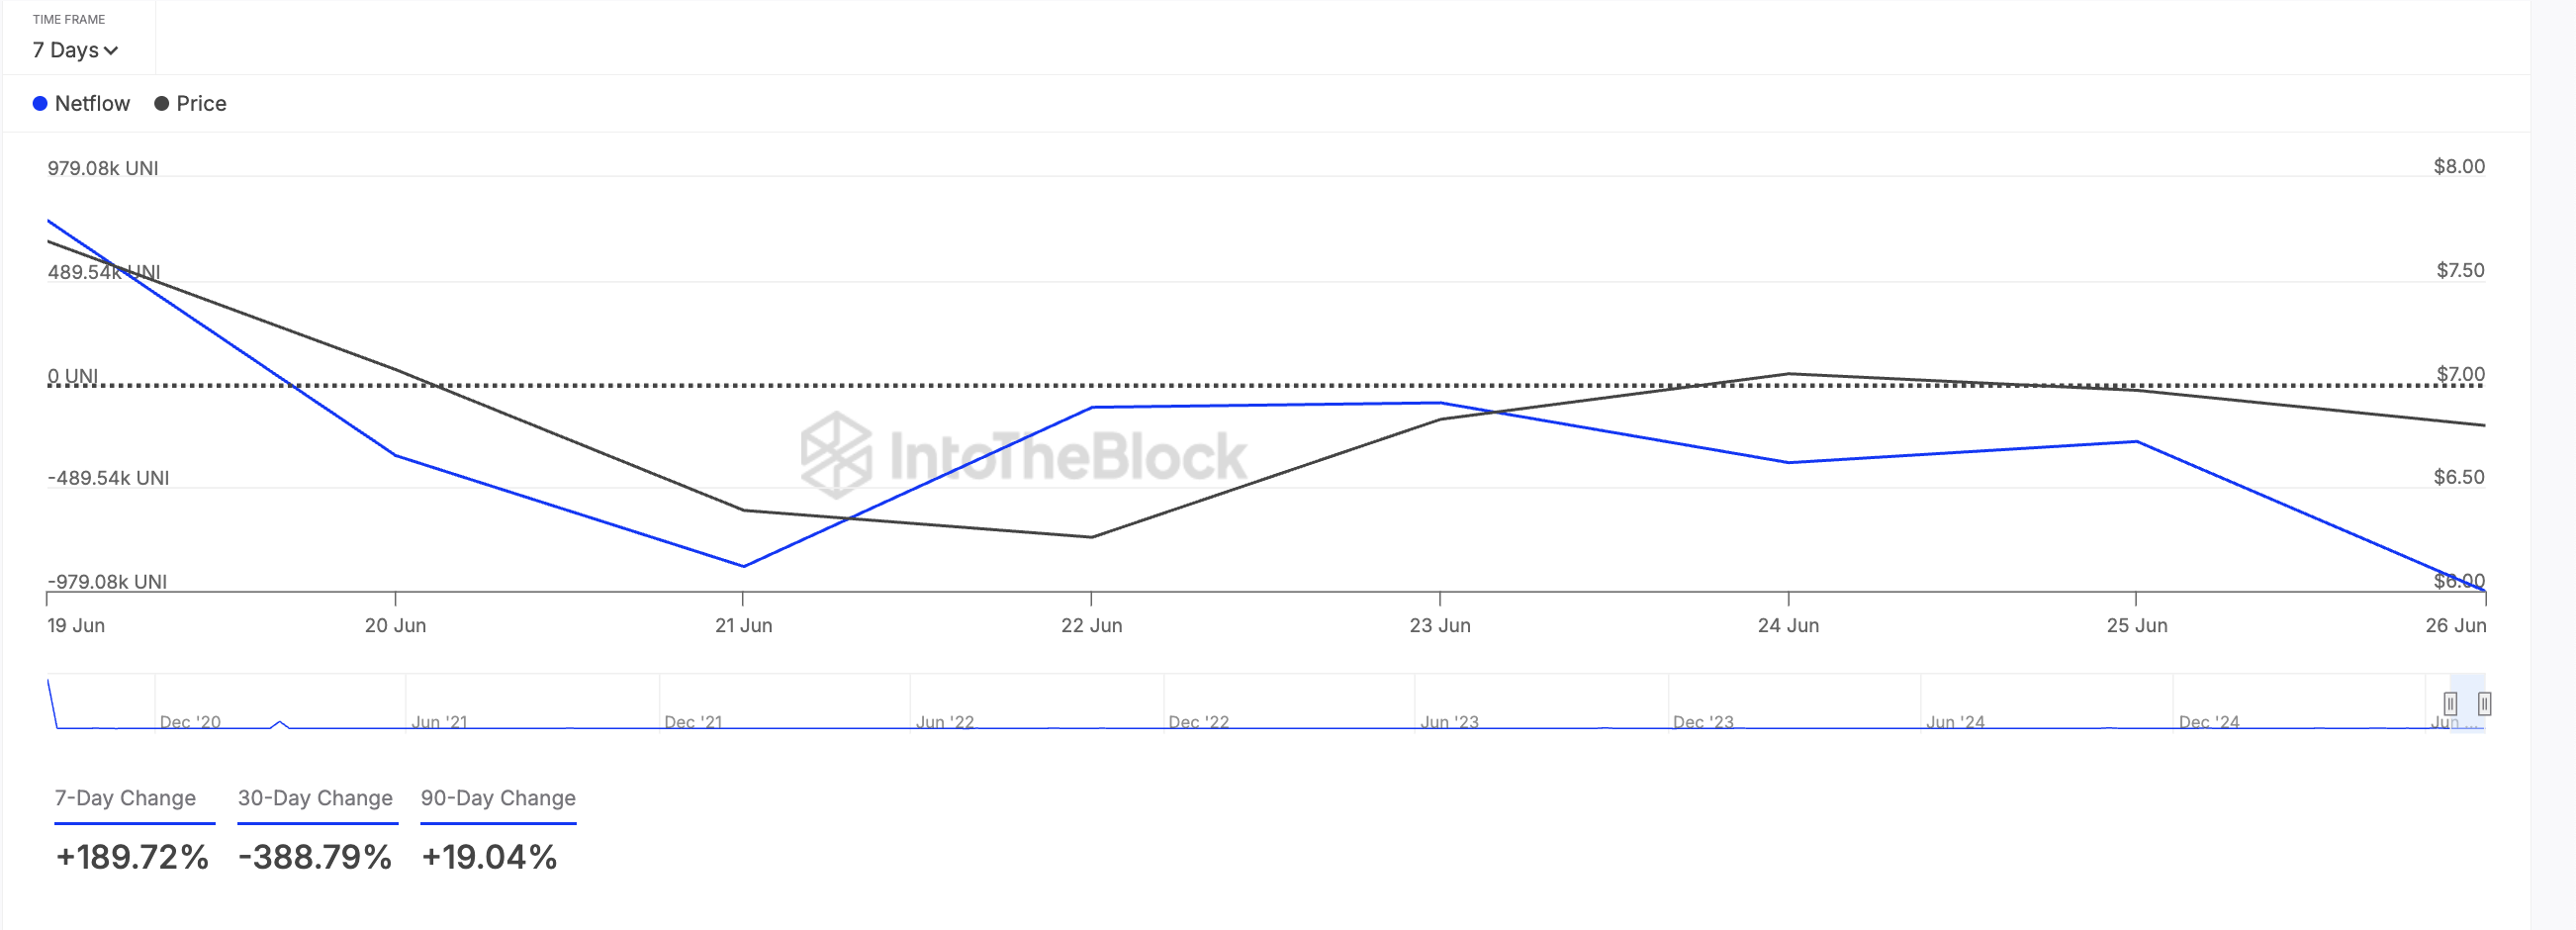
Uniswap (UNI)
This week, decentralized finance (DeFi) token UNI has received significant whale attention. This is reflected by its large holders’ netflow, up 190% over the past seven days, per IntoTheBlock.
Large holders are investors that hold more than 0.1% of an asset’s circulating supply. Their netflow measures the difference between the amount of tokens that they buy and sell over a specified period. When it surges like this, it signals strong accumulation by whales, suggesting growing confidence or a bullish outlook on the asset.
Moreover, the surge in large holder netflow could prompt retail traders to ramp up their UNI accumulation. If this buying pressure continues, the altcoin could break into the $7 price zone.
On the other hand, if demand falls, the token’s price could dip to $5.91.
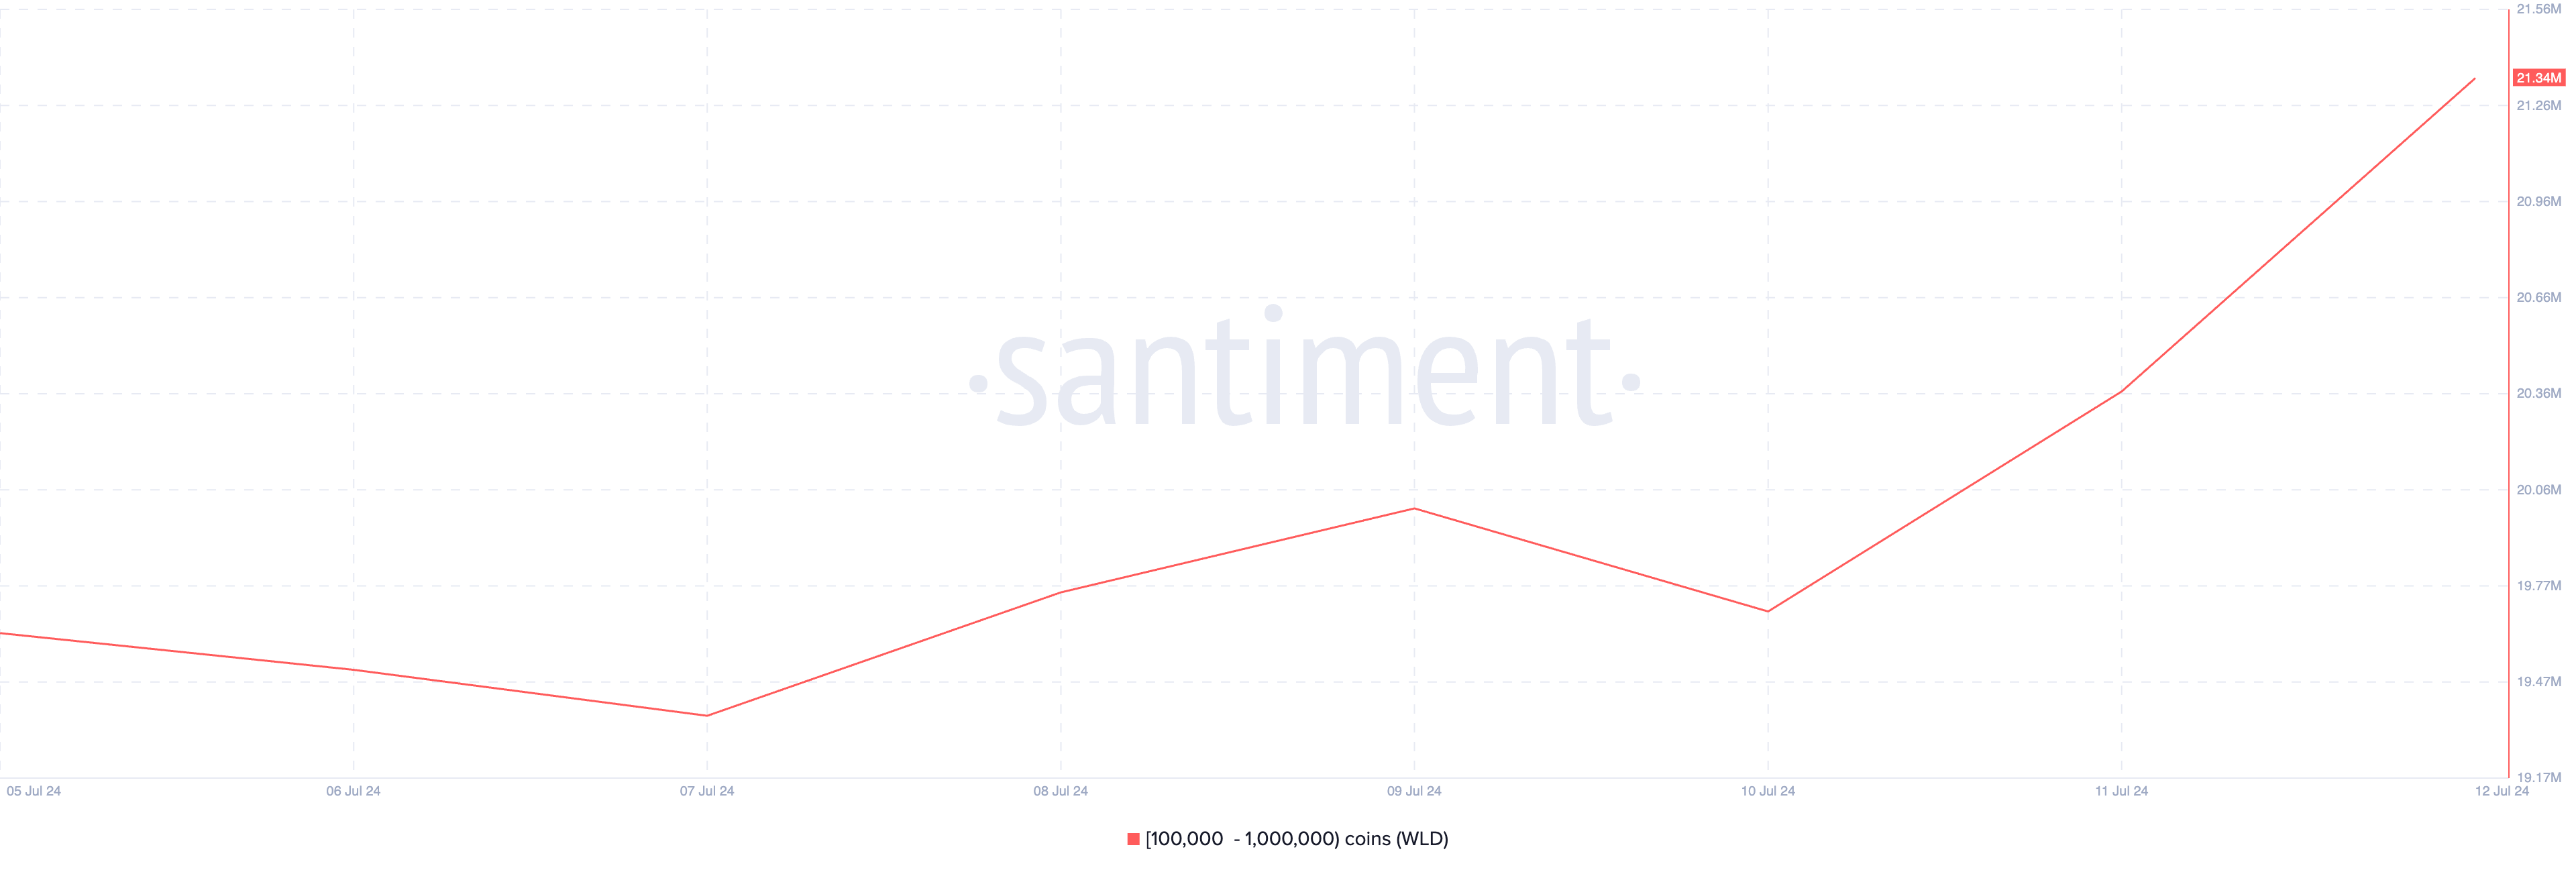
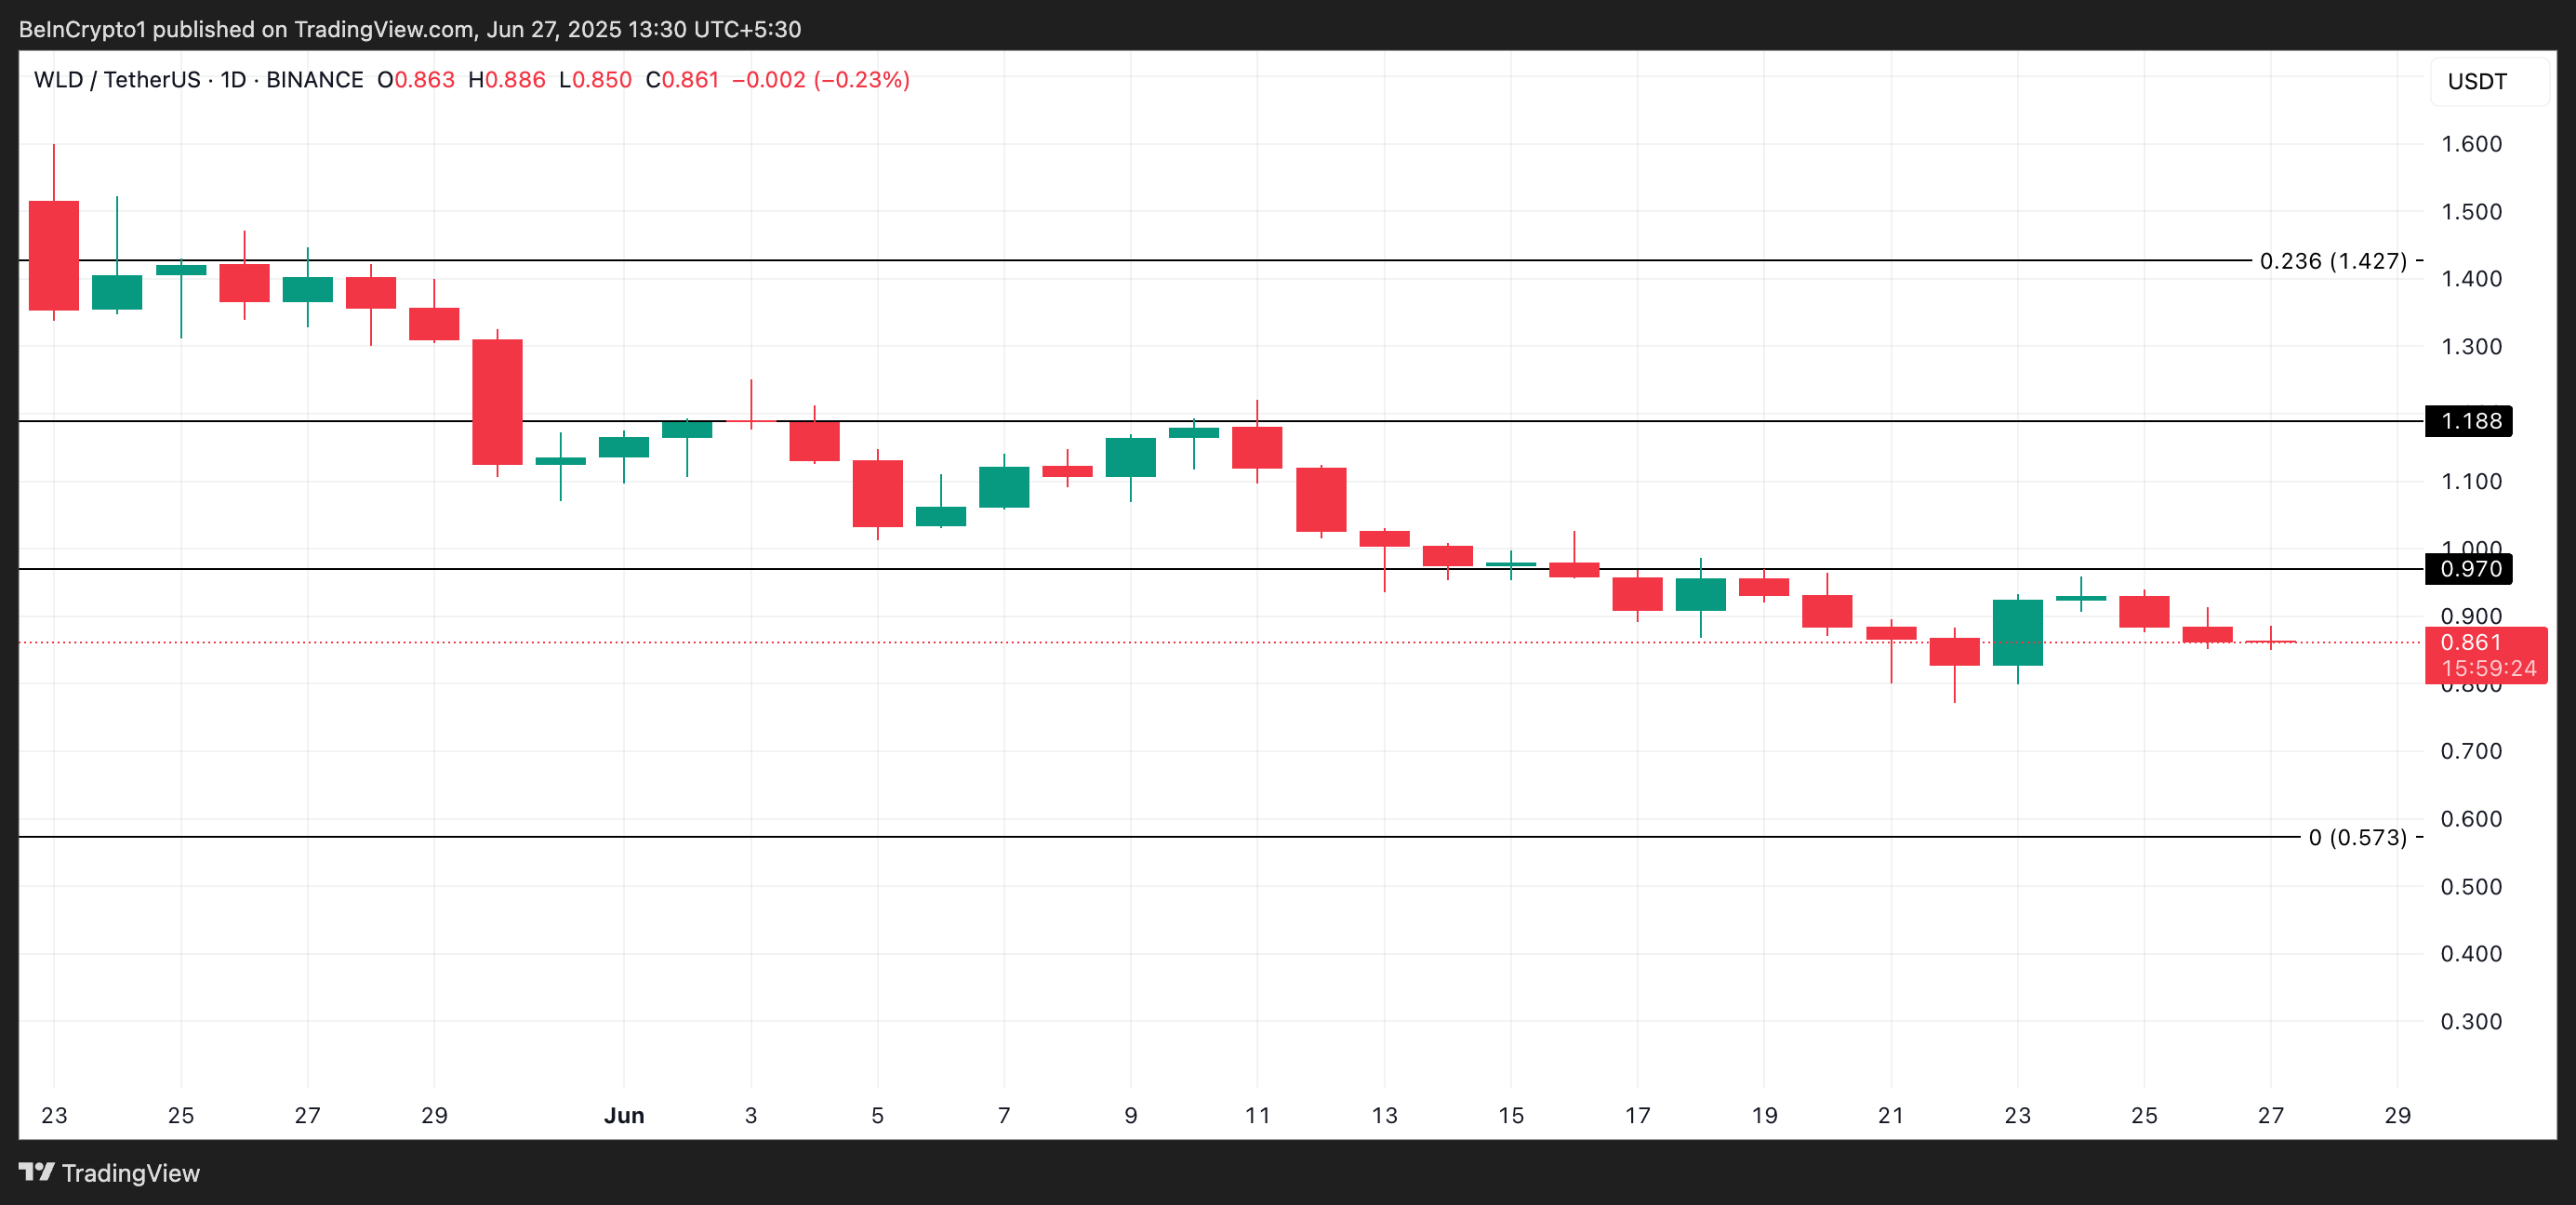
Worldcoin (WLD)
WLD, the token that powers Sam Altman’s Worldcoin, is another altcoin that crypto whales have bought this week. Data from Santiment shows a notable rise in the coin holding of whale wallet addresses that hold between 100,000 and 1 million WLD tokens.
During the week in review, this cohort of WLD holders acquired 1.72 million tokens, which are currently valued at over $3 million.
However, if sentiment flips bearish and whales sell for profit, WLD could shed some of its value and plunge toward $0.57.
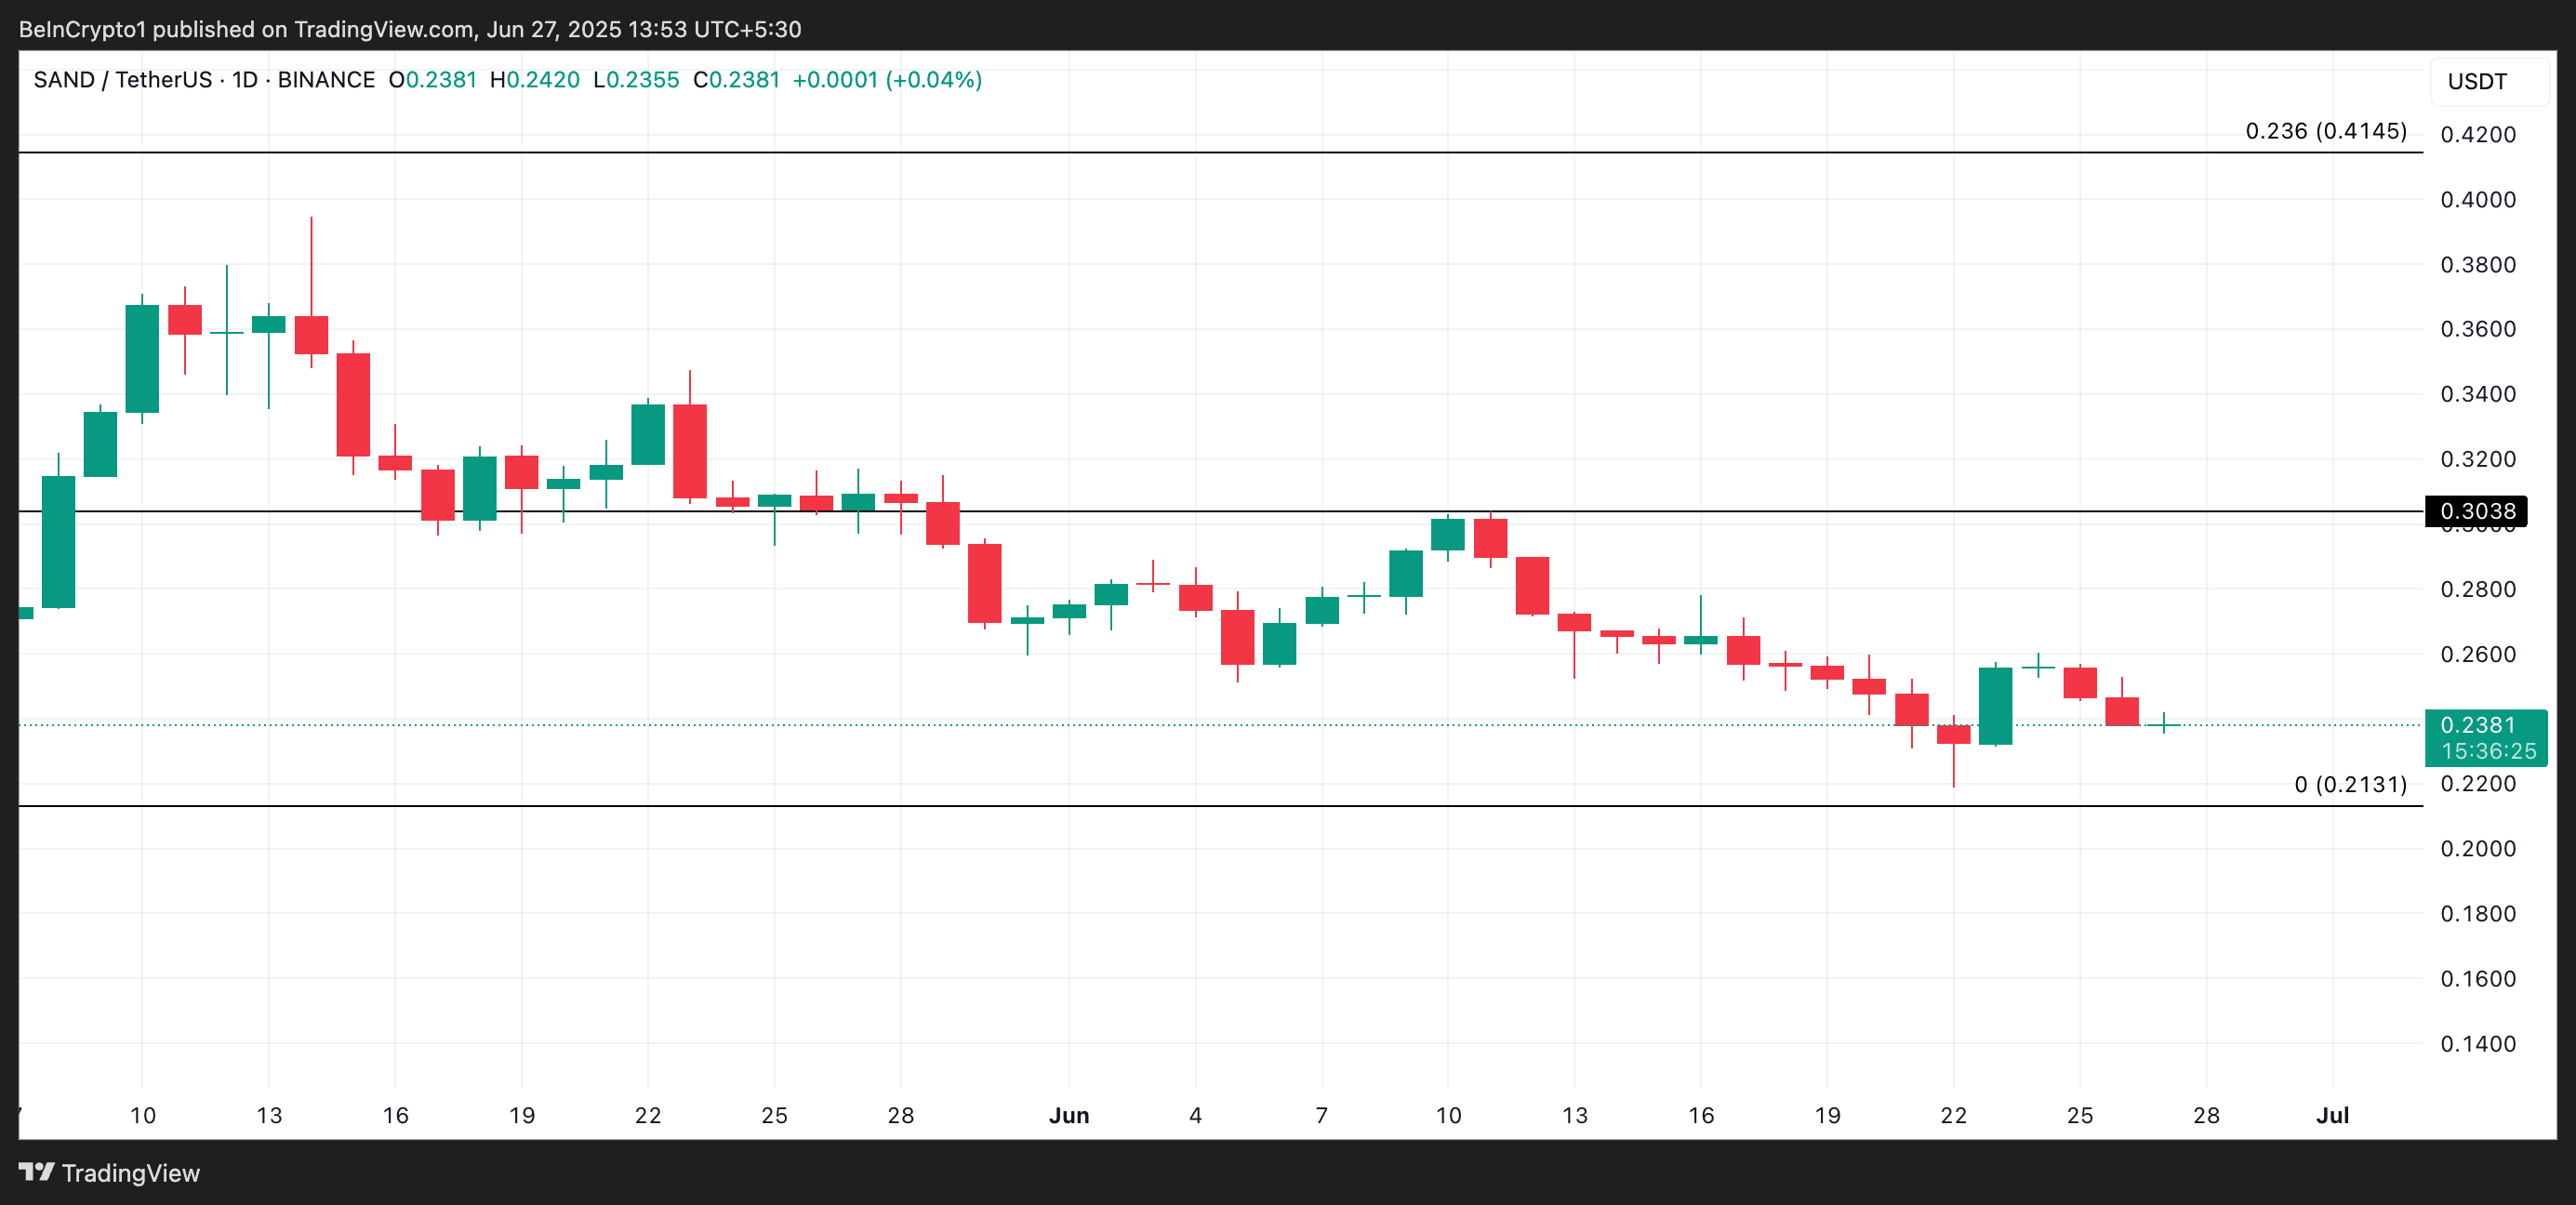
The SandBox (SAND)
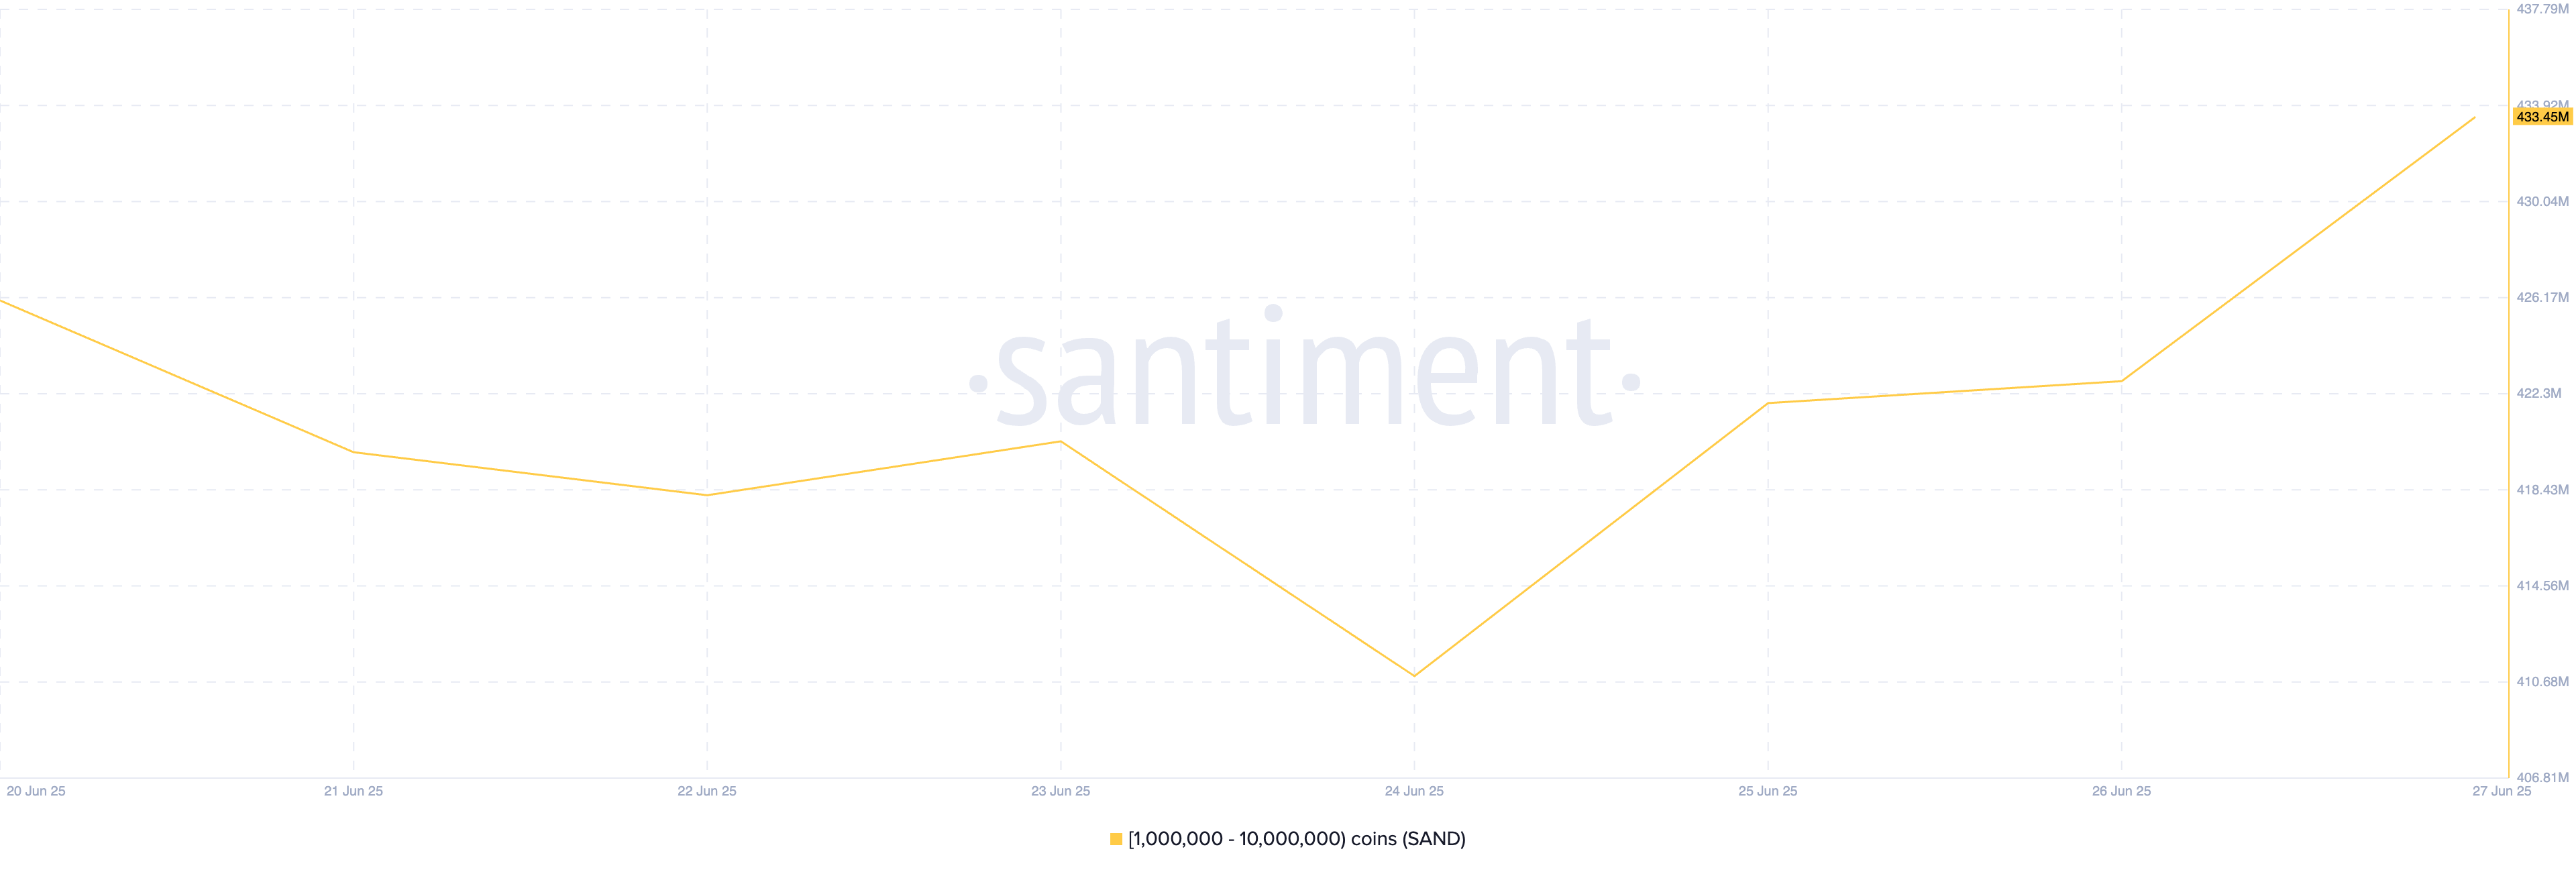
Metaverse-based token SAND is another asset that has seen a surge in crypto whale activity this week. According to data from Santiment, large investors holding between 1 million and 10 million tokens have accumulated 7.45 million SAND over the past week.
This significant uptick in whale accumulation suggests growing confidence in SAND’s long-term potential.
If this buying trend extends to retail traders, it could further strengthen the token’s bullish momentum in the coming weeks and push its price toward $0.30.
In the midst of this altcoin winter, corporate crypto firms like Coinbase, Circle, and Robinhood are outperforming all the leading tokens. Even Bitcoin is performing worse than companies that routinely purchase it.
A few factors, like supply and demand, improving macro sentiment after today’s US-China trade deal, and institutional preference for BTC, are powering this trend.
Meanwhile, corporate crypto firms like Coinbase are reaching an all-time high, and some analysts wonder if this market is replacing altcoins altogether:
Crypto equities are looking like better investments than alt tokens this cycle.@circle, @coinbase and @RobinhoodApp have crushed $BTC, $ETH and $SOL over the past month.
This is happening because TradFi has a much better set-up:
This notion might seem discouraging, but convincing pieces of evidence from many industry sectors support the claim. There are only a few corporate crypto stocks to invest in, paired up against countless altcoins.
Further, institutional investors have much more capitalization and liquidity than retailers. These supply and demand issues funnel capital into a few stocks.
And today, Trump announced a trade deal with China, potentially ending the highly feared tariff war. As a result, Wall Street has been rallying, and US crypto stocks are a part of it.
— The Kobeissi Letter (@KobeissiLetter) June 26, 2025
In other words, a handful of “crypto stocks” are essentially running on Bitcoin. A retail investor could now build a diversified portfolio of corporate BTC holders while totally abandoning the altcoin market. That wasn’t possible even a year ago.
Nonetheless, casting this issue in terms of corporate distaste for altcoins is an oversimplification. After all, Bitcoin itself has been extremely volatile lately.
All that is to say, this is a very worrying situation for several reasons. Obviously, this trend completely goes against the very concept of DeFi.
If corporate investors become the crypto industry’s primary market movers, why would anyone use altcoins? How will a decentralized economy function with this much centralization?
Moreover, it doesn’t look sustainable. Coinbase is ravenously investing in Bitcoin while simultaneously outperforming it. If crypto companies keep surpassing the actual industry, empty speculation will become a major engine of future growth.
In todays evolving world of technology, old blockchains are ill-equipped to deal with quantum threats, including cryptos with large market capitalizations. And how could it be? At the time when Bitcoin was created, devs were so enthralled with the robustness created by a near fail-safe network of systems that an emerging quantum threat didn’t come


 Adler Jr (@AxelAdlerJr)


 Domestic model: Burn oil/gas to power rigs…