Can XRP Reach a New All-Time High As the Ripple Lawsuit is Over?

XRP is rallying after the SEC officially dropped its lawsuit against Ripple, triggering a 13% price surge in the past 24 hours. Strong technical signals and growing market participation are supporting the bullish momentum.

XRP’s network activity is also hitting record levels, with active addresses soaring to new highs. As traders digest the legal victory and positive market signals, XRP’s outlook is strengthening, increasing the chances of further upside in the near term.

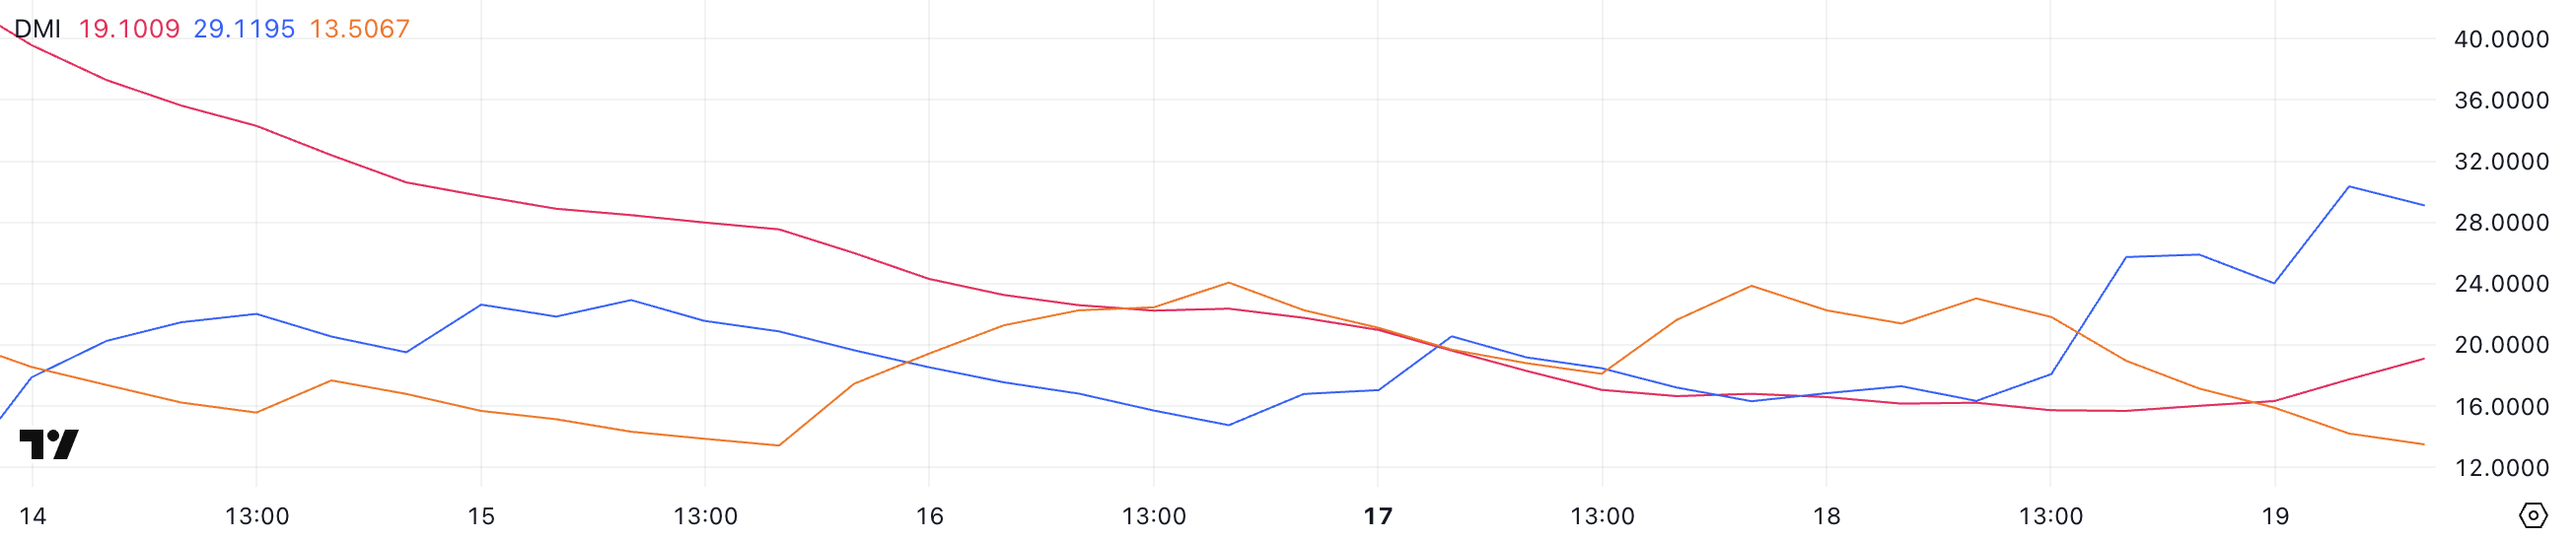
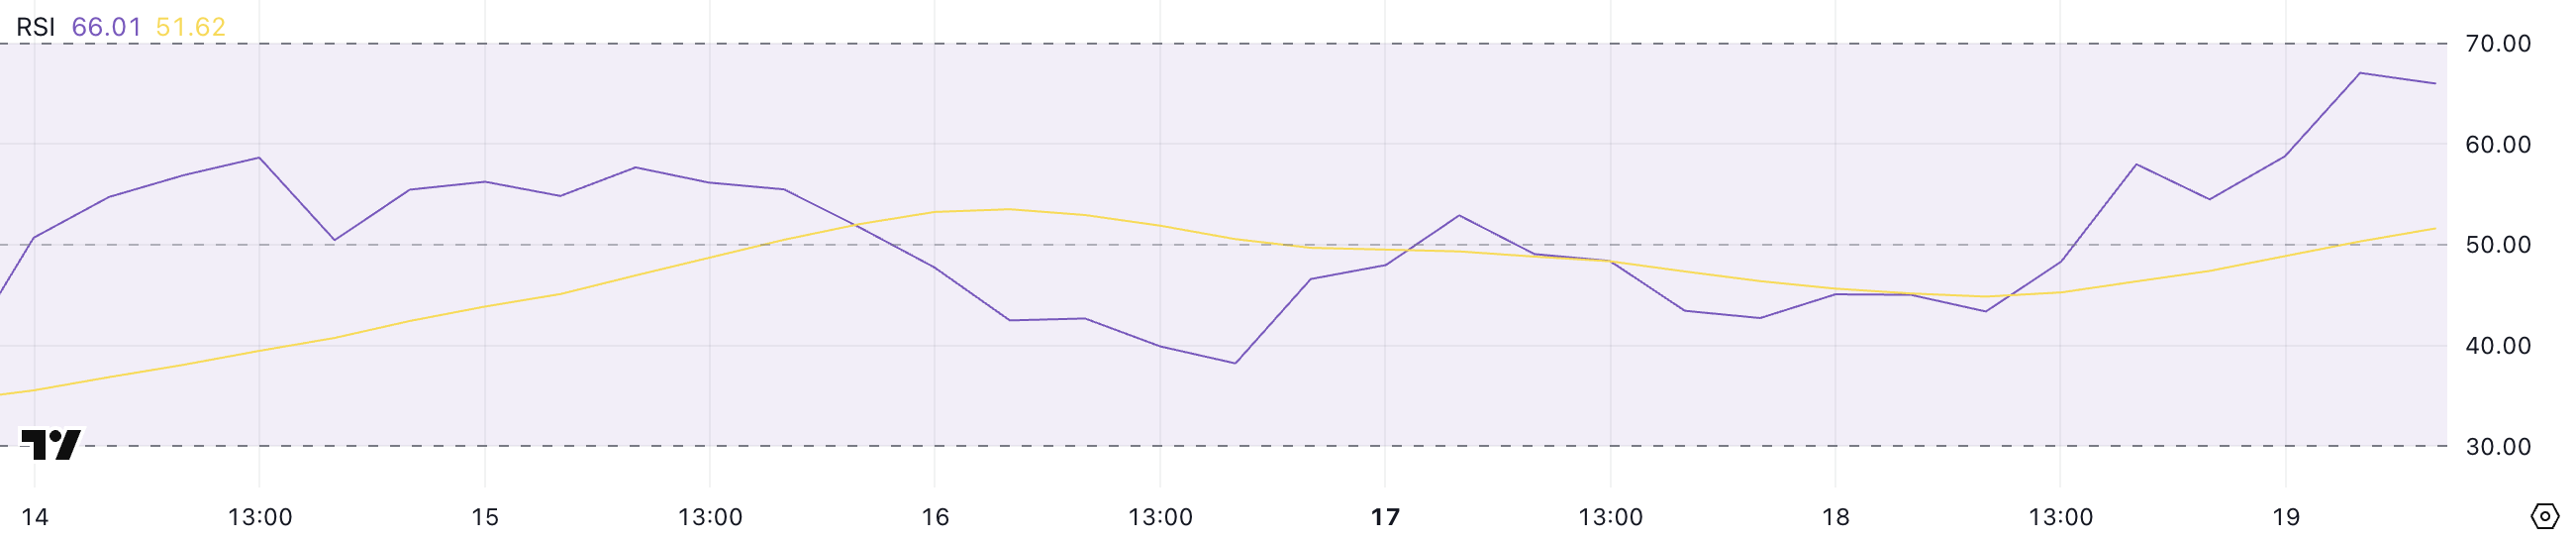
XRP DMI Shows Buyers Are In Full Control

XRP’s DMI chart reveals a notable shift in momentum, with its ADX (Average Directional Index) rising to 20.4 from 15.64 following the news that the SEC is dropping its lawsuit against Ripple.

This increase signals a strengthening market trend, as the ADX tracks the overall strength of a trend without specifying its direction.

The recent surge suggests that the price action is gaining conviction, especially as the market digests the positive legal developments surrounding Ripple.

XRP DMI.
XRP DMI. Source: TradingView.

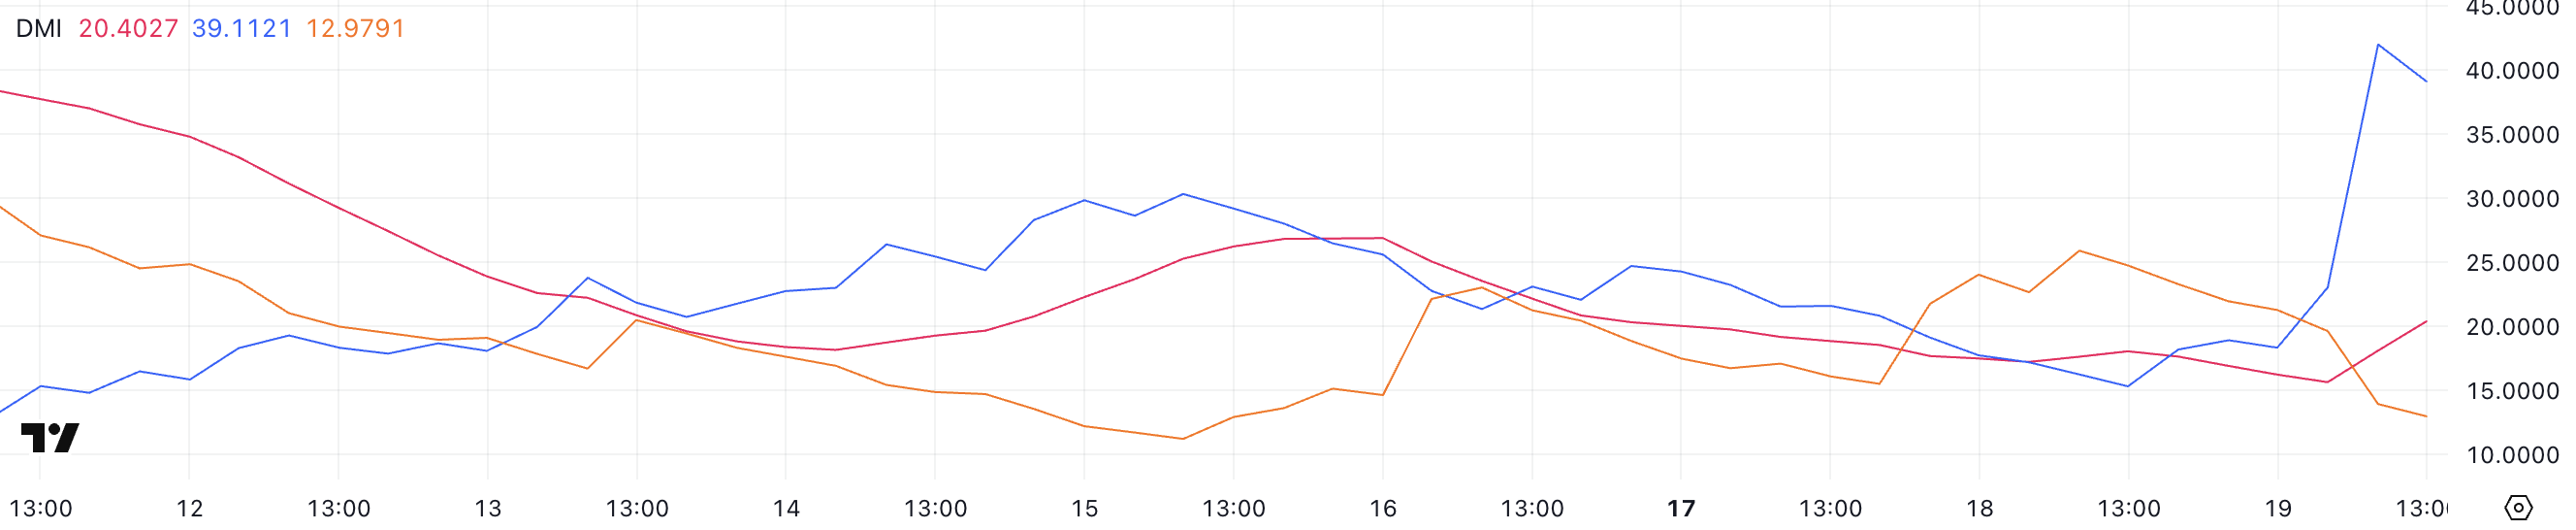
The ADX is often used alongside the +DI and -DI indicators, which help identify trend direction. Typically, an ADX above 25 confirms a strong trend, while values below 20 suggest a weak or range-bound market.

In XRP’s case, the +DI has jumped from 18.3 to 39, while the -DI has dropped from 19.63 to 12.97, indicating a clear bullish divergence.

This sharp rise in buying strength (+DI) combined with a weakening bearish signal (-DI) supports the idea that XRP is attempting to maintain and possibly extend its uptrend. If this dynamic continues, it could see further upside in the short term as bullish momentum builds.

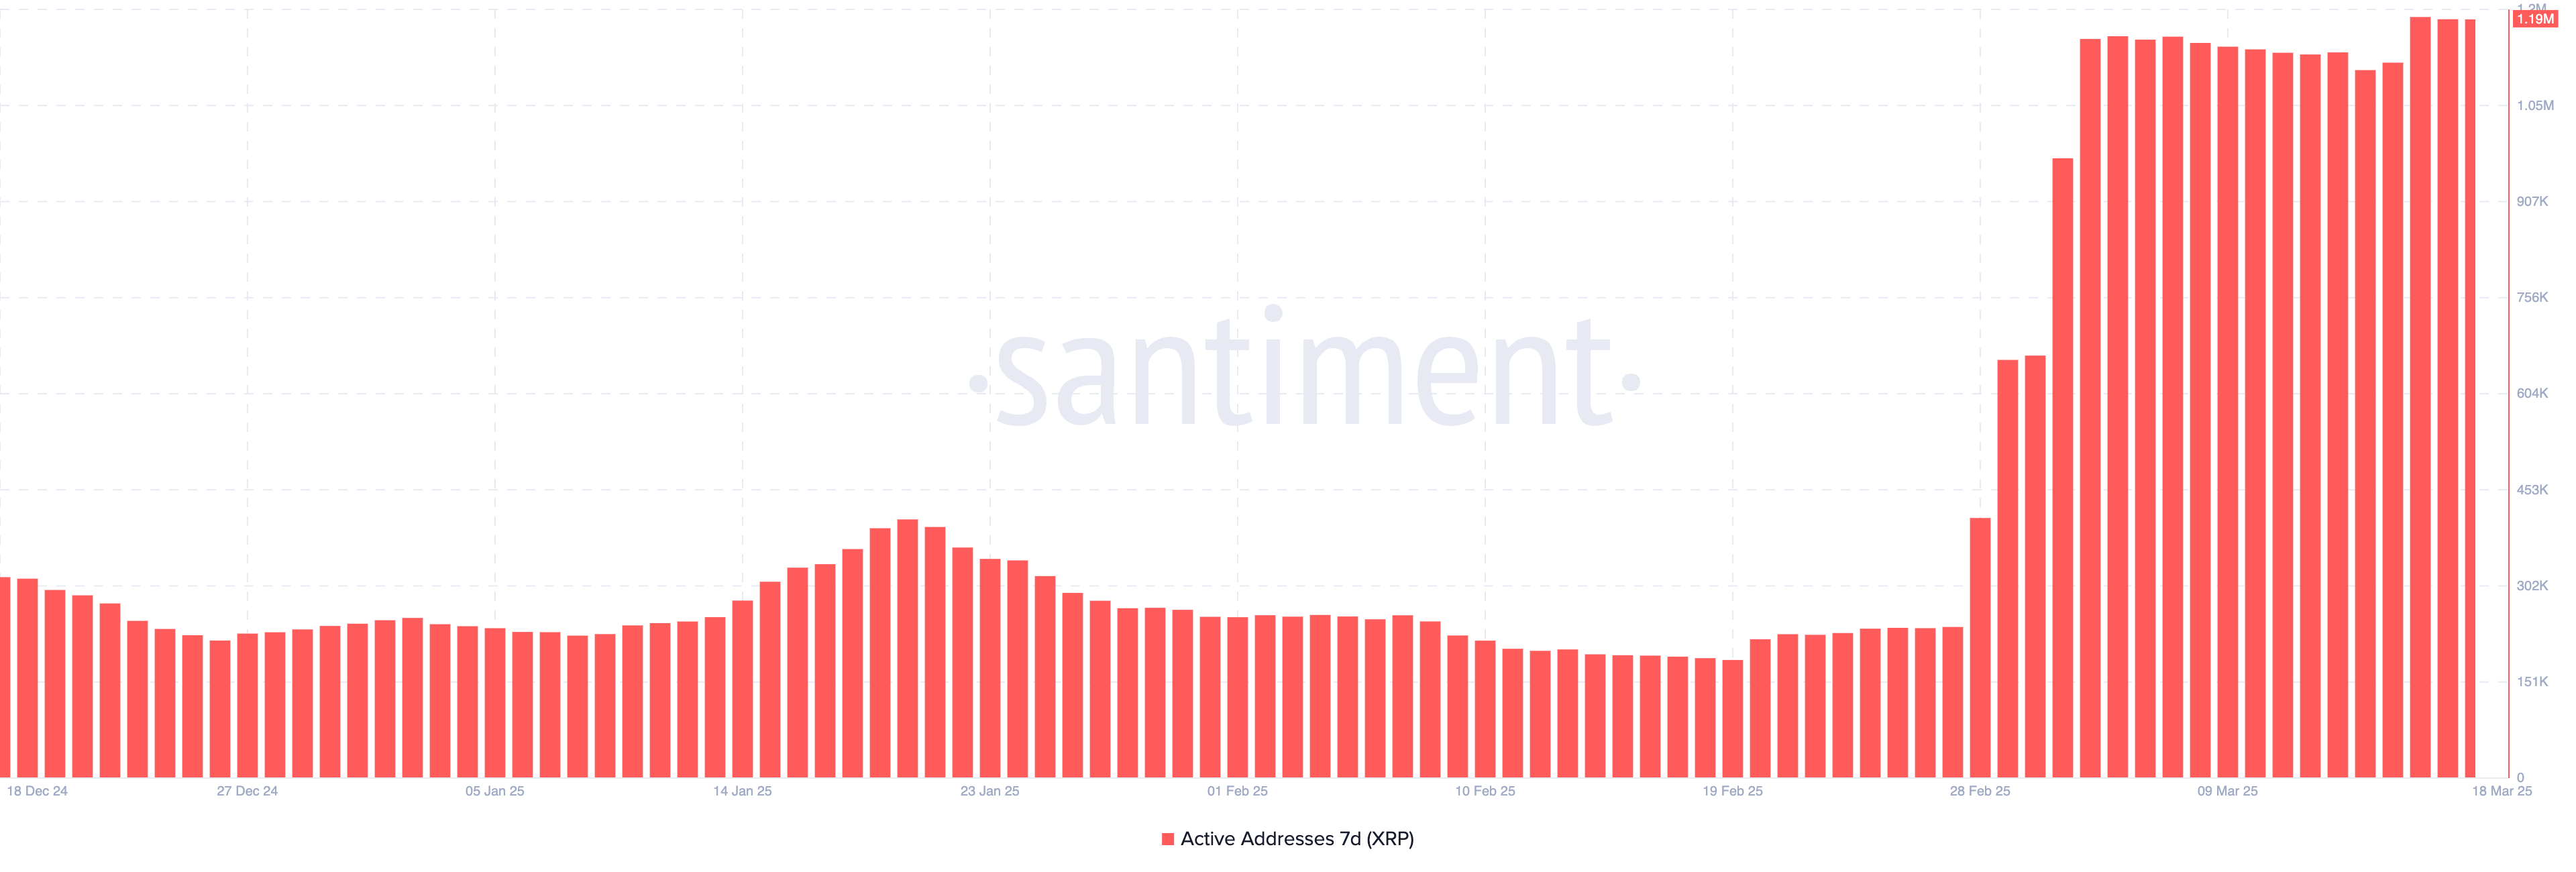
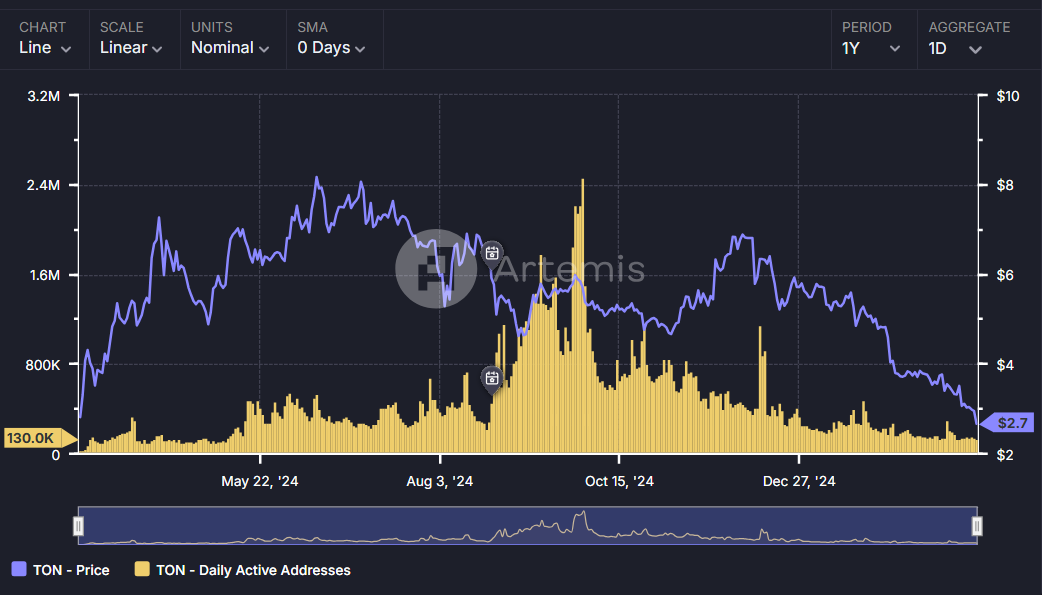
XRP Active Addresses Are Reaching New Records

XRP’s network activity has been surging, with the number of 7-day Active Addresses reaching an all-time high of 1.19 million. This is a massive increase from the 237,000 recorded on February 27, marking an almost fivefold rise in just a few weeks.

The spike in active addresses signals that XRP’s blockchain is seeing heightened participation, whether from retail traders, institutional players, or speculative interest.

Such elevated levels of activity are rarely seen and could indicate growing attention and usage of the network.

7-Day XRP Active Addresses.
7-Day XRP Active Addresses. Source: Santiment.

Tracking the number of active addresses is crucial as it offers insight into the level of user engagement and real demand on the blockchain.

Generally, an increase in active addresses can suggest that more participants are transacting or interacting with the network, which often correlates with stronger liquidity and potentially higher price volatility. In XRP’s case, this record-breaking surge in activity could act as a bullish signal, hinting at growing interest and possibly renewed capital inflows.

While it doesn’t guarantee immediate price appreciation, such strong network participation could help support XRP’s price and reduce downside risk, especially if coupled with other bullish technical or fundamental factors.

Can XRP Reach $3 Soon?

Its EMA lines are currently pointing to a potential new golden cross forming soon.

Should this scenario unfold, XRP price may first challenge the resistance at $2.648. If buying momentum strengthens further, the price might push toward $2.99, potentially breaking above the barrier at $3.

XRP Price Analysis.
XRP Price Analysis. Source: TradingView.

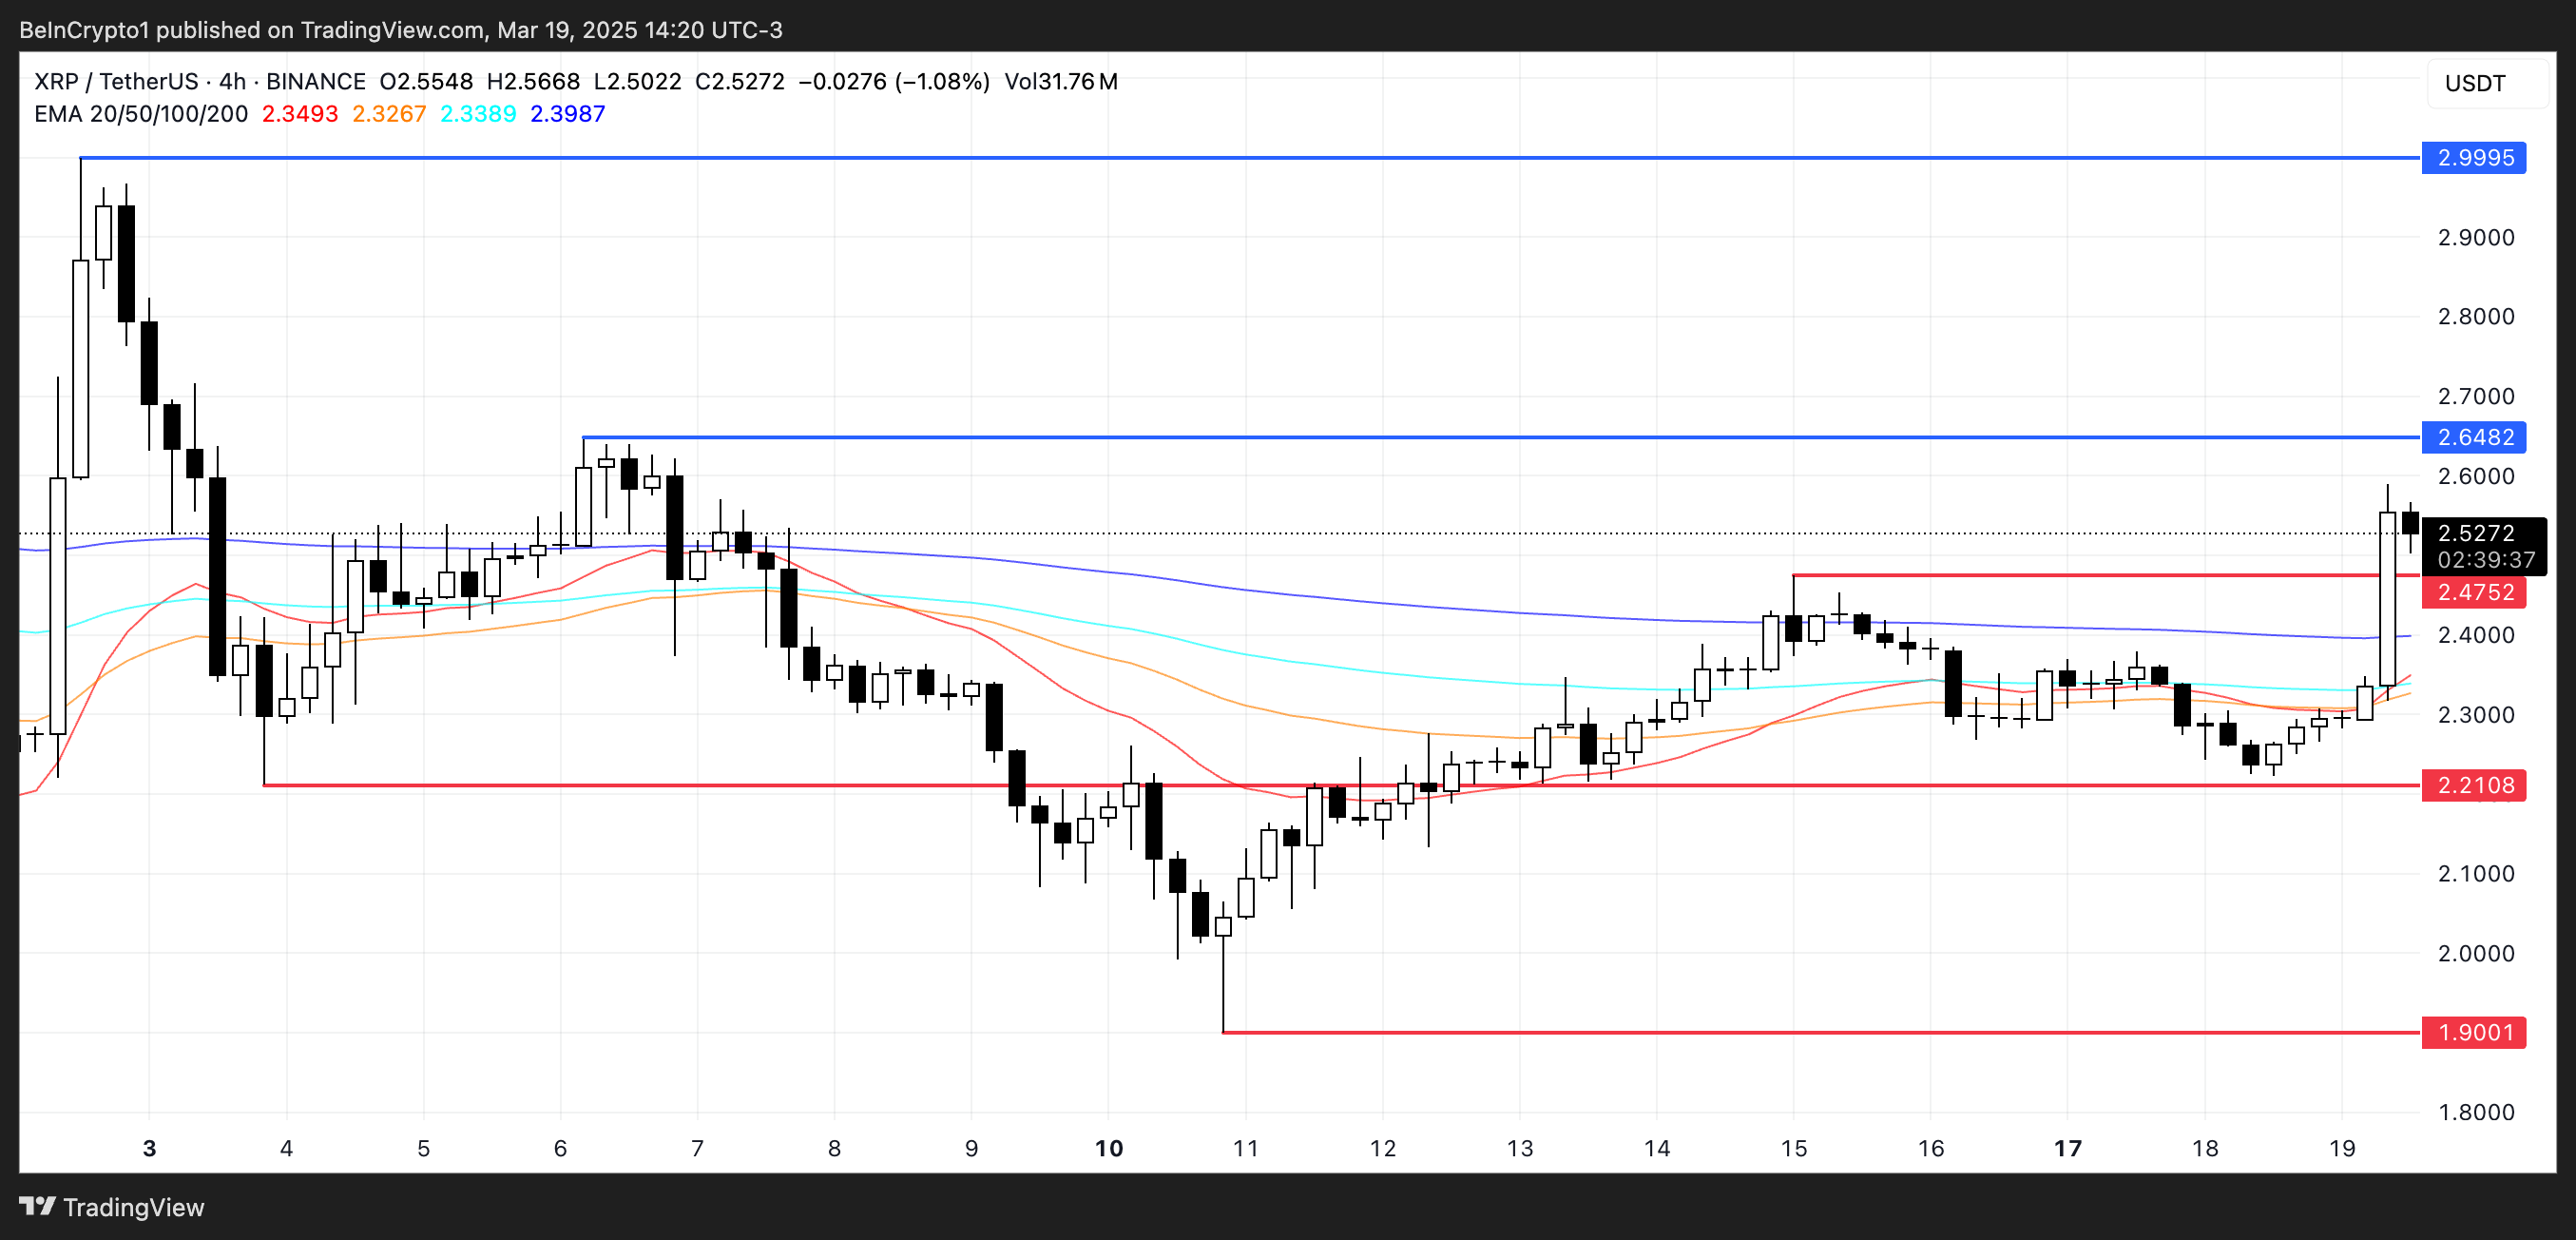
Conversely, a renewed downtrend could take shape if the bullish momentum fails to materialize and XRP’s price struggles to hold above its current range.

In this case, the key support level at $2.47 would become clear. A breakdown below this threshold could expose XRP to further downside risk, testing $2.21 and possibly driving it down to as low as $1.90.

The post Can XRP Reach a New All-Time High As the Ripple Lawsuit is Over? appeared first on BeInCrypto.

Pi Network Users Allege Bot Activity on CoinMarketCap Affecting Community Sentiment

Pi Network’s community sentiment poll on CoinMarketCap fell dramatically today, leading to allegations of bot activity. Negative votes swarmed the site’s poll, while other community ratings stayed positive.

However, there is no clear proof either for or against these claims. Pi Network has suffered criticism and price setbacks recently, and its supporters have swayed polls, votes, and ratings on multiple occasions.

Did Bots Sabotage Pi Network’s Community Sentiment?

Since its launch on February 20, Pi Network has seen more than its share of controversies. Critics have attacked its accessibility, governance, transparency, and more, and multiple governments have called it a scam.

Today, however, Pi supporters raised concerns about bot activity on CoinMarketCap after the token’s community sentiment plummeted:

“It looks like somebody is using bots to vote against PI. I am 99% sure this is not an organic poll. Over 1.94 Million votes is even bigger than the BTC vote. 77% of the PI community is bullish on CoinGecko. Why is it so different on CoinMarketCap?” a Pioneer asked on social media.

Specifically, this user noted that Pi’s community sentiment plunged 90% in less than a day and that this poll had more participants than Bitcoin’s.

Other platforms with a similar voting mechanism kept Pi’s rating steady, leading him to conclude that bot activity was involved.

Pi Community Sentiment Plummets
Pi Community Sentiment Plummets. Source: Moon Jeff

It’s very difficult to assess the veracity of these Pi Network bot allegations for several reasons. First of all, the token’s price has suffered dramatically this week.

Many users lost huge sums of Pi tokens after the KYC migration deadline, and massive investor sell-offs have triggered a price rout. Some of this negative sentiment may be genuine.

Additionally, it’s interesting that CoinMarketCap is the only platform involved in the Pi Network bot voting allegations. The firm refused to acknowledge Pi as one of the largest tokens by market cap, but it eventually relented.

Either the platform or its community could bear resentment towards Pi after these setbacks.

Furthermore, the community does have a reputation for vote brigading. Bybit’s CEO has repeatedly criticized Pi, and the token’s supporters review-bombed the Bybit app in response. They did a similar practice with Binance after the exchange delayed a Pi listing.

Ultimately, it seems very unlikely that disgruntled Pi supporters or committed haters spiked this poll without any bot activity. The negative votes came in absurdly fast, were isolated to one platform, and exceeded the votes for even the largest cryptoassets.

As of now, it remains challenging to find definitive proof either way.

The post Pi Network Users Allege Bot Activity on CoinMarketCap Affecting Community Sentiment appeared first on BeInCrypto.

Notcoin (NOT) Launches Not Games Amidst a Sharp Decline in TON Users

Open Builders, the team behind Notcoin, Lost Dogs, and Not Pixel, has announced the launch of Not Games in March. The project aims to revitalize the Notcoin (NOT) ecosystem by introducing games where players can earn tokens for free.

Open Builders revealed this plan at a time when interest in Telegram-based mini-games has dropped significantly, and TON’s user base has fallen to its lowest level in a year.

Notcoin (NOT) Seeks to Renew User Interest Through Not Games

In a press release shared with BeInCrypto, Open Builders clarified that Not Games is not a standalone game on Telegram. Instead, it is an interconnected gaming ecosystem that links multiple titles.

Within this ecosystem, Open Builders will introduce Game Profiles, shared inventories, and an in-game marketplace where players can trade with each other. This system gives the NOT token a broader use case, and it’s expected to transform the token from a simple tap-to-earn reward into a valuable asset within the gaming economy.

“Instead of fragmented tokenomics, Not Games will integrate NOT as the primary currency for purchases, upgrades, and rewards across all games. Every three weeks, the most skilled players will compete for rewards in NOT, ensuring a play-to-win experience, rather than a pay-to-win model.” – the Notcoin team told BeInCrypto.

Currently, Open Builders has already launched a game called VOID and confirmed that at least five more games are in development.

Tap-to-Earn and TON’s Shrinking User Base

Notcoin (NOT) gained massive popularity in 2024, driven by the tap-to-earn trend alongside projects like Hamster Kombat (HMSTR) and Yescoin, TapSwap, and Blum. Within the first six months of 2024, Notcoin attracted 35 million players.

However, Google Trends data indicates that interest in Notcoin has sharply declined and has nearly faded by 2025.

Notcoin Performance on Google Trends. Source: Google Trend.

Additionally, Tgstat data reveals that the Notcoin Community’s Telegram membership has dropped by nearly 2 million since the beginning of the year.

Even after NOT’s listing on Kraken in mid-February, its price only surged briefly on the listing day before continuing its downward trend, hitting new lows in 2025. This suggests that investor interest in NOT has faded.

TON Daily Active Address. Source: Artemis.

Moreover, Artemis data shows that daily active addresses on The Open Network (TON) have dropped from 2.4 million in October 2024 to just 130,000 at the time of writing.

The declining TON user base poses a major challenge for Notcoin (NOT) and its efforts to build a sustainable ecosystem.

The post Notcoin (NOT) Launches Not Games Amidst a Sharp Decline in TON Users appeared first on BeInCrypto.

Hyperliquid (HYPE) Surges 15% as Indicators Signal Further Gains

Hyperliquid (HYPE) is showing strong technical signals across multiple indicators, with the token surging more than 15% in the last 24 hours. The platform continues to demonstrate impressive market performance, generating $47 million in fees over the past 30 days and outperforming major blockchain networks like Ethereum and Solana.

Technical indicators suggest a potential golden cross formation, meaning HYPE could test $21 or even $25.80 in the coming period.

Hyperliquid Revenue Places It Among Top Protocols In Crypto

Hyperliquid is currently one of the most successful protocols in crypto. Over the past 30 days, it has generated an impressive $47 million in fees and recently reached $1 trillion in perps volume.

While this places it behind major players such as Jito, Pumpfun, and PancakeSwap in terms of monthly revenue, Hyperliquid has surpassed significant blockchain apps and chains, including Solana, Ethereum, Raydium, and Phantom.

Selected Protocols and Chains Revenue. Last 24 hours, Last 7 Days, and Last 30 Days.
Selected Protocols and Chains Revenue. Last 24 hours, Last 7 Days, and Last 30 Days. Source: DefiLlama.

What makes Hyperliquid’s success particularly remarkable is that, unlike most other high-performing protocols that operate on established blockchain networks such as BNB, Solana, or Ethereum, Hyperliquid functions as its own independent chain.

With the exception of Tron, virtually all other major protocols rely on parent blockchains, whereas Hyperliquid has achieved its substantial revenue figures as a standalone entity.

Despite this impressive performance and unique positioning, HYPE has experienced considerable downward price pressure recently, trading below the $20 threshold for sixteen consecutive days, creating a notable disconnect between the protocol’s operational success and its market valuation.

HYPE DMI Shows Buyers Are In Control

The HYPE DMI (Directional Movement Index) chart shows promising momentum shifts, with the ADX (Average Directional Index) rising from 15.7 to 19, suggesting a strengthening trend conviction.

More significantly, the +DI (Positive Directional Indicator) has surged from 18 to 29.1, while the -DI (Negative Directional Indicator) has declined from 21.8 to 13.5. This crossover pattern, where +DI rises above -DI, typically signals a potential bullish reversal.

The increasing spread between these indicators and the rising ADX suggests that buying pressure is overcoming selling pressure, potentially setting the stage for HYPE to break above its recent sub-$20 trading range.

HYPE DMI.
HYPE DMI. Source: TradingView.

The Relative Strength Index (RSI) is a momentum oscillator that measures the speed and change of price movements. Readings above 70 are typically considered overbought, and below 30 are considered oversold.

HYPE’s RSI climbing from 54.5 to 66 indicates growing bullish momentum that hasn’t yet reached extreme levels. This uptick suggests strengthening buyer interest while remaining below the overbought threshold of 70.

HYPE RSI.
HYPE RSI. Source: TradingView.

The fact that HYPE hasn’t reached overbought levels since December 2024 implies there may still be room for price appreciation before any potential pullback.

Together with the DMI indicators, this RSI reading reinforces the possibility of continued upward movement in HYPE’s price in the near term.

Will Hyperliquid Rise Above $20 This Week?

The HYPE Exponential Moving Average (EMA) lines are converging toward a potential golden cross formation, which occurs when a shorter-term moving average crosses above a longer-term one.

This technical pattern typically signals a strong bullish momentum shift that could propel HYPE to test its immediate resistance level at $17. Should buyers successfully break through this threshold, the path would open for HYPE to climb toward the $21 mark.

In scenarios where exceptional buying pressure materializes, Hyperliquid could extend its gains to challenge the significant resistance level at $25.80, representing a substantial recovery from its recent sub-$20 trading range.

HYPE Price Analysis.
HYPE Price Analysis. Source: TradingView.

Conversely, if the anticipated uptrend fails to materialize and bearish sentiment prevails, HYPE could experience renewed downward pressure, forcing it to test the critical support level at $12.43.

The importance of this support cannot be overstated, as a breach below this floor could trigger accelerated selling, potentially pushing HYPE under the psychologically significant $12 level for the first time since December 2024.

The post Hyperliquid (HYPE) Surges 15% as Indicators Signal Further Gains appeared first on BeInCrypto.

Top 3 BNB Meme Coins To Watch For the Last Week of March

BNB meme coins are gaining traction as the BNB ecosystem experiences a surge. PancakeSwap has been leading DEX volumes globally over the past seven days, surpassing both Raydium and Uniswap.

Among the top contenders making waves are Mubarak, Palu, and FairMint, each capturing significant attention in this fast-moving space. Mubarak is leading the pack with explosive early growth, while Palu is emerging as a potential flagship meme coin. Meanwhile, FairMint is positioning itself as a unique launchpad, aiming to become BNB’s version of Pumpfun.

Mubarak

Mubarak has quickly become one of the most talked-about meme coins in the BNB ecosystem over the past few days. Yesterday, its market cap briefly approached the $200 million mark before pulling back to around $112 million today.

The project surged onto the scene with remarkable traction, fueled by growing hype and speculative interest in BNB-based assets.

mubarak Market Info.
mubarak Market Info. Source: Dexscreener.

In just a short period, Mubarak has gained over 20,000 holders, recorded daily volumes of $66 million, and witnessed nearly 35,000 transactions per day. However, despite this initial momentum, the token is now undergoing a sharp correction, down 25% in the past 24 hours.

Even so, with the BNB ecosystem continuing to attract fresh capital and broader market attention, there is still potential for Mubarak to rebound and possibly retest its previous highs near the $200 million market cap level if buying interest returns.

Binance’s Palu (Palu)

As BNB meme coins continue to dominate the spotlight, several projects are competing to become the face of the ecosystem, much like Shiba Inu did with Ethereum and Bonk with Solana.

One of the contenders is Palu, a relatively new token launched just under six days ago. Palu has already attracted nearly 5,000 holders and reached a market cap of $864,000, slightly down from its recent high of almost $900,000.

The project is positioning itself to potentially fill the role of a flagship meme coin within the BNB chain.

Palu Market Info.
Palu Market Info. Source: Dexscreener.

Despite suffering a sharp 75% correction over the past 24 hours – a scenario not uncommon among meme coins across various blockchains – Palu is still maintaining solid activity, with daily trading volumes near $4 million.

If sentiment in the BNB meme coins sector stabilizes and Palu regains its momentum, the project could attempt to climb back toward key psychological milestones, with market cap targets of around $1 million and possibly even $2 million in the near term.

FairMint FAIR (FAIR)

FairMint is a newly launched BNB meme coins launchpad that has been live for less than three days.

Trying to differentiate itself from other platforms such as Pumpfun, FairMint introduces distinctive mechanics.

For example, it enables all users to mint tokens at the same price while also ensuring that 95% of tokens maintain liquidity at the mint price via single-sided liquidity provisioning.

FAIR Market Info.
FAIR Market Info. Source: Dexscreener.

Currently, FairMint has gathered close to 3,500 holders, boasts a daily trading volume of $11.7 million, and records over 24,000 transactions per day.

While Pumpfun has established itself as the leading launchpad on Solana, the BNB chain still lacks a dominant player in this niche.

If FairMint can sustain its strong early momentum and community engagement, FairMint could be poised to push toward market cap milestones of $5 million and potentially even $10 million in the coming days.

The post Top 3 BNB Meme Coins To Watch For the Last Week of March appeared first on BeInCrypto.

Jerome Powell Speech: Fed Chair Break Silence on Inflation, Tariff War

Jerome Powell Speech: Fed Chair Break Silence on Inflation, Tariff War

Fed Chairman Jerome Powell gave his first speech after the Federal Open Market Committee (FOMC) decided to keep interest rates unchanged. Considering the current economic outlook, the Fed Chair noted that its policies are strong for now. Powell noted that the Fed will continue to watch inflation gauges for changes as part of its measures to maintain economic stability and stem inflation.

Jerome Powell Speech: Quantitative Easing Begins

As reported earlier by CoinGape, the Fed maintained interest rates at 4.5%. Powell stated in his speech that the inflation outlook is transitory with the Donald Trump-induced tariff in North America. 

Speaking on the inflationary trend, the Fed Chair referenced measures from the Bank of Canada to prevent the bloated surge in the price of goods owing to the tariff war. He said the US measures to tighten or loosen gauges to prevent inflation challenge the FOMC. However, he noted that the United States is not at the level where it will be concerned about the longer-term impact of the trade war.

Ahead of the March FOMC Meeting, the forecast to keep interest rates unchanged was resounding. However, speculations trailed the broader Quantitative Easing (QE) outlook. In line with this, the Federal Reserve Chairman has provided definitive guidance.

“The Committee will slow the pace of decline of its securities holdings by reducing the monthly redemption cap on Treasury securities from $25 billion to $5 billion,” outlining its measures to begin QE.

Jerome Powell said this year that the Fed will adapt based on the market outlook.

Tariff War and Economic Expectation

While the Trump administration has masked the market with tariff concerns, Jerome Powell said in his speech that this trend is partly to blame for the current inflation level.

However, he hinted that the tariff war does not influence all economic activity. He cited the service sector as insulated from this trade war. When asked about his take on Americans who are displeased with the inflation outlook, the Fed Chair said this displeasure is understandable since they are at the price level.

As part of the speech, the Chairman hinted at a possible 2-time interest rate cuts before the end of this year.

Market Reaction to Fed Chair Speech

The market’s volatility recently flipped bullish, drawing on broader economic indices. While keeping interest rates unchanged might help stabilize prices in the short term, lingering uncertainty remains a key headwind in the market.

As of writing, data from CoinMarketCap pegs the price of Bitcoin at $85,516.99, up by 4.30% in 24 hours. Altcoins like Ethereum, XRP, and Solana (SOL) also rallied by 7.61%, 11.85% and 7.11% within the same period.

Beyond the Fed Chair speech, the US SEC’s dismissal of the Ripple lawsuit created a short-term tailwind for the crypto market.

The post Jerome Powell Speech: Fed Chair Break Silence on Inflation, Tariff War appeared first on CoinGape.

Solana Labs Co-Founder Breaks Silence on Controversial Ad Amid Backlash

Solana Labs Co-Founder Breaks Silence on Controversial Ad Amid Backlash

Solana Labs co-founder Anatoly Yakovenko has addressed the controversy surrounding the blockchain network’s recently deleted ad. The advertisement, which aimed to promote the upcoming Solana Accelerate conference, faced harsh criticism for its portrayal of gender issues.

The ad, now taken down, sparked backlash from the community, especially for its tone-deaf approach to gender identity. The Solana team has since been forced to manage the aftermath, with investors and users questioning the impact on the project’s public image.

Solana Labs Co-Founder Responds to Backlash

Solana Labs co-founder Anatoly Yakovenko has responded to the backlash in a post on X. He said he was sorry for the lack of sensitivity that was used in the advert and for not considering how such a piece can hurt minority groups. “The ad was bad, and it’s still gnawing at my soul,” Yakovenko said, following the mistake which had been made. He also confessed that at first, he had minimized the situation and did not speak out about it as it deserved to be.

Yakovenko went on to also express gratitude to the developers and artists in the Solana ecosystem who openly seceded the ad; some did it publicly while others privately. He effectively also appericated their collaboration in pointing out such content.

Nonetheless, Yakovenko sought to cool down the tensions, stating that Solana Labs would keep true to its objectives: decentralization and open-source software. He noted that the Solana Foundation would not interfere with culture wars and would stick to the principles on which Solana was established.

Marketing Missteps and Community Reaction

This ad was widely regarded as provocative as it presented a character called “America” speaking about ideas of invention during a therapy session. Instead of giving him theories about technological development, the therapist advised him to stick to matters like gender and pronoun.

In the end, the ad concluded with the character stating that he was going to ‘invent technologies not genders. The depiction was also considered by many as being sexist and an awkward response to the present culture and political correctness.

The response was immediate, with many people in the crypto-sphere expressing their disgust on social networks. Some of the critics felt that the ad was vulgar and insensitive towards some of the vices in the society towards Solana. Subsequently, the company removed the video, however, by that time the video had received millions of viewers and thousands of comments. Some questioned the Solana marketing team for not thinking past such a message, especially during the current political climate of gender issues.

Solana Price Trends Amid the Controversy

Following the controversy, many investors have been closely monitoring the impact on Solana’s market performance. While Solana remains one of the largest blockchain networks, the incident has raised concerns over potential consequences for SOL’s price. As of March 19, Glassnode’s URPD (Unrealized Realized Price Distribution) chart suggests key support and resistance levels that could be affected by this negative publicity.

Image

The first strong support level is $112.10 according to Glassnode where 9.7 million SOL (approximately 1.67% of the total) is stored. This level proves important, in the light of the fact long-term investors might be willing to support the stock after acquiring stakes hence this presents a cost base. On this context, the $94, $97, and $100 levels support around 21 million SOL which is 3.5% of the total supply and breakdown of any of these levels may lead to bearish pressure.

On the upside, there is resistance around $135, where 26.6 million SOL is concentrated, and particularly at $144, where 27 million SOL (nearly 5% of supply) is held. These levels could provide significant selling pressure, as many investors who bought at or near these levels may look to exit at break-even, adding additional selling pressure on the price.

The post Solana Labs Co-Founder Breaks Silence on Controversial Ad Amid Backlash appeared first on CoinGape.

Ethereum Price Flashing More Breakout Signals after US Fed Decision and Ripple’s SEC Win Sparks $300M Liquidations

ethereum

Ethereum price surged by 5% on Wednesday, reaching $2,050 for the first time in ten days. With mutiple news catalysts alligning with massive short liquidations, how high can ETH prices go?

Ethereum (ETH) retakes $2,000 after 10-days amid Fed rate pause and SEC news on Ripple

Ethereum’s price surged by 5% on Wednesday, reaching $2,050 for the first time in ten days. This uptick coincided with the U.S. Federal Reserve’s recent policy decision and the conclusion of Ripple’s legal battle with the Securities and Exchange Commission (SEC), events that have significantly impacted the cryptocurrency market.

The Federal Reserve announced a pause in interest rate hikes, maintaining the current rates amid stable economic indicators. This decision has been perceived positively by investors, leading to increased confidence in riskier assets, including cryptocurrencies like Ethereum.

Ethereum Price Action | CoinMarketCap 
Ethereum Price Action | CoinMarketCap

In a parallel development, Ripple’s CEO, Brad Garlinghouse, confirmed that the SEC has dropped its case against the company. The lawsuit, initiated in December 2020, alleged that Ripple’s XRP token was an unregistered security. The dismissal of this case has been viewed as a significant win for the broader cryptocurrency industry, alleviating regulatory uncertainties that have previously hindered market growth.

More Bullish Signals Appear as ETH Short Traders Emerge Biggest Losers

Aside from the latest Federal Reserve decision and Ripple’s SEC victory boosting altcoin market demand, Ethereum has formed internal bullish catalysts. Over the past week, the Ethereum network successfully implemented two key upgrades: the Pectra Upgrade and the Hoodi Update.

These technical improvements have strengthened investor confidence, helping ETH surpass the $2,000 resistance level on Wednesday.

Crypto market liquidation heatmap, March 19, 2025 | Source: Coinglass

According Coinglass’ latest derivatives crytpocurrency market data suggest further upside potential.

According to the liquidation heatmap, Ethereum saw $86.58 million in total liquidations over the past 24 hours, with short traders suffering the most at $72.62 million. This accounted for a significant 25% of total market-wide liquidations, indicating a short squeeze that fueled ETH’s breakout.

With ETH short traders emerging as the biggest losers, it signals that short sellers are closing their positions at a rapid pace. This has two key implications. First, it suggests that bears are conceding the $2,000 resistance level, reducing downward pressure on ETH.

Second, as ETH advances above $2,050 and stabilizes at $2,067 at press time, many traders who previously placed short positions around key resistance levels have exited. With weaker resistance ahead, ETH could rise rapidly if positive macro sentiment surrounding the Fed’s rate pause persists.

Ethereum Price Forecast: Bulls Need $2,100 Breakout to Confirm Next Move

ETH price surged past $2,036, gaining 5.43% as bullish momentum accelerated following positive  macroeconomic swings and successful network updates. Ethereum price forecast indicators on the daily chart reveals that ETH is trading above the 20-day moving average, signaling a potential short-term bullish reversal. The recent price action also aligns with the VWAP level of $2,009, further validating the strength of this rebound. A decisive close above $2,100 could open the door for a continuation toward the next resistance level at $2,373, as indicated by the upper Keltner Channel boundary.

Ethereum Price Forecast

However, despite the bullish momentum, Ethereum remains under a looming “death cross” overhang, where the 50-day moving average trends below the 200-day moving average, signaling a long-term bearish risk. Additionally, while short-term resistance may have weakened due to the massive $72 million in ETH short liquidations recorded Wednesday, the broader trend remains uncertain. If ETH fails to break and hold above $2,100, a rejection could trigger a retest of lower support around $1,927, potentially extending losses toward $1,801.

For now, bulls need to establish control above $2,100 to confirm sustained upside potential. A breakout beyond this level could drive ETH into a new uptrend, while failure may see renewed selling pressure in the coming days.

The post Ethereum Price Flashing More Breakout Signals after US Fed Decision and Ripple’s SEC Win Sparks $300M Liquidations appeared first on CoinGape.

Solana Price Soars 10% Ahead of First SOL ETF Launch Tomorrow

Solana Price Soars 10% Ahead of First SOL ETF Launch Tomorrow

Solana price has climbed 10% in the last 24 hours as market sentiment turns positive. The surge follows a broader crypto market rebound and a bullish Federal Reserve policy update. Traders are now eyeing further gains as the first Solana ETF prepares to launch tomorrow, potentially driving additional momentum for the asset.

Solana Price Rises 10% Awaiting Tomorrow’s SOL ETF U.S. Launch

Solana price increased 10% as traders anticipate the first-ever Solana futures ETFs launching in the U.S. on Thursday. Volatility Shares will introduce these ETFs on Nasdaq, allowing more institutional participation in the Solana market.  

This development has fueled strong buying activity, signaling optimism among traders ahead of the launch. The ETFs will track Solana futures, marking a significant step for crypto investment products in the U.S. market.  

With heightened interest, analysts speculate on whether this launch could drive a bullish trend for Solana. Investors remain watchful as the market prepares for a new phase in Solana trading.

Will the Bullish Momentum Continue for Solana Price?

The latest Solana price has surged over the past 24 hours, showing notable upward momentum. 

The SOL price is currently hovering around $133, reflecting a 10% increase following the crypto market recovery. The BTC price is trading above $85k, while ETH hovers above $2k, fueling the surge. 

The top altcoin has been trending upwards in a clear channel, aiming for key resistance near the $140 mark.

Technical indicators confirm this positive momentum. The Moving Average Convergence Divergence (MACD) shows bullish signals, with the MACD line at 0.98, surpassing the signal line of 0.48. 

This suggests strong buying interest. Moreover, the Chaikin Money Flow (CMF) stands at 0.21, indicating a positive capital flow into SOL.

The first target for Solana price prediction would be around $140, which aligns with the recent resistance level. A successful breakout above this level could see the price rise towards $150, a significant psychological resistance zone. If the bullish trend continues, the next target could be $160. 

If the price faces significant downward pressure and breaks below $130, the next support level to monitor is around $120.

Solana Price Soars 10% Ahead of First SOL ETF Launch Tomorrow
Solana Price Chart: TradingView

Final thoughts, the recent Solana price surge, combined with the anticipation of the first ever ETF launch, suggests a bullish outlook. Traders remain optimistic as they watch for continued momentum. The coming days will reveal whether the rally can maintain its strength and push Solana to new highs.

The post Solana Price Soars 10% Ahead of First SOL ETF Launch Tomorrow appeared first on CoinGape.

Analyst Reveal When Dogecoin Price Could Hit $1 Based on This Pattern

Analyst Reveal When Dogecoin Price Could Hit $1 Based on This Pattern

Dogecoin price may be on the verge of another price rally, according to a market analysis comparing its current trend to the 2017 cycle. A detailed chart analysis suggests a similarity between DOGE price movements in 2017 and its trajectory in 2024.

The data shows that in 2017, the meme coin experienced a surge followed by a consolidation period lasting 115 days before another upward movement. The present cycle has now extended to 119 days, indicating a potential repeat of past trends. If the pattern holds, analysts predict DOGE price could reach the $1 mark by June 2024.

Analyst Predicts Dogecoin Price Could Hit $1 by June

Analyst Master Kenobi took to the X platform, formerly known as Twitter, to highlight a potential repetition of Dogecoin’s historical price cycle. According to his analysis, Dogecoin had a 115-day consolidation period between major price surges in 2017. The current market structure shows a similar pause, now lasting 119 days. This resemblance to past movements suggests that Dogecoin price could be approaching another breakout phase.

The analysis also points to technical indicators supporting this prediction. The Relative Strength Index (RSI) displayed a sharp increase during the initial rally in both cases, followed by a downward correction during the consolidation phase.

Once RSI stabilized in 2017, the price experienced another surge. A similar pattern appears to be forming in 2024, reinforcing the expectation of a possible upward movement.

DOGE price
Source: X

Historical price cycles further strengthen the argument for a potential rally. The 2017 surge followed a prolonged accumulation phase, which appears to be repeating in the current cycle. If the top meme coin follows the same trend, analysts believe the meme coin rally could push DOGE toward the $1 mark in the coming months.

Technical Indicators Suggest a Meme Coin Rally

The analysis of Dogecoin price trends incorporates several technical indicators that align with the 2017 price cycle. Moving averages, RSI, and price action suggest that the current consolidation phase may be setting up for another strong rally. 

More so, the Moving Average Convergence Divergence (MACD) indicator is signaling a potential bullish crossover as the blue MACD line is rising and appears to be crossing above the orange signal line. This crossover is a classic technical indicator of increasing bullish momentum, often interpreted as a buy signal by traders. 

Additionally, the histogram bars have transitioned to blue, reinforcing the likelihood of an upward trend. As the histogram expands positively, it suggests growing buying pressure, which could push Dogecoin’s price higher in the coming sessions. This development indicates that momentum is shifting in favor of the bulls, potentially setting up a price recovery.

Dogecoin price
Source: TradingView

Furthermore, the Awesome Oscillator (AO) is reflecting a similar sentiment, as the histogram bars are beginning to lighten in color, transitioning from deep red towards green. This shift in momentum suggests that bearish pressure is weakening, and a potential reversal may be forming. If the AO continues to print green bars, it would confirm a bullish divergence, adding weight to the bullish case

At press time, the top meme coin is trading at $0.1743, reflecting a 5.34% surge in the past 24 hours. Additionally, the 24-hour trading volume has increased by 11.81%, reaching $1.16 billion, while its market cap stands at $25.89 billion, indicating strong bullish momentum.

The post Analyst Reveal When Dogecoin Price Could Hit $1 Based on This Pattern appeared first on CoinGape.