Pi Network Briefly Falls Below $1 As PI Shows Oversold Signals

Pi Network (PI) has recently experienced a significant price decline, exacerbated by Binance’s decision to exclude the token from its new vote-to-list campaign. This move has led to waning investor confidence, further driving down the price of Pi Network. 

As a result, investors have become increasingly hesitant, pulling their funds from the project. 

Pi Network Is Losing Investors’ Interest

The Chaikin Money Flow (CMF) for Pi Network is currently at its lowest point since the project’s inception. This indicates that the outflows from the altcoin have reached an all-time high, signaling a lack of conviction among investors.

The negative sentiment has caused many to pull their money out of Pi Network, further weighing down the asset’s value. 

This heightened outflow could have a lasting impact on the price, as it suggests that investor trust is faltering. As confidence in Pi Network continues to dwindle, more investors may decide to exit their positions, which could lead to even more downward pressure on the price.
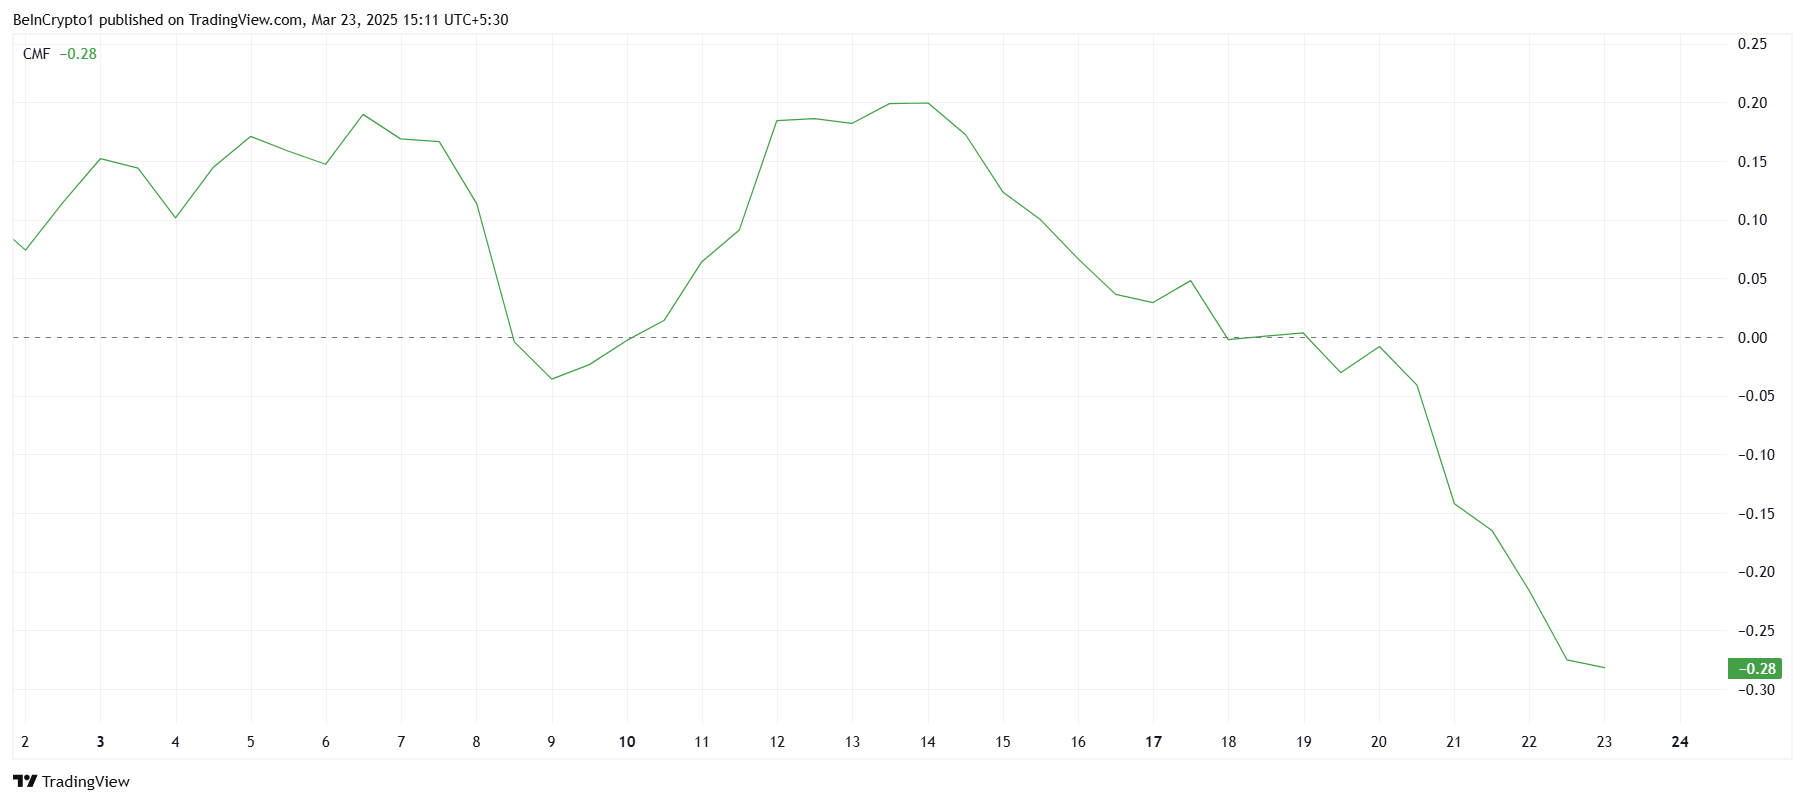
PI Network CMF
PI Network CMF. Source: TradingView

Pi Network’s macro momentum has also shown signs of shifting. The Relative Strength Index (RSI), which measures the strength of price movements, bounced back after hitting the oversold zone earlier this week. This is typically viewed as a sign of potential reversal, suggesting that the bearish momentum could ease. 

However, despite this slight improvement in the RSI, Pi Network has not yet seen any significant growth. This indicates that the broader market pressure is still very much present.
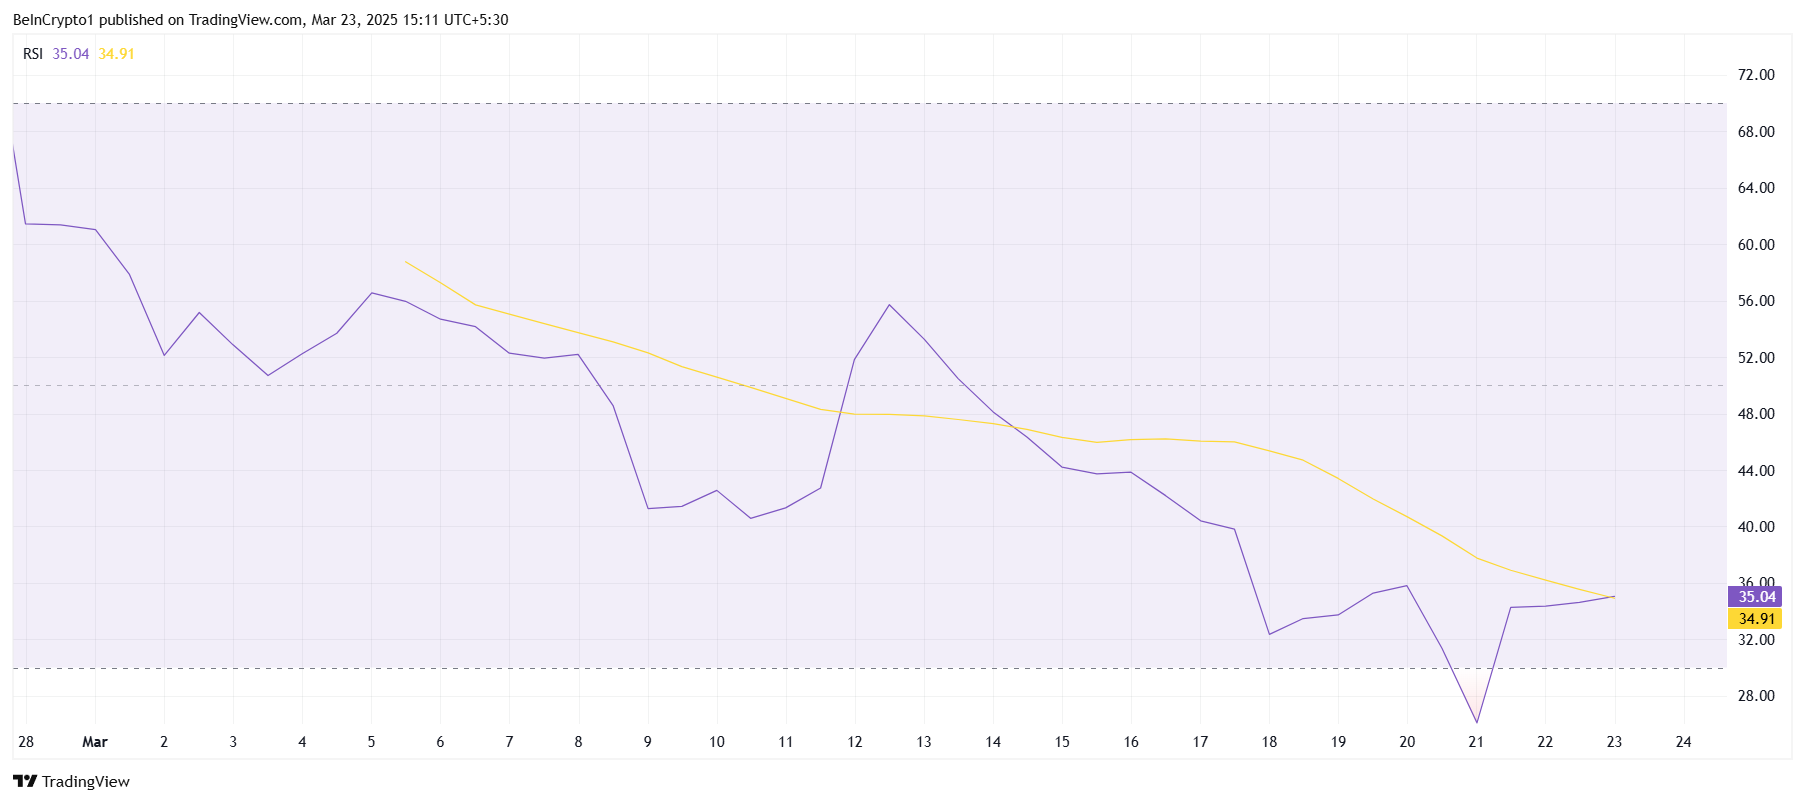
PI Network RSI
PI Network RSI. Source: TradingView

PI Price Is Sliding Lower

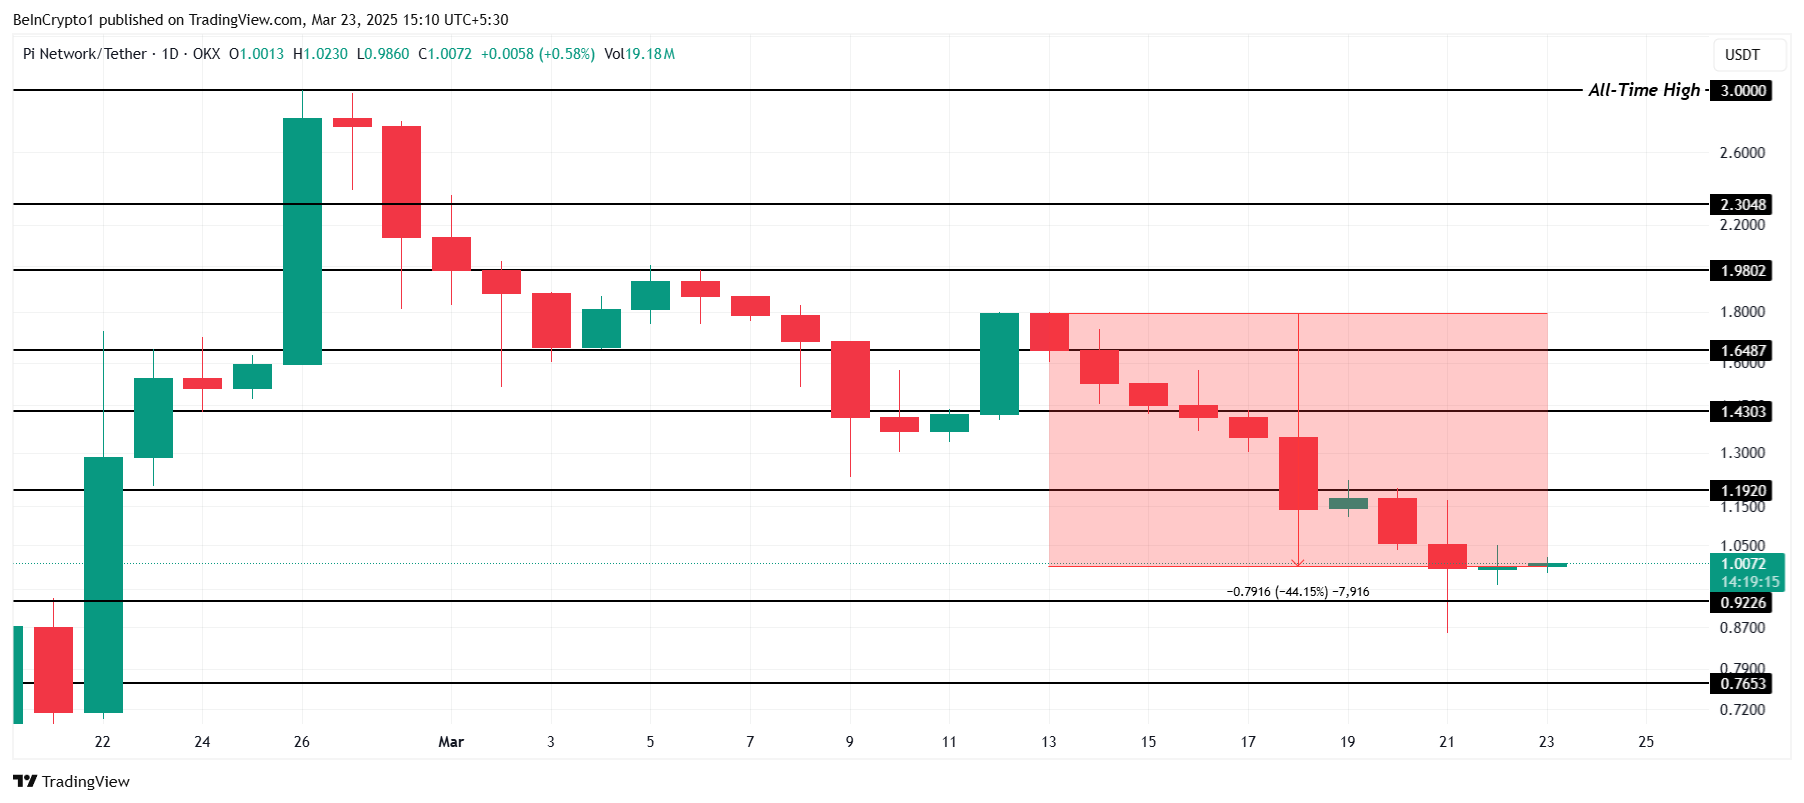
Currently, Pi Network is trading at $1.00, down by 44% over the last ten days. The altcoin is attempting to hold above this price point and has been relatively successful in doing so.

However, the ongoing outflows and broader market conditions suggest that Pi Network could struggle to maintain its current level.

If the selling pressure continues, Pi Network may fall toward the $0.92 support level. A breakdown below this level could lead to a further decline to $0.76, extending the recent losses. With this potential for continued downside, investors will need to watch these support levels closely.
PI Network Price Analysis.
PI Network Price Analysis. Source: TradingView

If Pi Network manages to reclaim $1.19 as support, it could pave the way for a potential recovery. A successful rise above this level could push the price back to $1.43, helping the token recover a portion of its recent losses.

The post Pi Network Briefly Falls Below $1 As PI Shows Oversold Signals appeared first on BeInCrypto.

Dormant Bitcoin Whale Wallet From 2016 Moves 3,000 BTC

An early Bitcoin investor has resurfaced after nearly a decade of inactivity, drawing attention across the crypto space.

On March 22, the Bitcoin whale transferred 3,000 BTC—worth over $250 million at the time of the move. A Bitcoin whale is an individual or entity that holds more than 1000 BTC.

Why is the Bitcoin Whale Active After 8 Years?

According to Arkham, the Bitcoin whale’s wallet dates back to late 2016, when Bitcoin was trading below $1,000.

The investor’s original stake—estimated at around $3 million—has since grown into a massive fortune, reflecting the asset’s long-term potential.

During this holding period, Bitcoin hit an all-time high of almost $110,000 in January 2025. Though the price has since pulled back to around $84,274, the whale’s ROI remains staggering.

Dormant Bitcoin Whale Shifts 3000 BTC.
Dormant Bitcoin Whale Shifts 3000 BTC. Source: Arkham Intelligence

The motive behind the transfer remains unclear. However, analysts noted that the funds were moved to another wallet—not an exchange—indicating the holder may be restructuring rather than preparing to sell.

This detail appears to have calmed fears of a market dump. BeInCrypto data shows that the broader crypto market has stayed stable despite the whale’s activity. Bitcoin and other top assets have shown little price volatility in response.

Meanwhile, this transfer is not an isolated case. Over the past year, several long-dormant wallets have shown signs of activity.

Some analysts believe early holders are reassessing their positions as Bitcoin trades near historic highs. Others suggest these investors may be preparing for more complex strategies involving futures or options.

Nevertheless, this case reinforces Bitcoin’s reputation as a long-term store of value. The whale’s decision to hold for nearly a decade shows how the asset has outperformed traditional stores of wealth like gold and the US dollar.

Moreover, the top crypto’s recent integration into traditional finance—bolstered by the launch of a spot Bitcoin ETF and plans for a US Strategic Bitcoin Reserve—only strengthens that narrative.

The post Dormant Bitcoin Whale Wallet From 2016 Moves 3,000 BTC appeared first on BeInCrypto.
Coinbase Avoids a Major Supply Chain Attack On Its Blockchain AI Toolkit

Coinbase, the largest crypto exchange in the US, has successfully evaded a supply chain attack that could have compromised its open-source infrastructure.

On March 23, Yu Jian, founder of blockchain security firm SlowMist, flagged the incident in a post on X, referencing a report from Unit 42, the threat intelligence division of Palo Alto Networks.

How Coinbase Stopped a Major Cyber Attack

According to Unit 42, the attacker targeted ‘agentkit’, an open-source toolkit managed by Coinbase that supports blockchain-based AI agents.

The threat actor forked agentkit and onchainkit repositories on GitHub, inserting malicious code intended to exploit the continuous integration pipeline. The suspicious activity was first detected on March 14, 2025.

“The payload was focused on exploiting the public CI/CD flow of one of their open source projects – agentkit, probably with the purpose of leveraging it for further compromises,” Unit 42 reported.

The attacker exploited GitHub’s “write-all” permissions, which allowed the injection of harmful code into the project’s automated workflow. This method could have enabled access to sensitive data and created a path for broader compromises.

A Malicious Commit Targeting Coinbase.
A Malicious Commit Targeting Coinbase. Source: Unit42

However, Unit 42 reported that the payload collected sensitive information. It did not contain advanced malicious tools like remote code execution or reverse shell exploits.

Meanwhile, Coinbase responded quickly, collaborating with security experts to isolate the threat and apply necessary mitigations. This rapid action helped the company avoid deeper infiltration and prevented potential damage to its infrastructure.

The stakes were high considering Coinbase’s standing as the largest crypto exchange in the US and a key custodian for spot Bitcoin ETFs.

A breach of this nature could have caused major disruption across the crypto industry, especially after Bybit’s recent $1.4 billion security incident.

Despite the failed attempt, the attacker has since shifted focus to a larger campaign now drawing global attention.

In light of this, SlowMist founder advised developers using GitHub Actions—especially those working with tj-actions or reviewdog—to audit their systems and confirm that no secrets have been exposed.

“If your company uses reviewdog or tj-actions, do a thorough self-examination,” Yu Jian stated on X.

This incident highlights the growing importance of securing open-source tools as the crypto ecosystem expands. Data from DeFillama shows that the crypto industry has recorded exploits of more than $1.5 billion this year.

The post Coinbase Avoids a Major Supply Chain Attack On Its Blockchain AI Toolkit appeared first on BeInCrypto.

Shiba Inu (SHIB) Price Trajectory Largely Depends on Bitcoin

Shiba Inu (SHIB) has been experiencing mixed signals in recent weeks. The meme coin has made attempts to secure a breakout, but this effort hinges heavily on investor support. 

Unfortunately, this support has been weak recently, forcing SHIB to rely on the broader market, particularly Bitcoin (BTC), for direction. If Bitcoin continues its upward trajectory, Shiba Inu may have a shot at a recovery rally.

Shiba Inu Needs Support

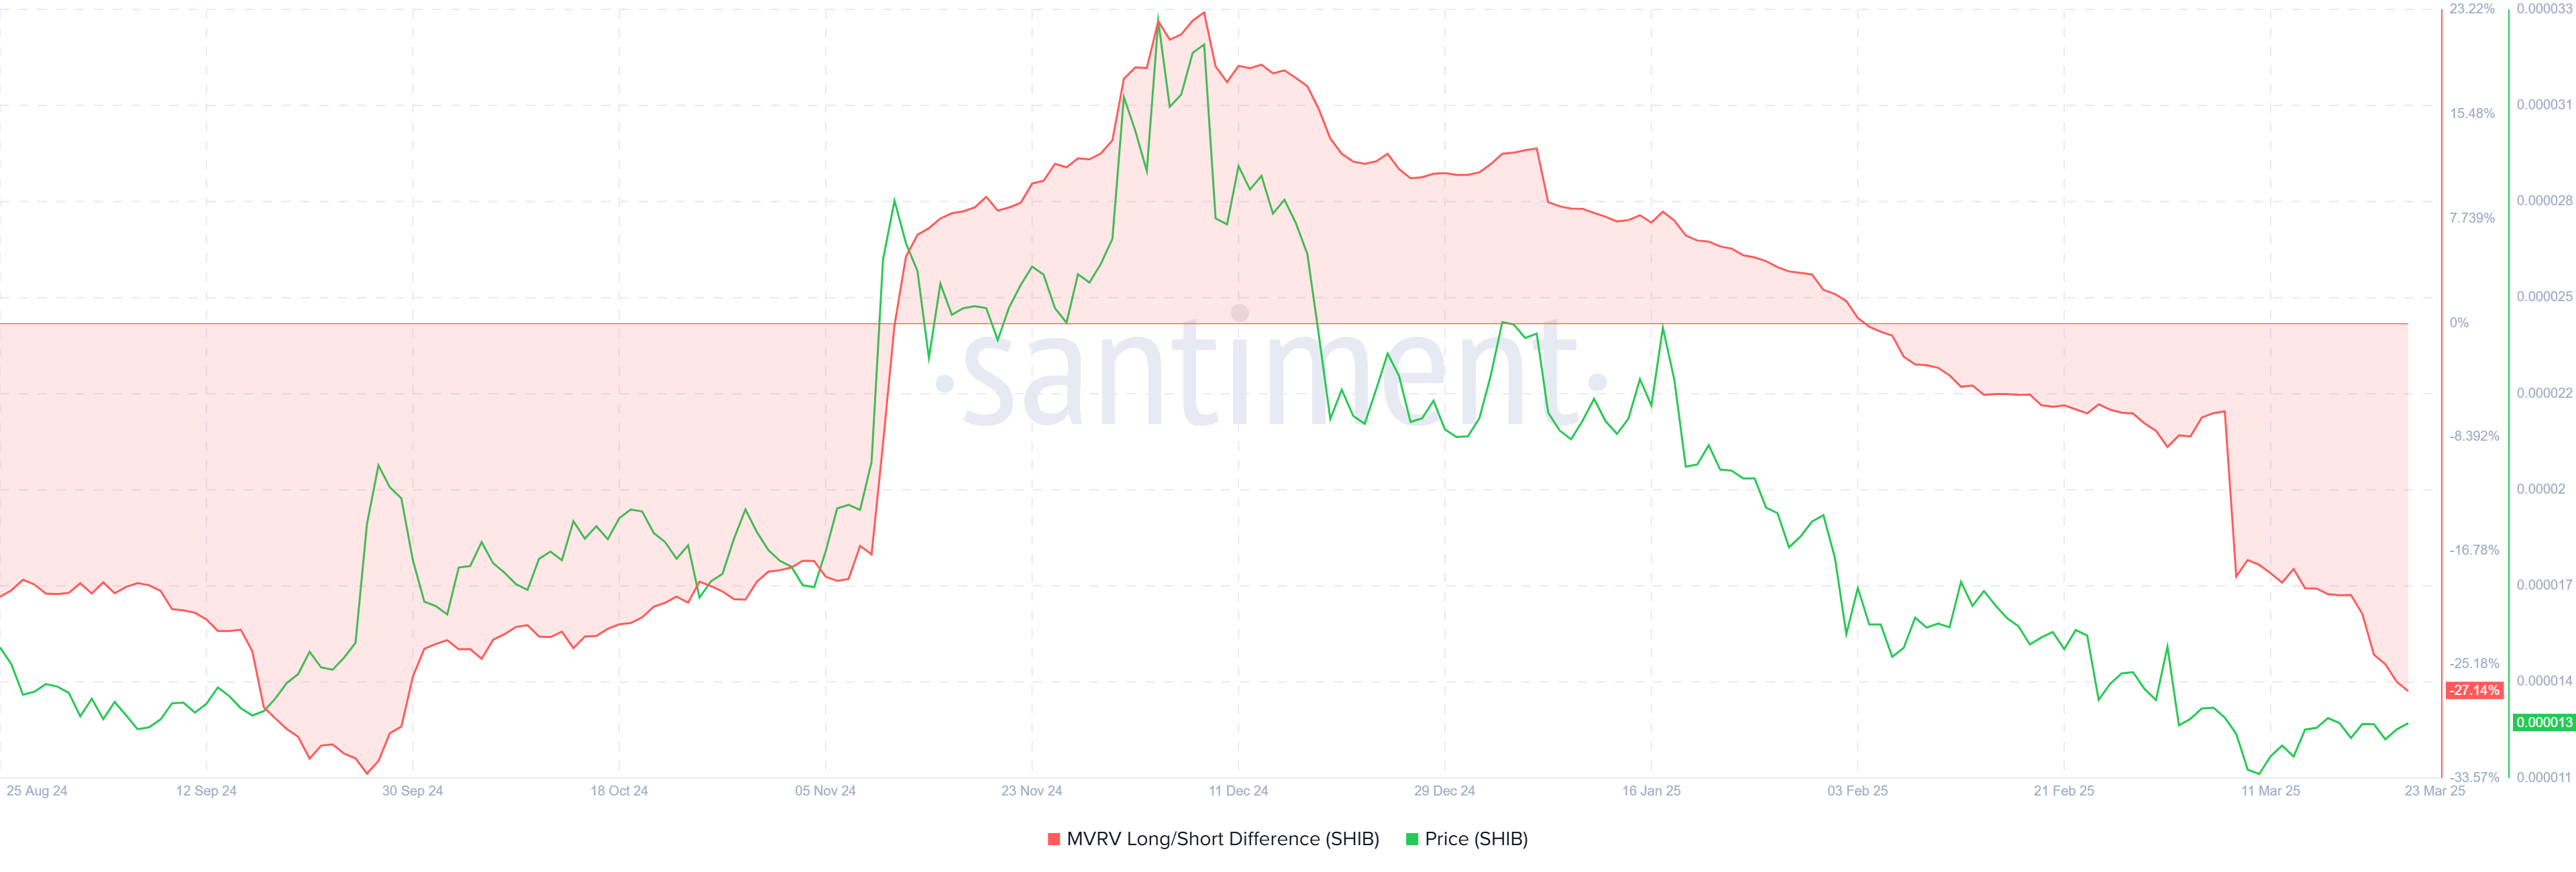
The MVRV Long/Short Difference for Shiba Inu is currently at a 6-month low, a key indicator suggesting that short-term holders are experiencing substantial profits.

This is a bearish sign for the cryptocurrency, as these investors are typically more inclined to sell when they are in profit. As a result, the potential for a sell-off is higher, and the price of Shiba Inu could take a hit as these holders exit their positions.

This behavior could put downward pressure on SHIB, limiting its chances of maintaining or building upon its recent gains. The lack of strong support from long-term holders, combined with the large profit-taking from short-term traders, creates an unstable market dynamic for Shiba Inu at present.

Shiba Inu MVRV Long/Short Difference
Shiba Inu MVRV Long/Short Difference. Source: Santiment

Shiba Inu’s correlation with Bitcoin remains strong, currently sitting at 0.77. This indicates that SHIB tends to move in tandem with Bitcoin, and as the largest cryptocurrency gradually recovers, Shiba Inu could follow suit.

Bitcoin’s potential rally toward the $90,000 mark would likely provide the necessary boost for SHIB to continue its own recovery.

If Bitcoin breaches the $90,000 level, it will instill further confidence in the broader cryptocurrency market. This, in turn, could help lift Shiba Inu from its current consolidation phase, giving it the momentum needed to push past key resistance levels.

Shiba Inu Correlation To Bitcoin.
Shiba Inu Correlation To Bitcoin. Source: IntoTheBlock

SHIB Price Is Aiming At Recovery

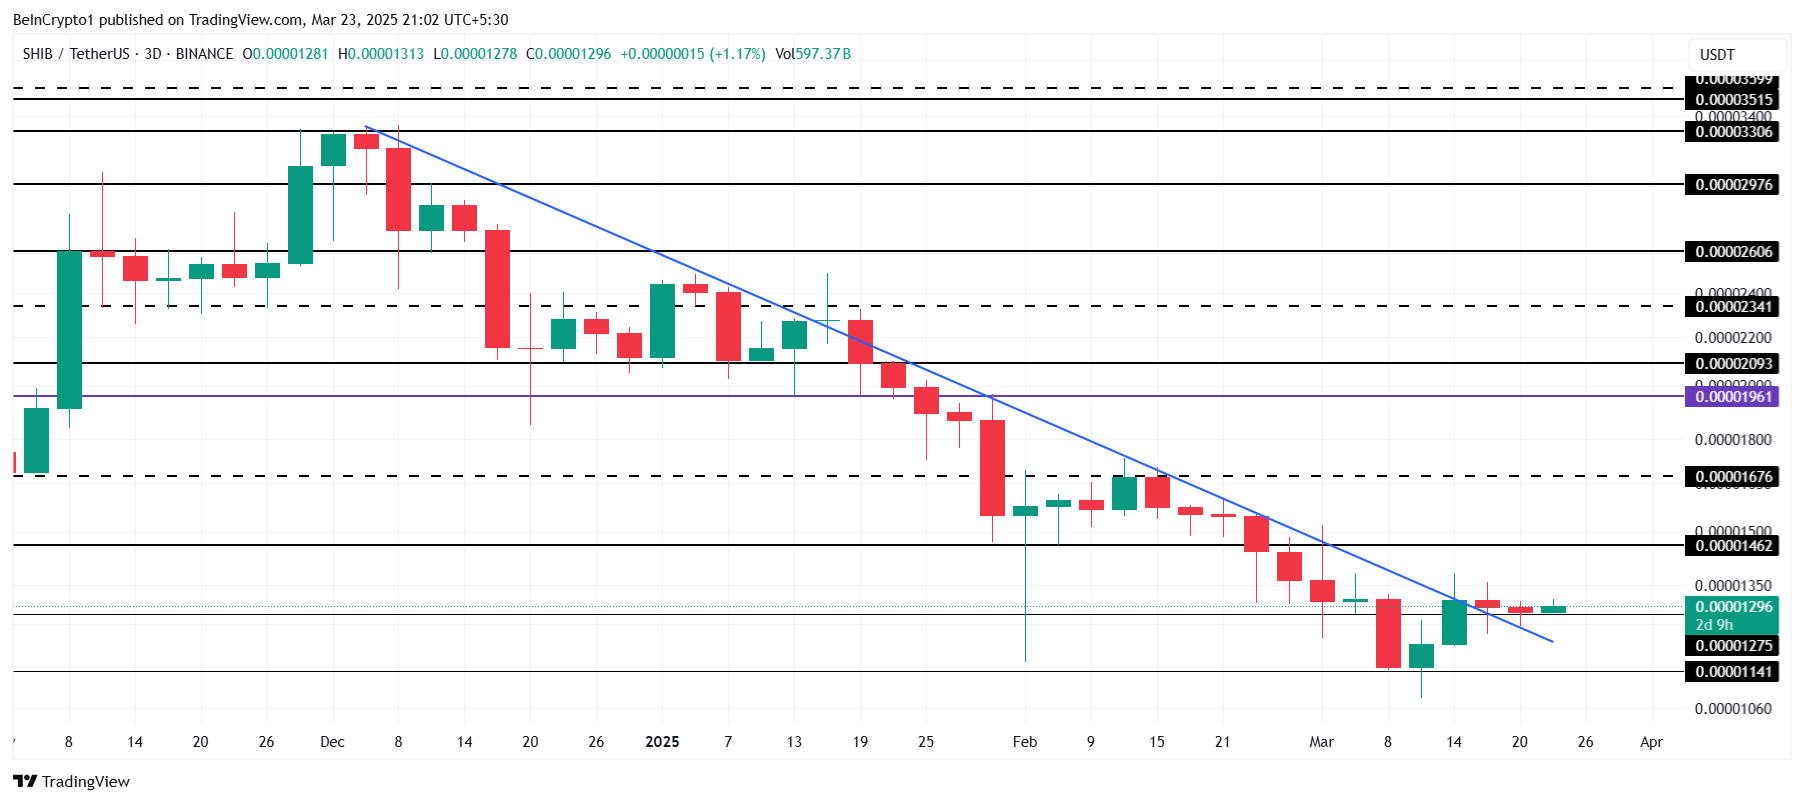
At the time of writing, Shiba Inu is trading at $0.00001296, just above its support level of $0.00001275. The altcoin is attempting to hold this support and bounce off it, but its ability to maintain this level depends on market conditions. 

Should Bitcoin rise further, Shiba Inu may find some support to reach or surpass the $0.00001462 barrier. However, if Bitcoin experiences a slip, SHIB will likely remain consolidated around $0.00001275 or potentially fall to $0.00001141, depending on the strength of the bearish pressure.

Shiba Inu Price Analysis.
Shiba Inu Price Analysis. Source: TradingView

The only way this bearish-neutral outlook would be invalidated is if Shiba Inu breaks through the $0.00001462 resistance and flips it into support.

A successful rally above this level could pave the way for SHIB to rise to $0.00001676 and beyond, marking the start of a more bullish trend for the meme coin.

The post Shiba Inu (SHIB) Price Trajectory Largely Depends on Bitcoin appeared first on BeInCrypto.
XRP New Investor Rate Falls to 4-Month Low, Price Recovery Challenged

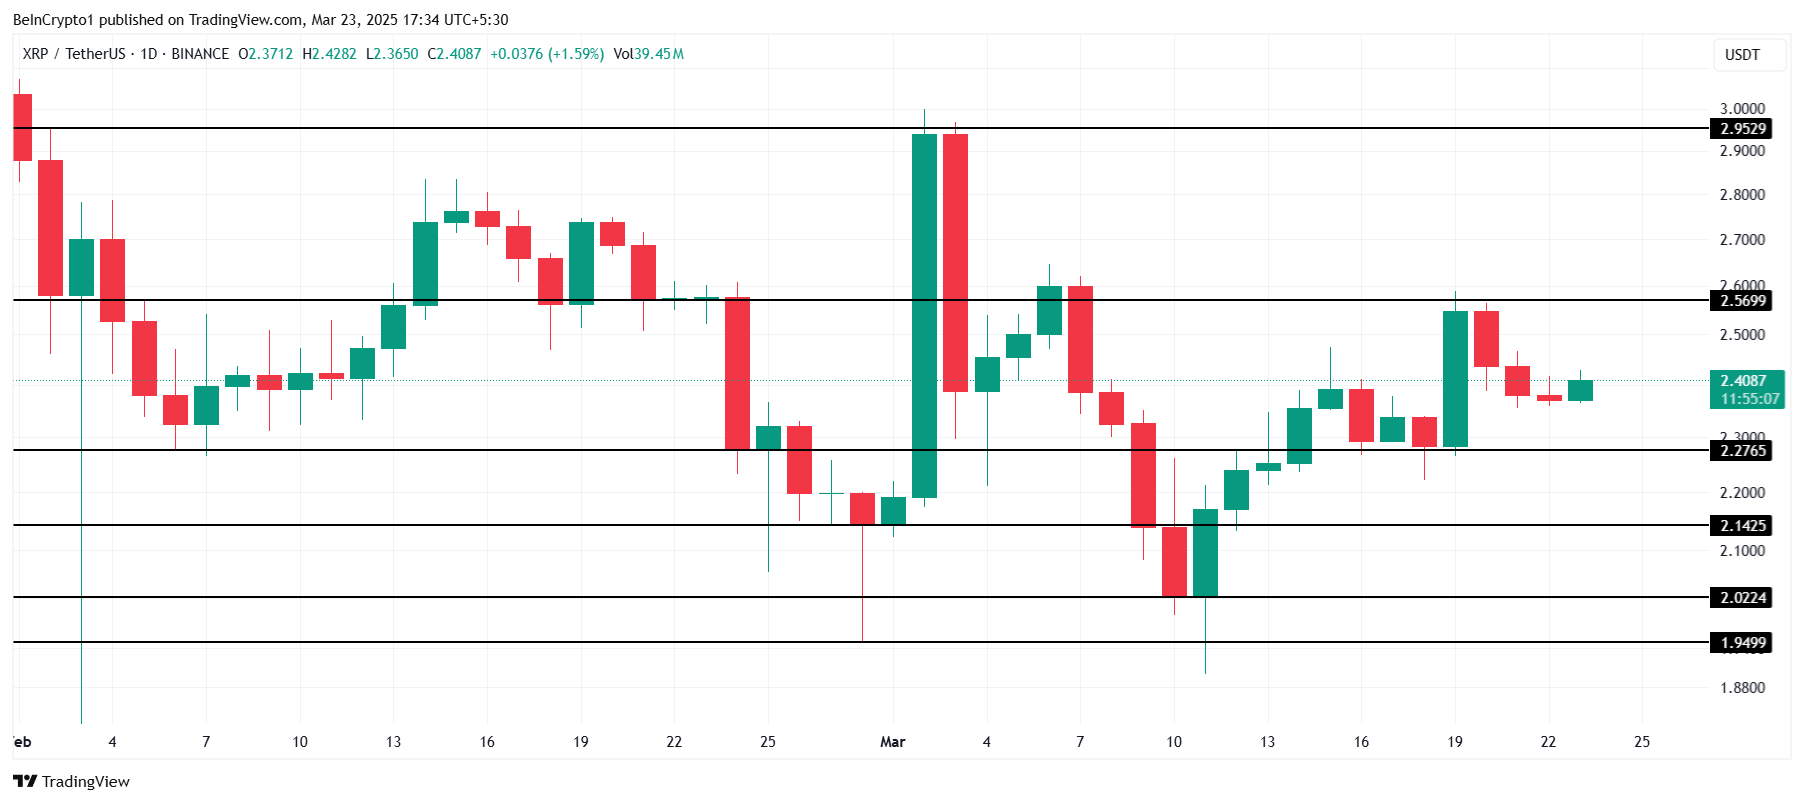
XRP has recently struggled to break through key resistance at $2.56, a level that the crypto token’s price has failed to surpass twice this month. This barrier remains the final hurdle on its path to $3.00. 

However, despite showing some positive movement, the altcoin’s failure to break this resistance could signal a continued consolidation phase, especially given the current market conditions.

XRP Investors Are Uncertain

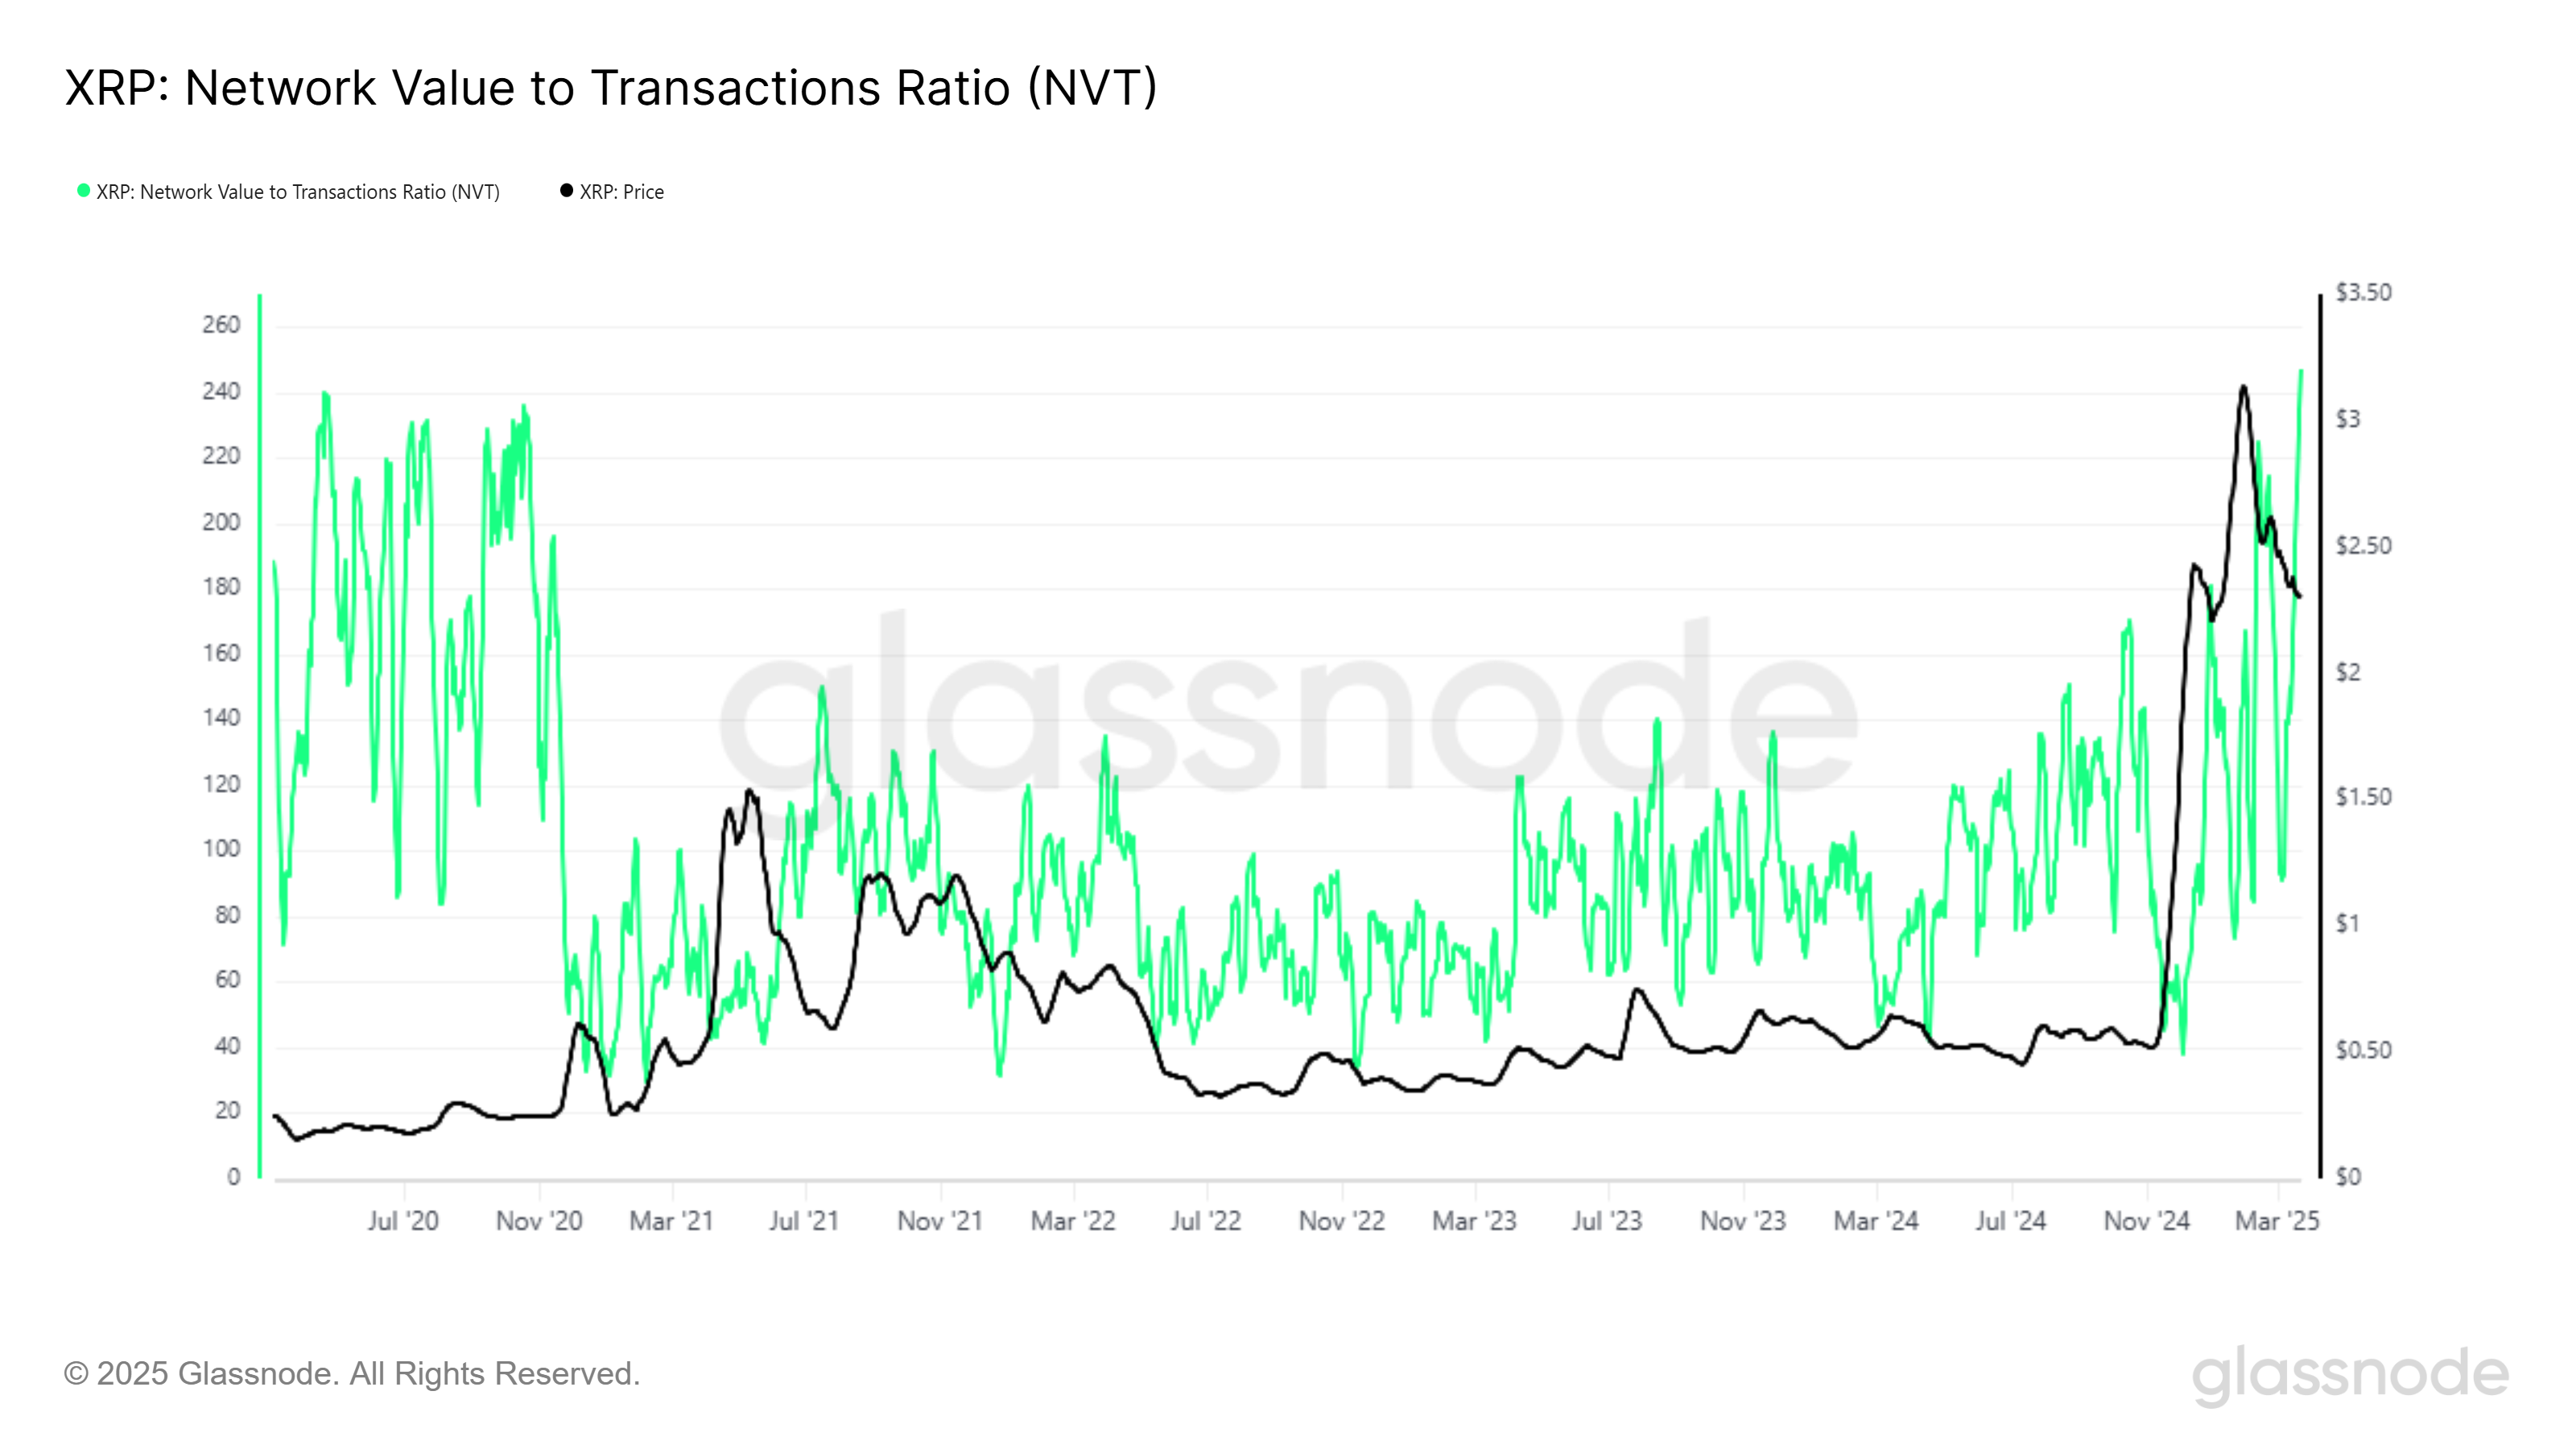
The Network Value to Transaction (NVT) Ratio for XRP has reached a five-year high, a level not seen since January 2020. This metric compares a cryptocurrency’s market capitalization to the volume of transactions conducted on its network. 

A high NVT ratio indicates that while investors are bullish, their optimism is not translating into actual growth or usage of the network. This disparity typically signals an overheated market, which often corrects as the excitement cools off. 

The current NVT ratio suggests that XRP’s value is outpacing its transaction activity, which is a bearish signal. As the market cools, this imbalance could lead to a price correction, further hindering XRP’s attempts to break through key resistance levels. 

XRP NVT Ratio.
XRP NVT Ratio. Source Glassnode

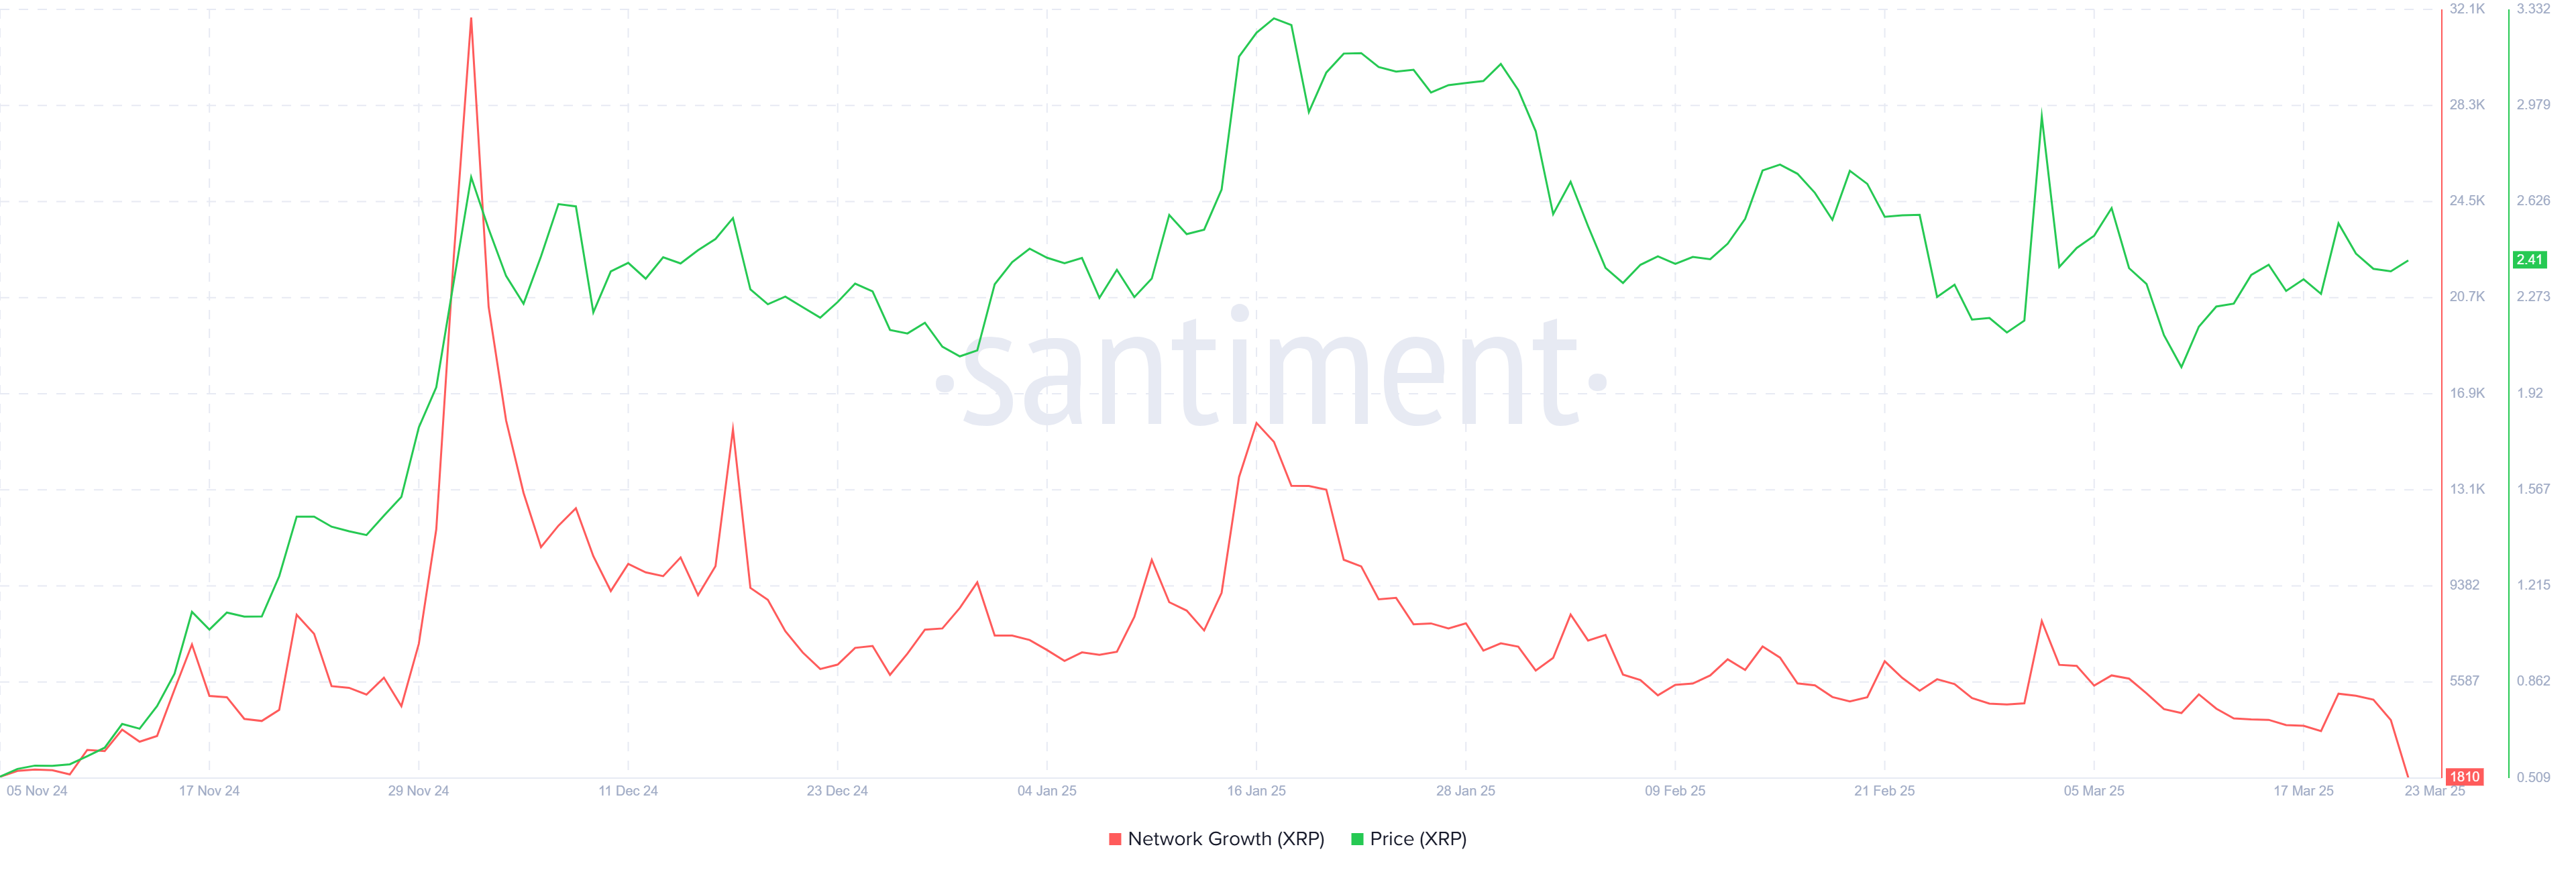
XRP’s macro momentum is also showing signs of strain. The network’s growth is currently at a four-month low, reflecting a decline in the rate at which new addresses are created.

This is a critical metric for assessing a cryptocurrency’s traction in the market, as a growing number of active addresses usually indicates increased adoption. 

In XRP’s case, the lack of new address creation suggests that the altcoin is struggling to attract new investors.  The lack of incentive for new investors to join the network further dampens XRP’s outlook. 

XRP Network Growth.
XRP Network Growth. Source: Santiment

XRP Price Finds Breakout Difficult

XRP is currently trading at $2.40, just below the resistance of $2.56. This level has proven to be a strong barrier, with XRP failing to breach it twice this month.

As a result, the altcoin is likely to continue consolidating between the $2.27 and $2.56 range. This period of consolidation may persist if the market conditions remain unchanged.

Should bearish conditions worsen, XRP could slide below its support at $2.27. In this case, the price may fall to $2.14 or lower, erasing much of the recent recovery from the $2.00 level.

The continuation of this downward movement would reinforce the bearish outlook.

XRP Price Analysis
XRP Price Analysis. Source: TradingView

However, if XRP can breach the $2.56 resistance and flip it into support, the bearish thesis would be invalidated. A successful breakout could push XRP toward $2.95 and, ultimately, the $3.00 mark.

This would require strong support from investors and a more favorable market environment to sustain the upward momentum.

The post XRP New Investor Rate Falls to 4-Month Low, Price Recovery Challenged appeared first on BeInCrypto.
Ripple in 2028: What Could XRP Price Be by the End of Donald Trump’s Second Term?

Ripple in 2028: What Could XRP Price Be In Trump's Second term

XRP, the digital currency associated with Ripple Labs Inc., is considered one of the coins with big price prospects in this current Donald Trump administration. As the third largest asset by market capitalization, XRP was changing hands for $2.371, down marginally by 0.61% in 24 hours. Despite the mild bearish outlook, there is reason to stay optimistic about long-term growth.

Since President Trump’s election victory, XRP has seen an impressive growth trend. The Republican win paved the way for crypto innovation in the country, forming a major headwind for the coin. In the long term, less regulatory oversight can help the Ripple ecosystem thrive, with an upside for the coin.

XRP and the Strategic Reserve Advantage

The liberation of XRP over the past month is considered a start. However, with this administration’s pro-crypto tilt, analysts are divided on how high the coin could soar by 2028 when President Trump will be at the end of his current tenure.

In an earlier XRP price prediction, analysts issued a target of $150 for the coin. While this forecast is not conservative, the prospect of XRP’s inclusion in strategic crypto reserve in the US offers more optimistic projections. As reported earlier by CoinGape, market analyst Crypto Pal believes XRP could jump to a $10,000 to $35,000 range if added to the reserve. 

Beyond the growing speculation of XRP’s inclusion in the reserve, a major challenge lies ahead. Most Bitcoin proponents believe altcoins in the stockpile might produce the opposite effect. However, if the coin bypasses this hurdle, the price has a huge prospect for a breakout.

XRP Utility Amid SWIFT and US Bank Integration

The Ripple Labs ecosystem is advancing rapidly, fueling the integration of some of its associated products in mainstream finance. As a blockchain payments firm, Ripple Labs always looks for top players to partner with. This has birthed speculations around a potential SWIFT partnership.

If this happens, the upside for the XRP price is enormous, with analysts suggesting a likely rally to $1,000. The coin and other Ripple products may come without much hurdle for SWIFT to integrate. The end of the Ripple and SEC lawsuit has cleared the path for the firm to grow its business in the United States.

Over the past few years, digital currency has been key in powering some global banks’ cross-border settlement systems. According to SBI CEO Yoshitaka Kitao, XRP is already on track to revamp Japanese banks’ remittance businesses.

The current regulatory outlook is expected to pave the way for US Banks to adopt XRP in the long term. Recall that the Office of the Comptroller of the Currency (OCC) has given the green light to banks to engage in crypto-related activities. This can help Ripple rebuild the payment partnerships it lost due to the SEC lawsuit.

Besides this outlook, President Trump’s trade policies, though worrisome at the moment, might indirectly favor American-first crypto innovations. With US Debt financing plans with crypto, the bull case for XRP is further solidified.

XRP Price Prediction for 2028

Different analysts forecast XRP using different models. However, CoinGape consulted DeepSeek AI on the coin’s price by 2028.

The AI model identified conservative, moderate, and bullish scenarios for the XRP price target. Under the conservative estimate, DeepSeek sees XRP trading around $10 to $20. This forecast hinges on the prospect of gradual adoption in the ecosystem.

The moderate estimate projects the coin to soar from $50 to $100 in the long term due to potential SWIFT and US partnerships. In the bull case scenario, the AI model sees the XRP price trading from $150 to $200 if it becomes integrated into crypto reserves.

Is XRP Price Breakout Ahead?

Many advocates believe XRP has faced suppression in the past four years owing to the Ripple lawsuit. However, President Trump’s renewed focus on encouraging crypto innovation has renewed the hope for cryptocurrency.

Macroeconomic trends, including potential rate cuts, create a headwind for the coin. This positive outlook shows Ripple may play a key role in redefining global finance by 2028, a trend that will profit XRP.

The post Ripple in 2028: What Could XRP Price Be by the End of Donald Trump’s Second Term? appeared first on CoinGape.

Will Pepe Coin Flip Shiba Inu?

Will Pepe Coin Flip Shiba Inu?

In the world of meme coins, Pepe Coin and Shiba Inu are two prominent names and are often considered competitors. Due to PEPE’s sudden popularity and exponential growth in 2024, it was seen as one of the most promising cryptos, but SHIB’s dominance was the best after Dogecoin and could not be shaken. With the crypto market’s changing dynamic, let’s see whether this frog-themed could finally flip its biggest competitor.

Pepe Coin Quick Rise & Fall

Pepe memecoin is a frog-themed cryptocurrency that challenged the entire market with its exponential growth right after its launch. Within a short period, PEPE’s price grew multiple folds, leaving the investors in disbelief and optimism at the same time.

Although things took a turn for the worse, and the price crashed immediately, the hype remained maintained. With high investor demand and whales’ active support, the PEPE price surged higher and higher in 2024, setting an ATH at $0.00002825  in December 2024.

This was the moment that presented the possibility of PEPE flipping the SHIB. Still, the market downtrend ruined the trajectory, and it currently trades at $0.000007182 with a market capitalization of $3.02B and trading volume of $389.39M, much higher than SHIB. However, a few Pepe Coin price predictions present a different picture.

Pepe Coin Price

Shiba Inu’s Performance As a Top Meme Coin

Shiba memecoin, inspired by the popular Japanese dog breed, had a slow start in 2021, but with time, it became the second biggest and most popular meme coin. It is often regarded as the Dogecoin Killer, but now PEPE is another competitor due to its bullish price performance.

Unlike PEPE, its prime is long lost, as its ATH sits at $0.00008845, achieved three years ago. More importantly, it has failed to regain a similar rally since then, currently trading at $0.00001274 with a market capitalization of $7.51B and trading volume of $108.08M. Despite the demand, many Shiba Inu predictions claim that another similar rally is nowhere near.

Shiba Inu price

Despite the lack of performance, its comparatively higher stability over the years has made it superior to Pepe memecoin.

Pepe Coin Price Prediction: Will PEPE Finally Flip Shiba Inu in 2025?

Pepe coin’s bullish price performance in 2024 has led many investors to anticipate it to surpass the Shiba Inu coin. Crypto analyst Jameson once argued that PEPE can flip SHIB due to highly bullish triangle pattern formation. He claimed that it is a matter of time before this actually happens.

Pepe Coin to flip Shiba Inu

Although this has not happened to this day, the possibility still exists. Recently, another analyst, Chandler, questioned, “Can’t believe PEPE still hasn’t flipped SHIB in market cap. Absolute joke.” His question was based on the trading volume difference between the two, where PEPE has nearly twice the SHIB despite the latter having higher demand and stable price performance.

Pepe Coin price prediction

Others added that it was a matter of time before this happened. Some regarded PEPE as the king of the internet and predicted it would reach significant highs. However, its failure to do so limited the possibility. More importantly, for Pepe Coin to flip Shiba Inu, its price will have to be $0.00001802 today to achieve the same market cap as the latter, which is impossible.

The same is true on most predictions, as PEPE’s market cap has to be higher than SHIB’s, which is more than twice in the current scenario. However, in the most optimistic scenario, this may happen.

The post Will Pepe Coin Flip Shiba Inu? appeared first on CoinGape.

Why Is the Crypto Market Up Today? Will Bitcoin Price Crash Again?

Why Is the Crypto Market Up? Will Bitcoin Price Crash Again

The crypto market is still facing capitulation as most digital currencies are reversing the selloffs registered in the past week. The price of Bitcoin (BTC) remains in the spotlight as the combined crypto market capitalization jumped 2.44% to $2.76 trillion. With sellers quietly exiting the market, whether the underlying factors can sustain the current outlook remains unknown.

Crypto Market Rebound, Here’s The Trigger

Uncertainty has defined the trajectory of the most assets thus far this month as top coins dropped to their lowest levels this year. While Bitcoin’s price has shown strength, it fell to a low of $76,624.24 before reclaiming the $80,000 mark according to CoinMarketCap data.

Altcoins like Ethereum (ETH) and Solana (SOL) also dropped to new multi-week lows earlier in the month. While Ethereum fell to a monthly low of $1,760.94, Solana bears dragged the coin down to a $113 low. As it stands, BTC and altcoins have bounced off key support, which was formed at their respective monthly lows.

Since the Digital Asset Summit earlier in the week, the crypto market has not witnessed any bearish negative news. Rather, investors are digesting the Trump promise of stablecoin legislation from Congress and a BTC reserve confirmation.

On the macroeconomic level, mainstream media updates regarding the tariff war have toned down, giving the stock market room to recover.

More Selloff Ahead for Bitcoin Price?

At the time of writing, the BTC price had changed hands for $84,295.18, up 2.4% in 24 hours. The coin has pared off the losses incurred in the past week. However, the BTC price still maintains its 30-day loss of 14.27%.

At the moment, shorter-term headwinds in the market are cleared, with ETF investors returning to the scene. Per an earlier CoinGape report, spot Bitcoin ETFs scored an inflow of $785 million after a tumultuous 7-day trend.

Unlike a typical weekend in the industry known for its volatility, BTC prices show stability. Should the positive regulatory shift continue, Bitcoin might turn the $84,000 level into sustainable support.

Where is the Crypto Market Heading?

The current bullish outlook also extends to other altcoins. Per an earlier Solana price analysis, the prospect of a $1000 breakout was explored as the coin formed a parabolic base.

XRP is also in the spotlight following the Ripple and SEC lawsuit resolution, which has carved a positive growth path for it. While most analysts have different price projections for top coins, including Cardano and Dogecoin, the visible outlook shows a tempered selloff for now.

The post Why Is the Crypto Market Up Today? Will Bitcoin Price Crash Again? appeared first on CoinGape.

Analyst Reveals Why Cardano Price Rally To $10 Isn’t ‘Crazy’

Analyst Reveals Why Cardano Price Rally To $10 Isn’t ‘Crazy’

Several theories are touting Cardano price to clinch $10 but critics are tagging the projections as outlandish. However, one cryptocurrency analyst has picked up the gauntlet to rationalize the claims of ADA reaching $10 during this cycle, citing a slew of factors.

Cardano Price To $10 Is In Play

Cryptocurrency analyst Dan Gambardello has reiterated claims that Cardano price is headed to $10 in this cycle. According to his analysis, Gambardello poked a hole through the barrage of criticisms leveled against ADA optimists backing the asset to reach $10.

Gambardello began his analysis with key ADA fundamentals, citing its speed, decentralization, scalability, and security standards. He points to incoming Bitcoin DeFi and the potential unlocking $2 trillion opportunity for Cardano. The recent Cardano Lace Wallet retrofitted with multichain functionality specifically for the Bitcoin blockchain underscores the point.

The analyst turns his gaze to the impending end of quantitative tightening and the start of quantitative easing by the Federal Reserve and its potential for cryptocurrencies. According to Gambardello, the move signals a major “bullish catalyst” for ADA given the uptick of liquidity flooding the market.

Gambardello bolsters his argument with ADA’s inclusion in the Digital Asset Stockpile as proof of Cardano’s price climbing to $10.

ADA Trading at $10 Is Not A Crazy Idea

At the moment, ADA is trading at $0,70, a far cry from the projected $10. However, Gambardello argues that the Cardano price can clinch reach $10 given its positives.

“A $10, $350 billion market cap sounds crazy to a lot of people, I understand,” said Gambardello. “But I will not ignore the possibility of it just because it sounds crazy.@

The analyst goes on to cite Cardano’s run to reach an all-time high, surging from $0.3 to $3.09 back in 2021. Gambardello says that at the time Cardano price climbed by nearly 1,000% without smart contracts or an inclusion into the Digital Asset Stockpile.

A move toward $10 represents a 1,300% jump for ADA which Gambardello says is within reach given Ethereum’s price action during the last bull run. While Gambardello did not give a clear timeline, he disclosed that multiple ADA retracements are a real possibility before the final march to $10.

The post Analyst Reveals Why Cardano Price Rally To $10 Isn’t ‘Crazy’ appeared first on CoinGape.

Ethereum Price Eyes Key Resistance as Analysts Warn of Drop to $1,700

Ethereum Price Eyes Key Resistance as Analysts Warn of Drop to $1,700

Ethereum price is approaching a key technical level that has historically acted as a barrier to upward price movement. According to recent technical analysis, this resistance zone has triggered past reversals, and analysts caution that another failure to break above could lead to a downward correction. The altcoin is trading within a descending channel, a pattern typically associated with bearish trends. While some analysts remain optimistic about a potential rebound, others warn that the next move could push ETH price lower, targeting a key support of $1,700.

Analysts Warn of Ethereum Price Potential Fall to $1,700

According to a recent analysis, Ethereum price is nearing a resistance zone at $2,200. This level coincides with the upper boundary of a Descending Channel. Technical analysts consider this pattern bearish. Price movements within the channel have shown lower highs and lower lows, indicating downward pressure.

Crypto analyst MadWhale shared a chart showing Ethereum trading close to this critical resistance. Previous interactions with this level have led to downward reversals. The analyst suggests that failure to break this zone may trigger a 13% decline. The projected target is $1,700, a level that has previously served as support.

ETH price
Source: TradingView

More so, another recent analysis shows that ETH/BTC is currently testing a critical support zone last seen in late 2020, raising the possibility of a trend reversal after years of decline. This technical setup, combined with record-high futures open interest of 10.23M ETH, signals a rising potential for a rebound.

Technical Indicators Support a Bearish Outlook

The Ethereum price chart also shows weakening bullish momentum. A rounded top pattern is forming near the resistance. This technical formation suggests that buying pressure is declining. Volume analysis reveals that trading activity is inconsistent, with low participation during recent gains and higher volume during declines.

Lower highs on the daily chart further support a potential downward continuation. These are typical in bearish trends. Traders are advised to monitor for signs of increased selling pressure. Confirmation of a rejection, such as a bearish candlestick pattern or rising sell volume, could strengthen the case for a decline toward $1,700.

According to the Moving Average Convergence Divergence (MACD), ETH is currently showing signs of waning bearish momentum as the MACD line is approaching a bullish crossover with the signal line. If this crossover occurs and is supported by increasing histogram bars, it could indicate a potential price rebound for the top altcoin.

Alternate Scenario: Analyst Forecasts Bullish Targets 

While bearish indicators persist, some market observers maintain a positive view. Analyst Patron has outlined three possible bullish price targets. According to his analysis, if the top altcoin holds support near $1,980, a short-term rally could occur. His initial target is $2,296, reflecting a potential increase of over 15%.

ETH price
Source: X

Further upside targets include $2,913 and $4,000. These projections assume that current support holds and momentum shifts in favor of buyers. The analyst’s outlook is based on Ethereum price recovering from recent lows and reclaiming previous highs. This scenario would challenge the bearish narrative if confirmed by increased volume.

At press time, the crypto is trading at $1,999.75, marking a 1.20% gain over the past 24 hours. Despite the price uptick, trading volume has dropped sharply by 37.37%, indicating a possible divergence.

The post Ethereum Price Eyes Key Resistance as Analysts Warn of Drop to $1,700 appeared first on CoinGape.