Ethereum on the Verge of Crash, $1,000 Calling?
The post Ethereum on the Verge of Crash, $1,000 Calling? appeared first on Coinpedia Fintech News
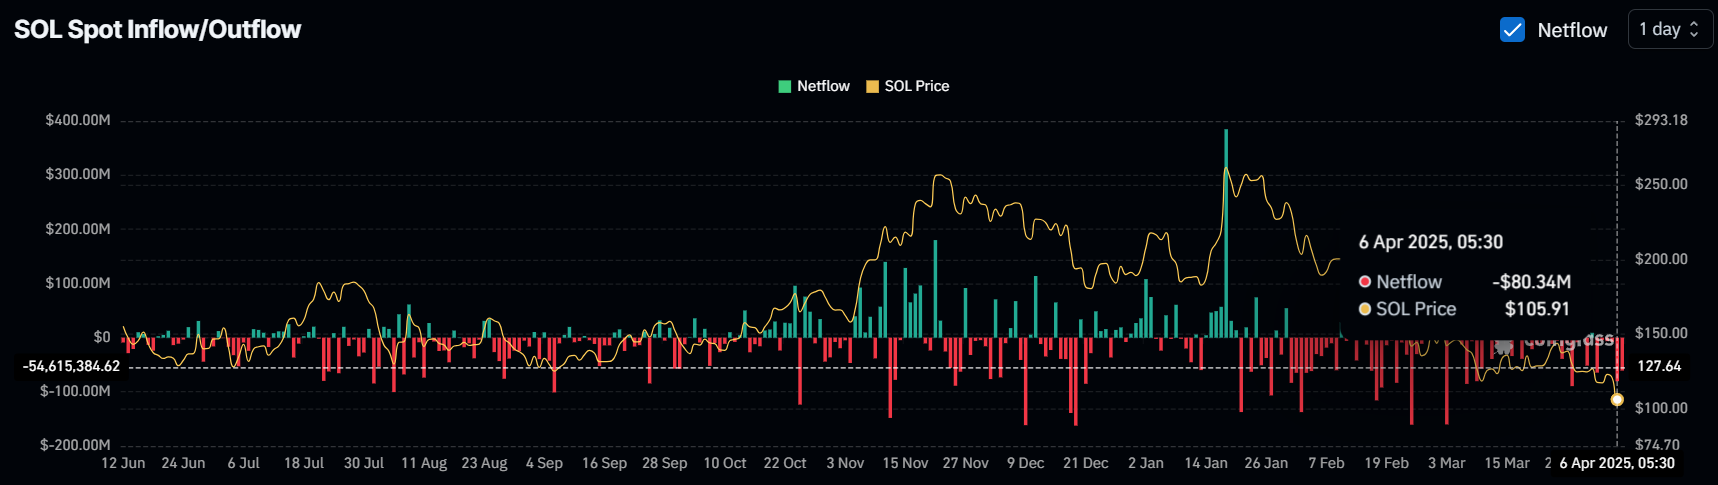
In the ongoing tariff war between the United States and other countries, the cryptocurrency market has significantly plummeted. Amid this, Ethereum (ETH), the second-largest cryptocurrency, is on the verge of a major crash.
According to CoinMarketCap data, ETH has lost almost 25% of its value in just five trading days and has reached a make-or-break level.
Ethereum (ETH) Price Action and Technical Analysis
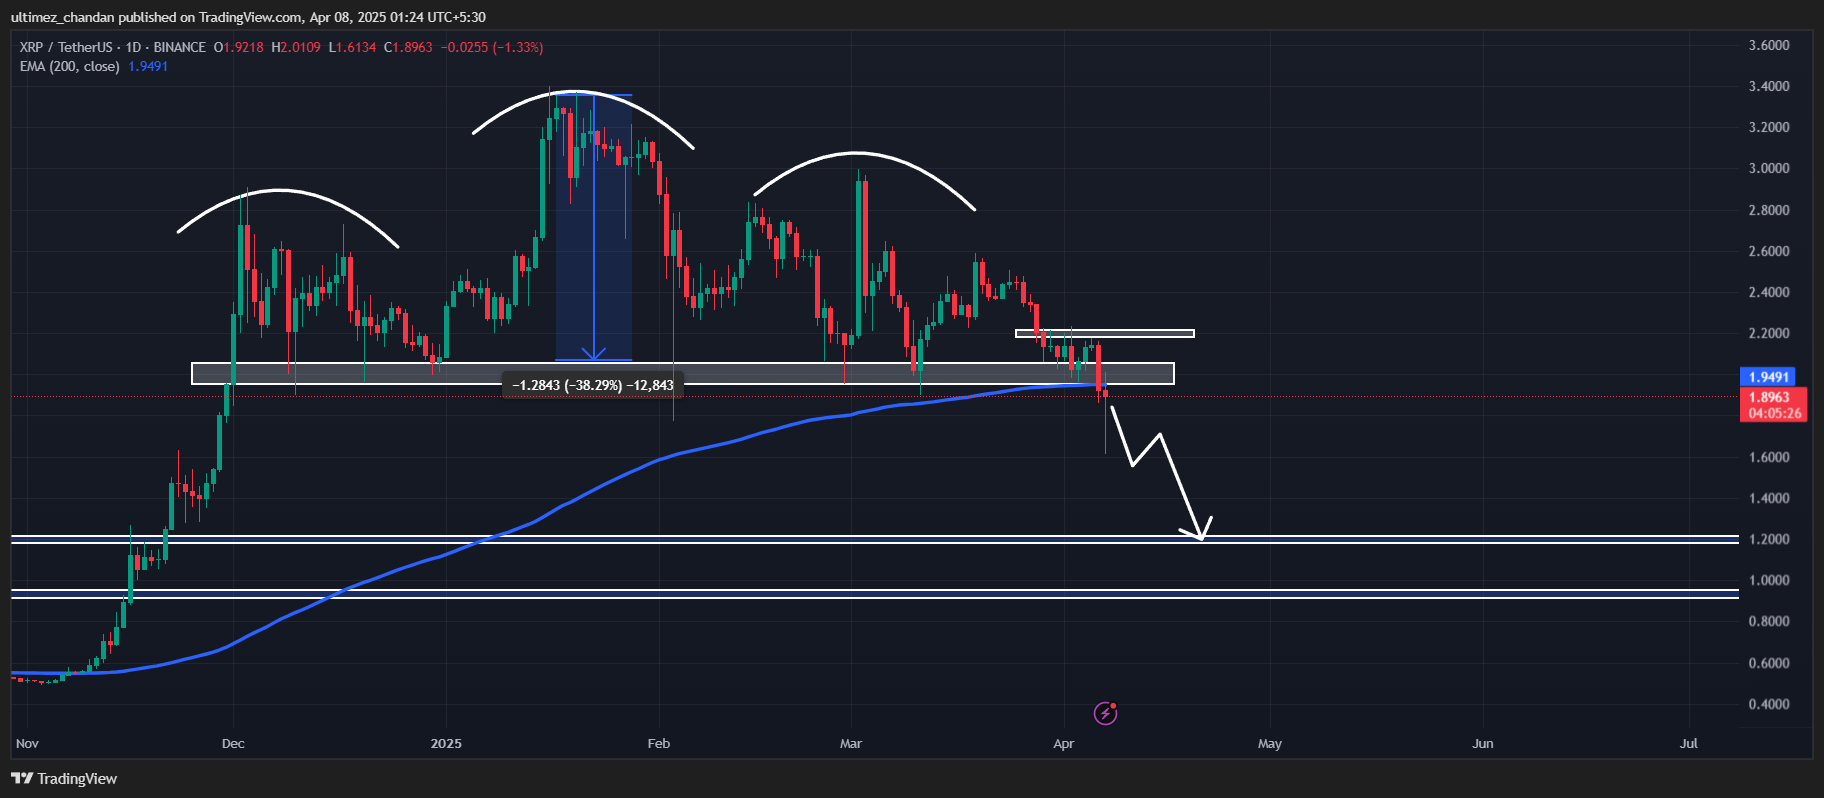
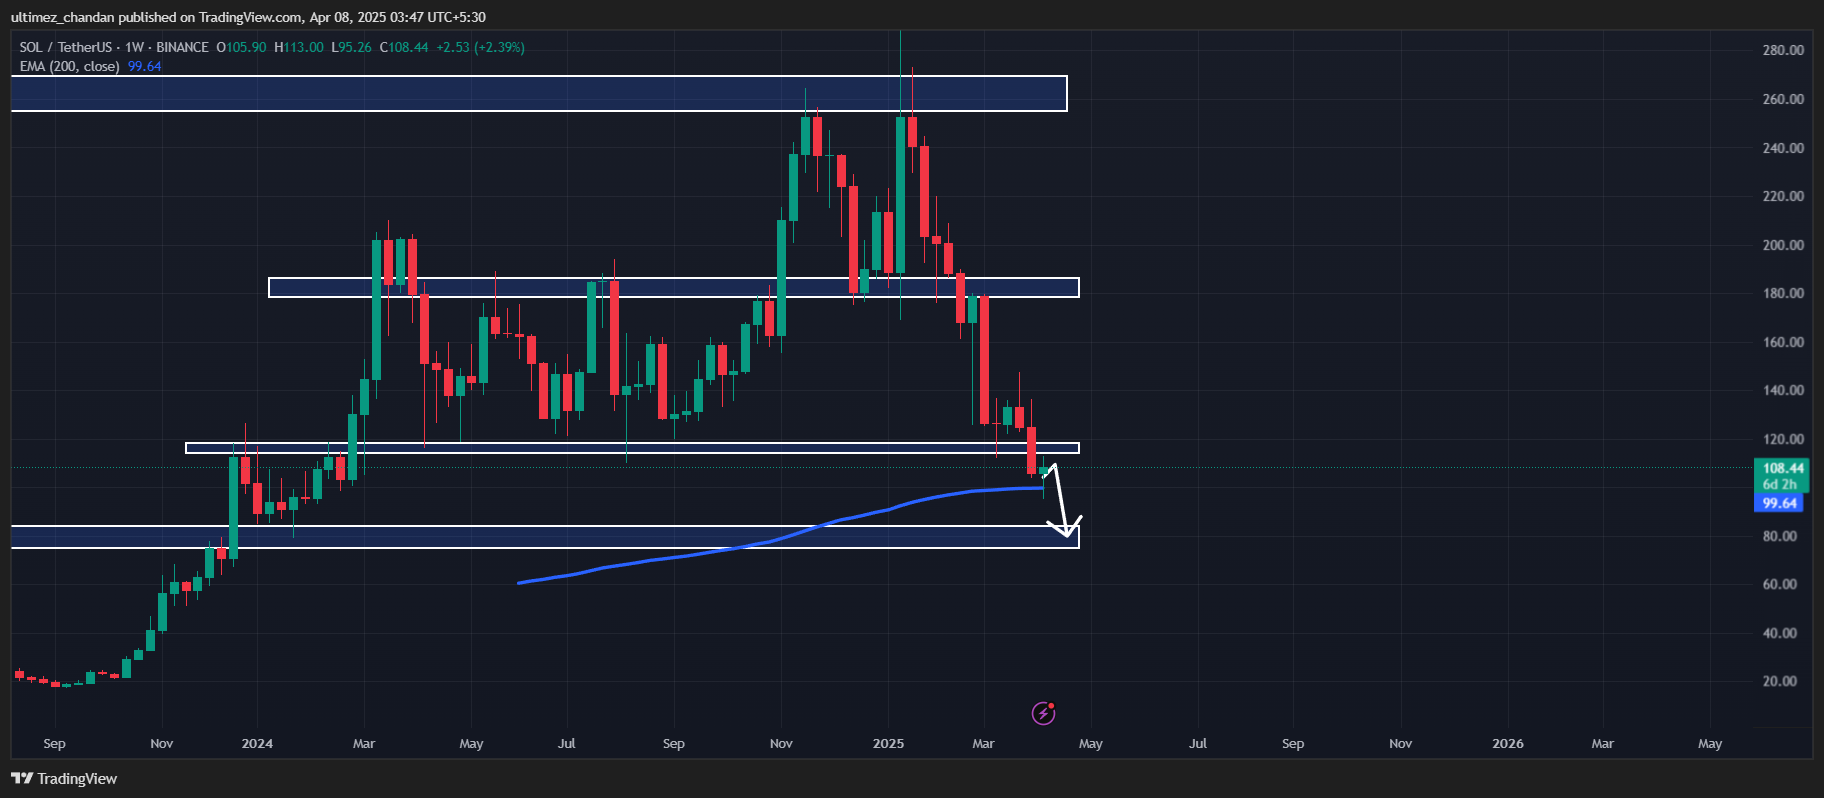
While examining the weekly chart of ETH, it appears that the asset has recently lost its long-held support from the ascending trendline that had been in place since July 2022.
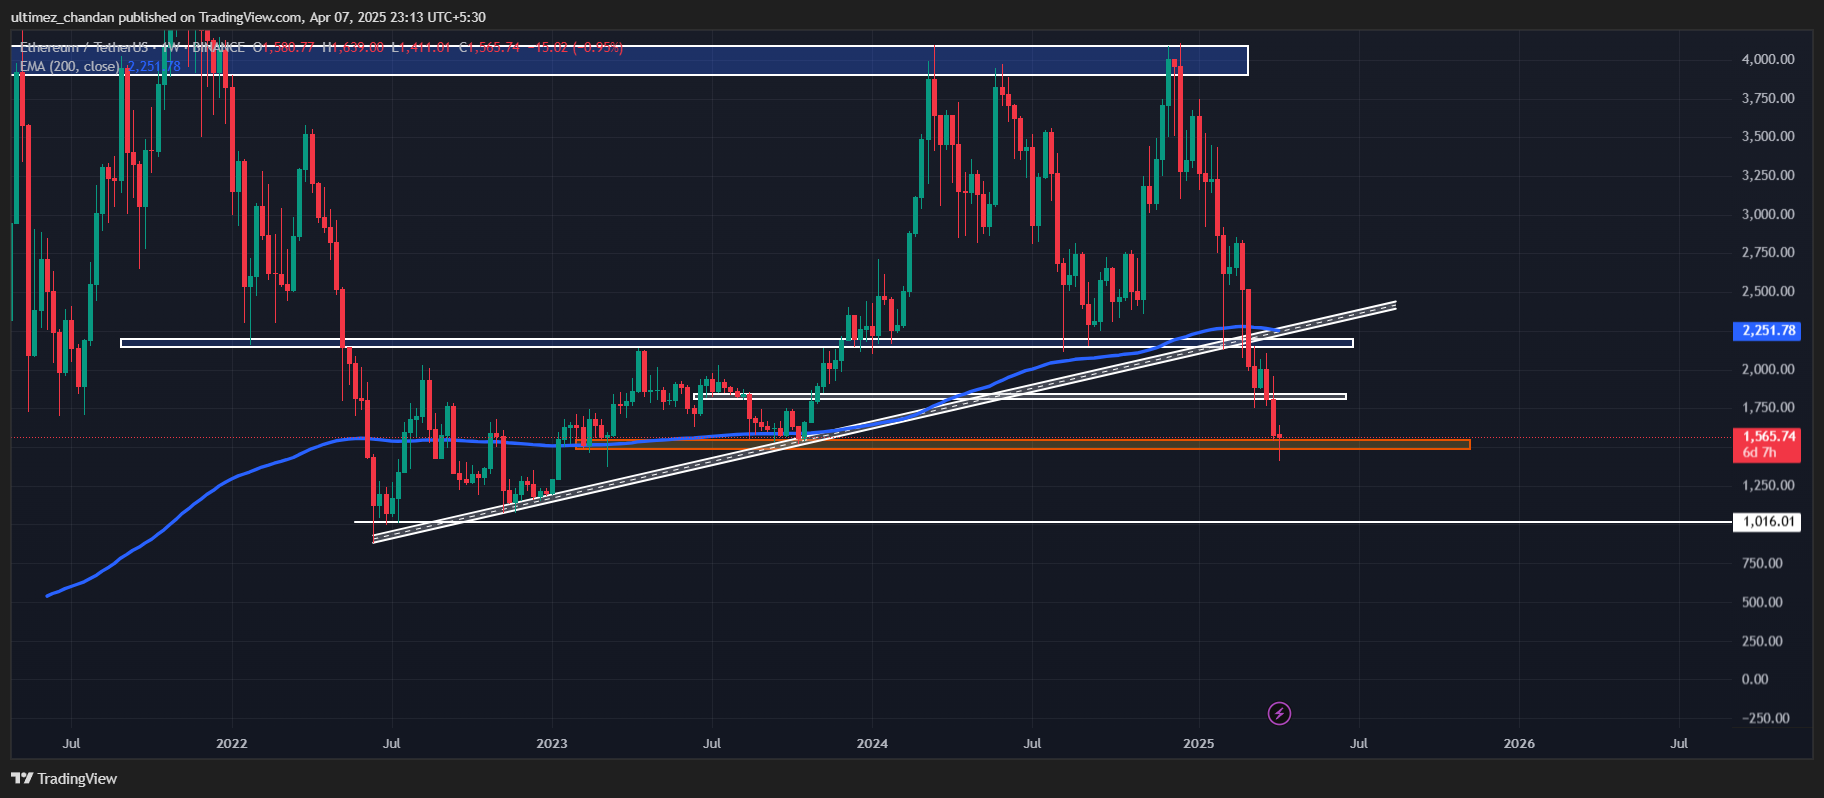
Following the breakdown, the asset has been steadily falling, during which it has lost two key support levels at $2,200 and $1,830, and has now reached another critical support level at $1,530.
Ethereum Price Prediction
According to expert technical analysis, if this downside momentum does not stop, the price could crash hard.
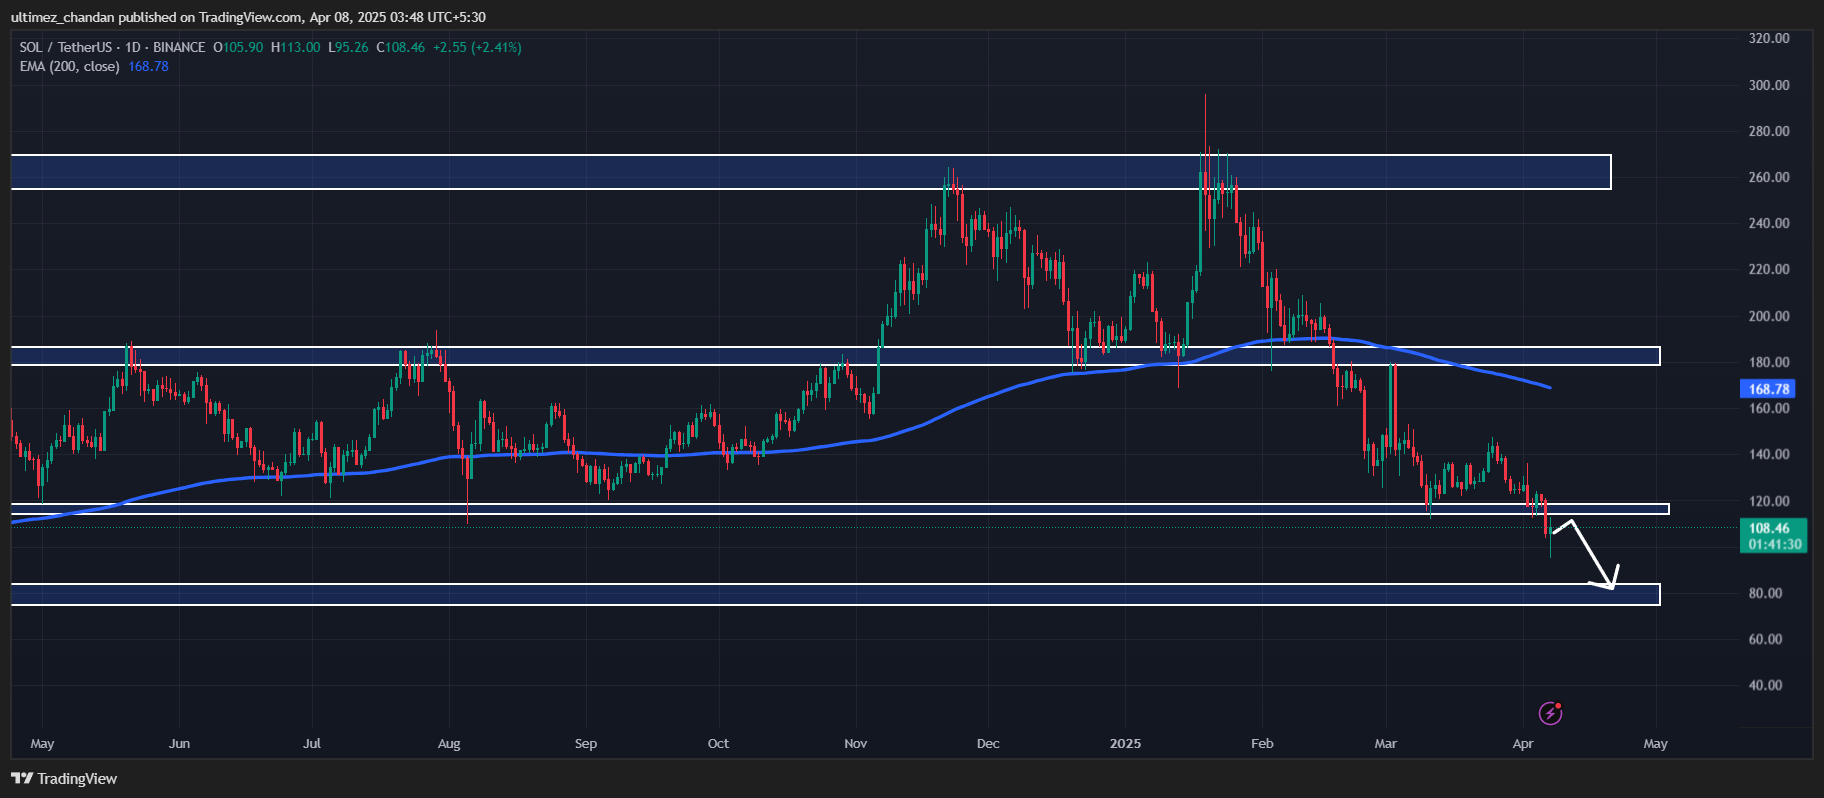
The daily chart reveals that if the ETH price fails to hold this support level and closes a daily candle below $1,450, there is a strong possibility it could drop by another 30% to reach its next support level at $1,000 in the near future.
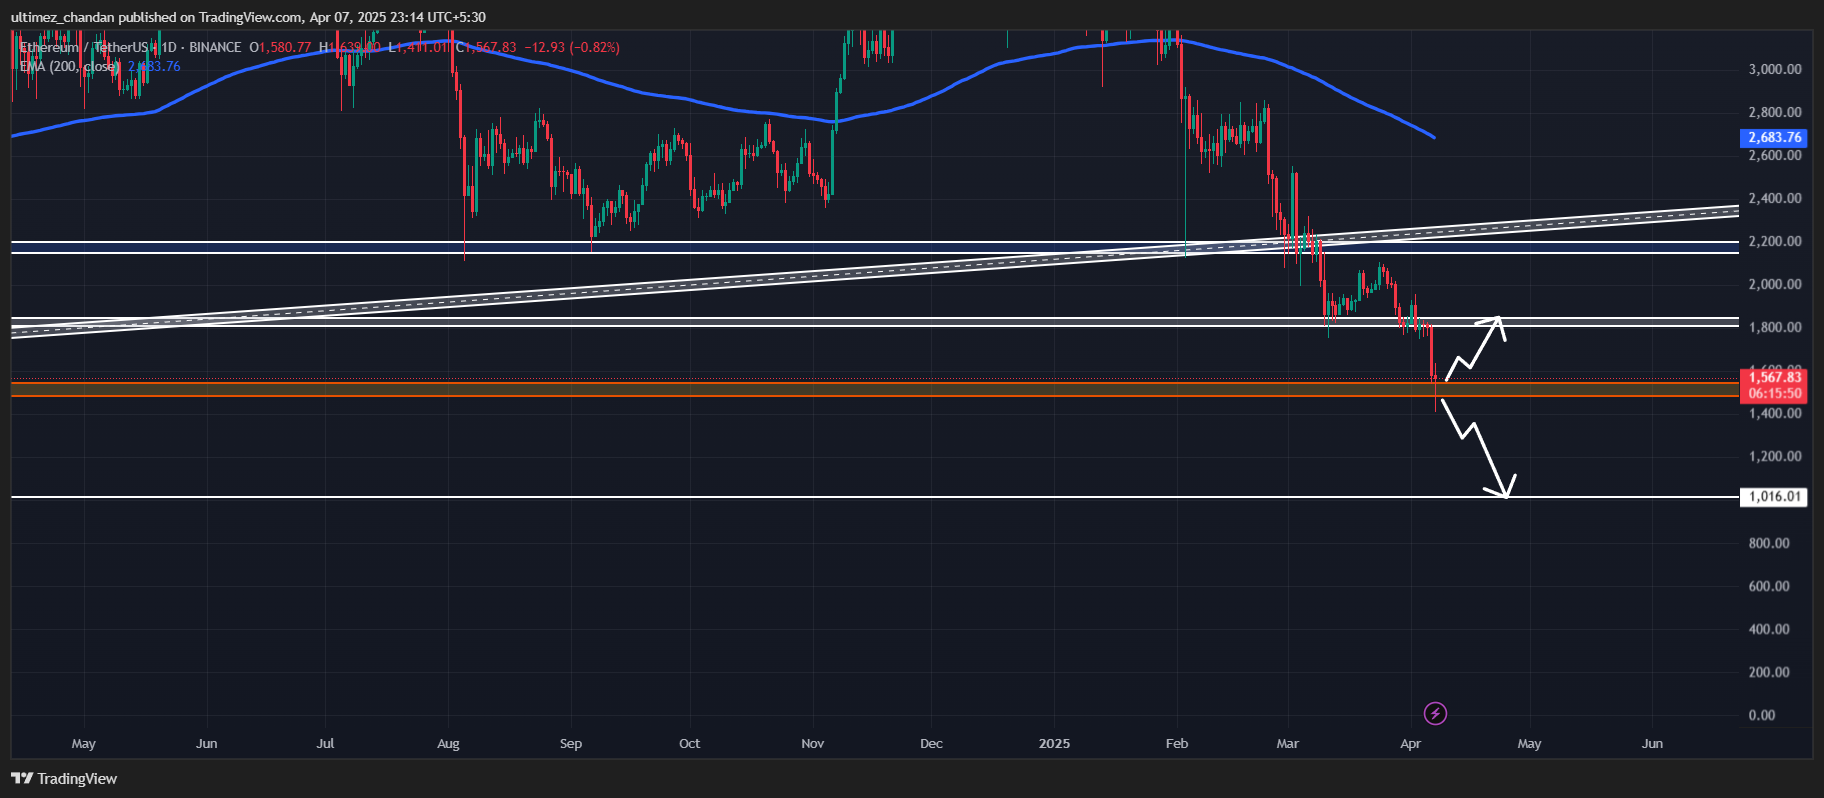
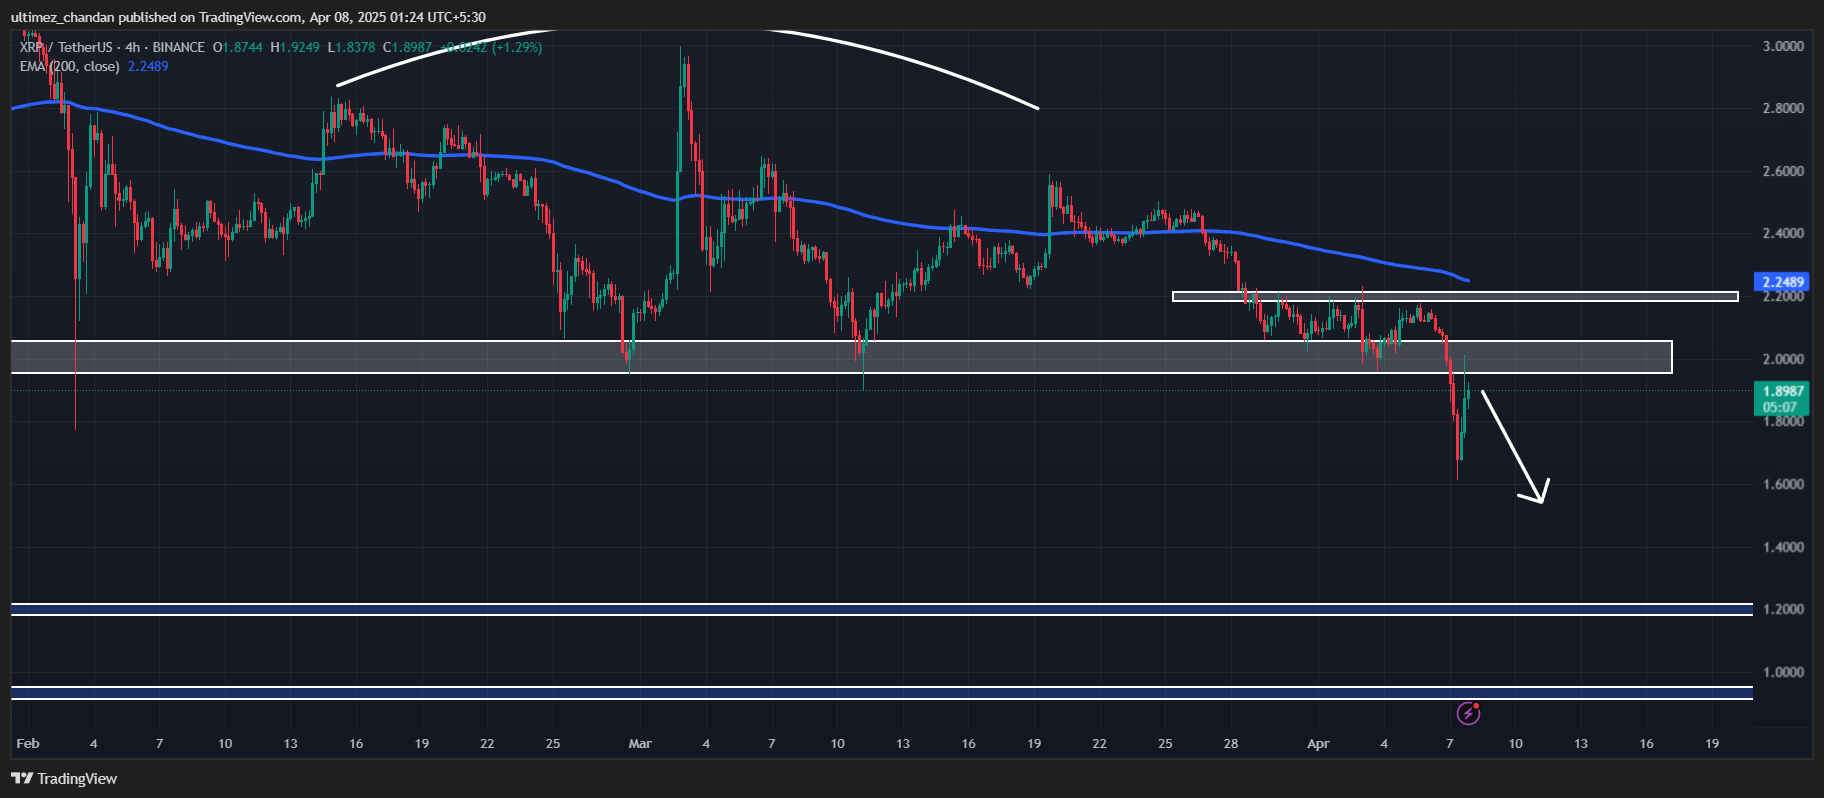
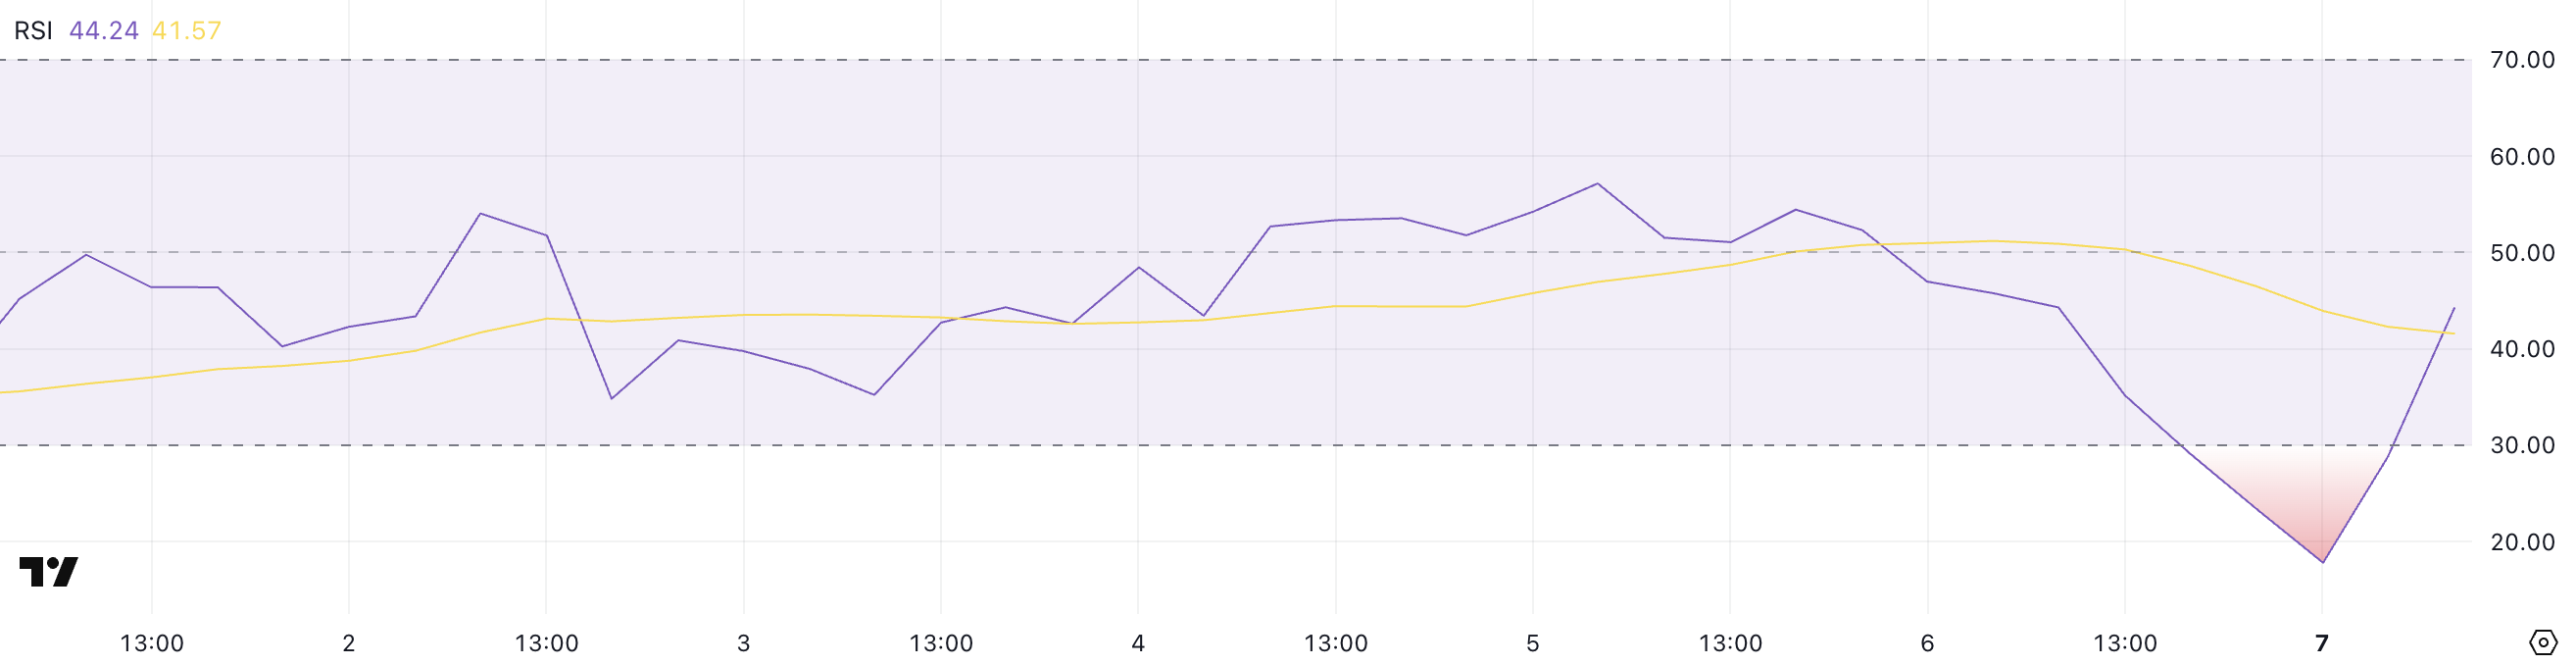
Following the continuous price decline, ETH is now trading below the Exponential Moving Average (EMA) on the four-hour, daily, and weekly timeframes, indicating a strong bearish trend.
Current Price Momentum
At press time, ETH is trading near $1,550 and has lost nearly 10.50% of its price over the past 24 hours. However, during the same period, the asset’s trading volume jumped by a record 550%, indicating heightened participation from traders and investors compared to the previous days.
$200 Million Worth of Bullish Bet
This record surge in trading volume includes the liquidation of traders’ short and long positions, recent investor accumulation or sell-offs, and all other ETH-based trading activity.
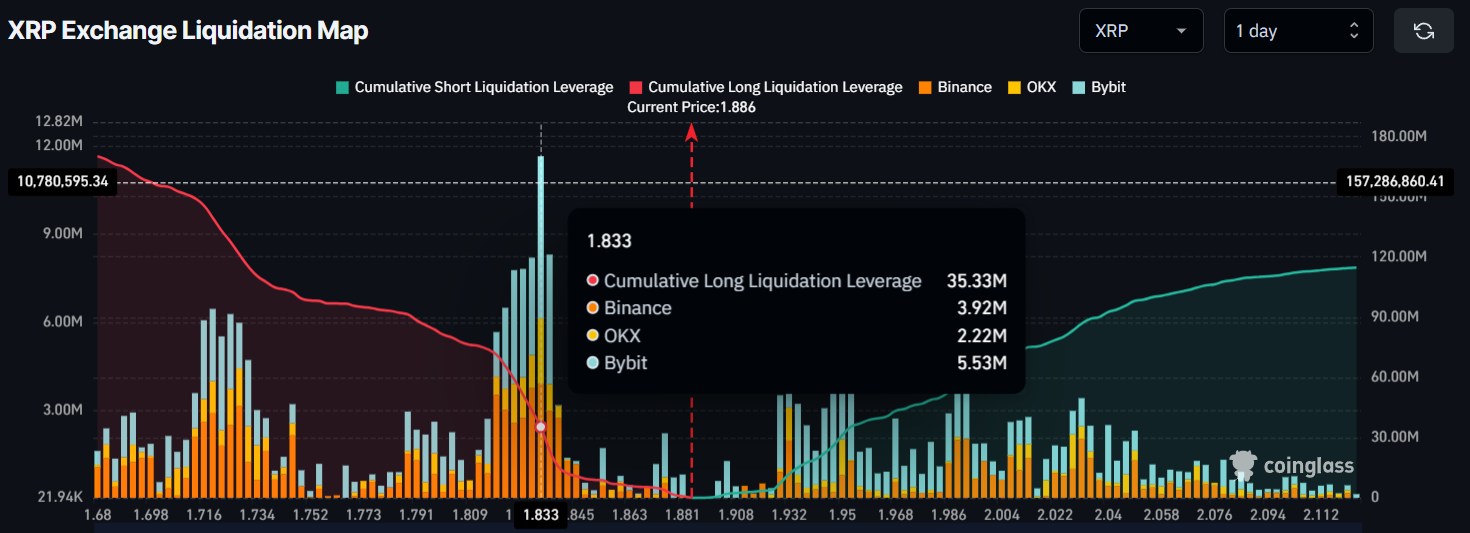
Despite the massive price crash over the past 24 hours, traders seem optimistic and are strongly betting on the bullish side, according to on-chain analytics firm Coinglass.
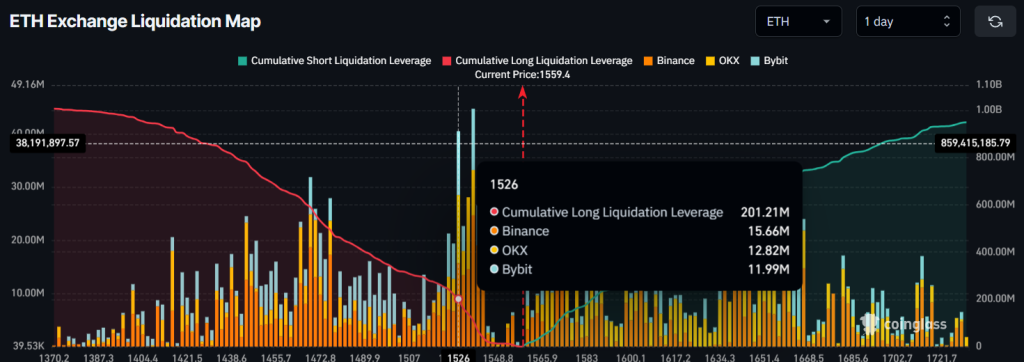
Data reveals that traders are currently over-leveraged at the $1,526 support level, having built $201 million worth of long positions. On the other hand, $1,571 is another over-leveraged level, where traders have built $100 million worth of short positions.
While examining these levels and traders’ positions, it appears that the bulls are currently dominating and could potentially liquidate $100 million worth of short positions. However, if the market sentiment continues to remain unchanged, it could also lead to the liquidation of traders’ long positions.
The post Ethereum on the Verge of Crash, $1,000 Calling? appeared first on Coinpedia Fintech News
In the ongoing tariff war between the United States and other countries, the cryptocurrency market has significantly plummeted. Amid this, Ethereum (ETH), the second-largest cryptocurrency, is on the verge of a major crash. According to CoinMarketCap data, ETH has lost almost 25% of its value in just five trading days and has reached a make-or-break …