Beyond the Meme Coin Frenzy: What’s Next for Solana After the Hype?

At the beginning of 2025, Layer-1 (L1) blockchain network Solana found itself in the spotlight, thanks to meme coins. 

Donald Trump’s Official Trump (TRUMP) meme coin launch on January 17 ignited a flurry of activity across the network, driving demand to levels unseen since the 2021 bull cycle. 

While these volatile assets boosted Solana’s network activity and pushed up SOL’s price, they also present a paradox. They have brought in liquidity, users, and attention—but at what cost?

Presidential Memes Pump Solana Into Overdrive

Solana’s cheap, lightning-fast transactions and highly composable DeFi infrastructure make it one of the most preferred blockchains for launching meme coins. So when newly elected Donald Trump launched his TRUMP meme coin on the network in January, it came as no surprise to many.

Following TRUMP’s launch on January 17, demand for Solana skyrocketed, driven on the one hand by developers eager to launch their own meme coins and on the other by the frenzy of trading activity surrounding them.

Melania Trump followed her husband’s lead by launching her MELANIA meme coin on the same chain two days later. This move exacerbated the meme hype and drove significant trade volumes across multiple meme coins, both existing and newly created.

For example, within a day of launch, MELANIA’s trading volume soared 396%, jumping from $1.33 billion to $6.6 billion, according to CoinGecko data. 

Solana Memes Took It to the Moon, Then Back Down

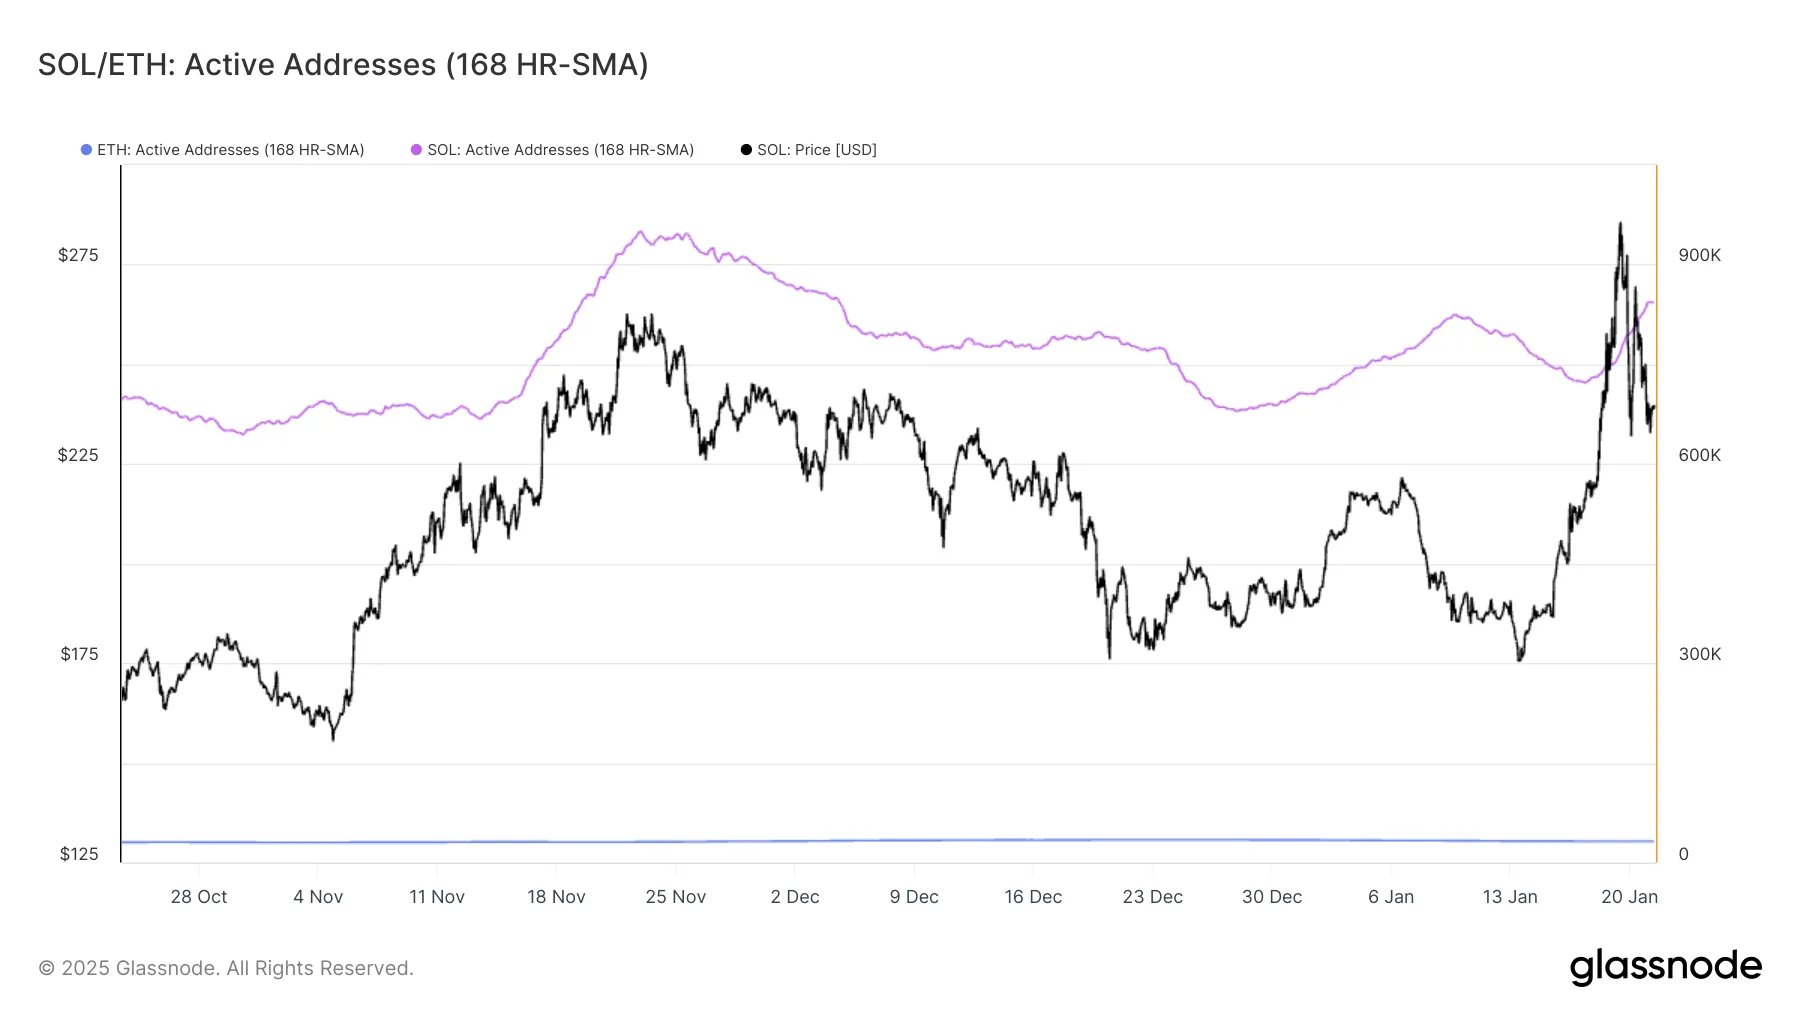
This development drove significant user engagement on Solana.  According to Glassnode, by January 24, the network was processing 832,000 active addresses per hour, over 26 times more than Ethereum, which recorded just 31,000 per hour.

SOL/ETH Active Addresses
SOL/ETH Active Addresses. Source: Glassnode

Due to the huge influx of new users on the network, transaction fees rocketed. Per Glassnode, Solana’s total transaction fees climbed to an all-time high of $32.43 million on January 19 after MELANIA launched. On the same day, SOL climbed to an all-time high of $293. 

SOL Total Transaction Fees.
SOL Total Transaction Fees. Source: Glassnode

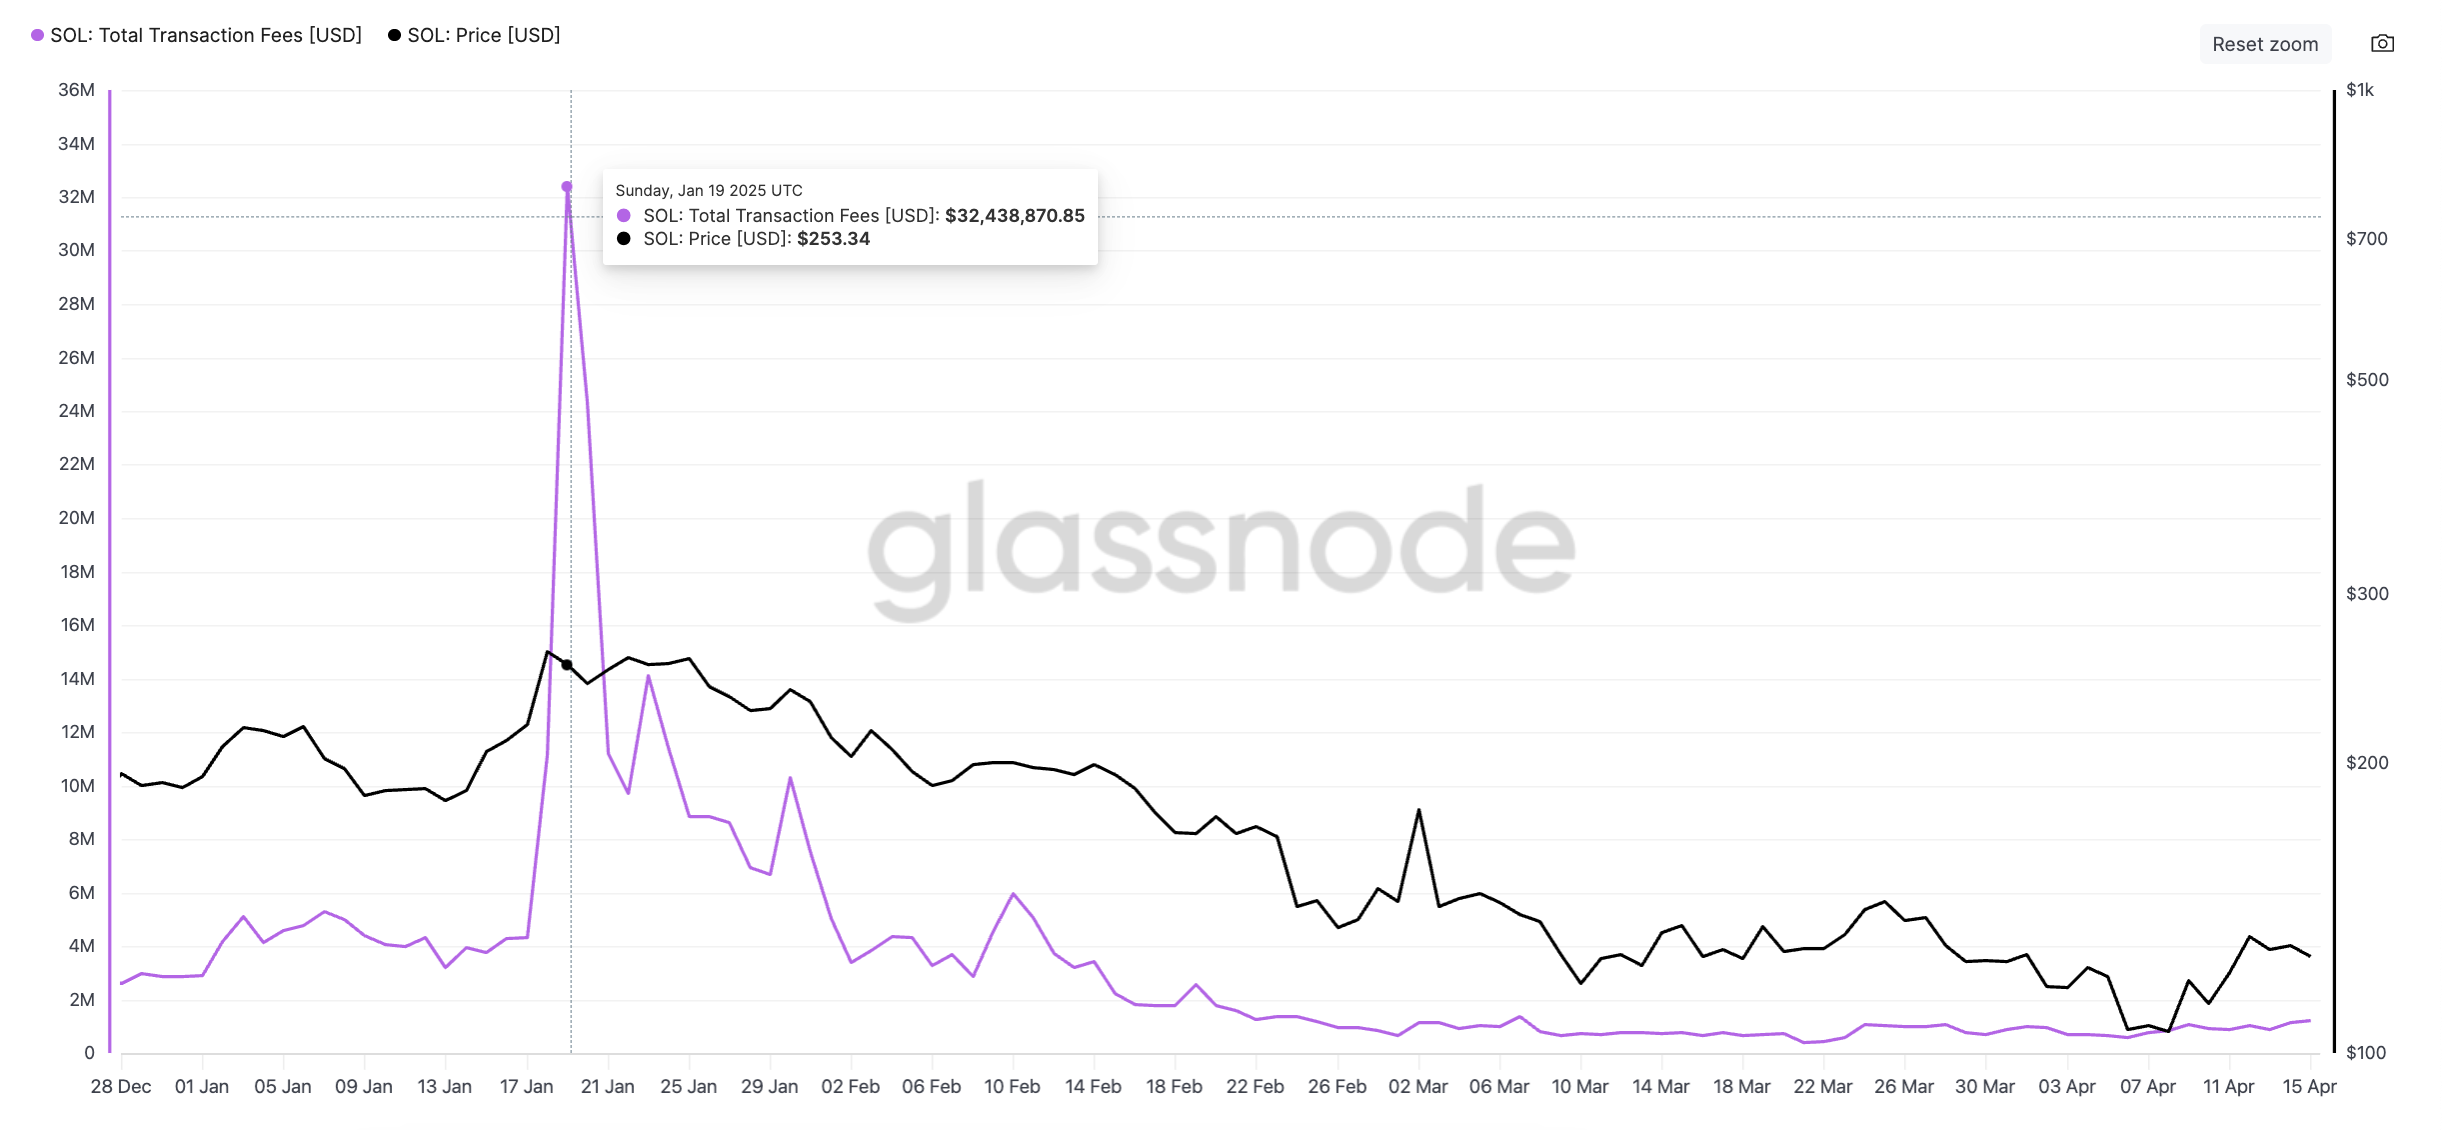
However, market exhaustion set in shortly after this price peak was reached. The meme coin mania began to fade, taking Solana users with it. Daily active addresses and new demand for the L1 plunged, dragging down DEX volume, SOL’s price, and DeFi TVL.

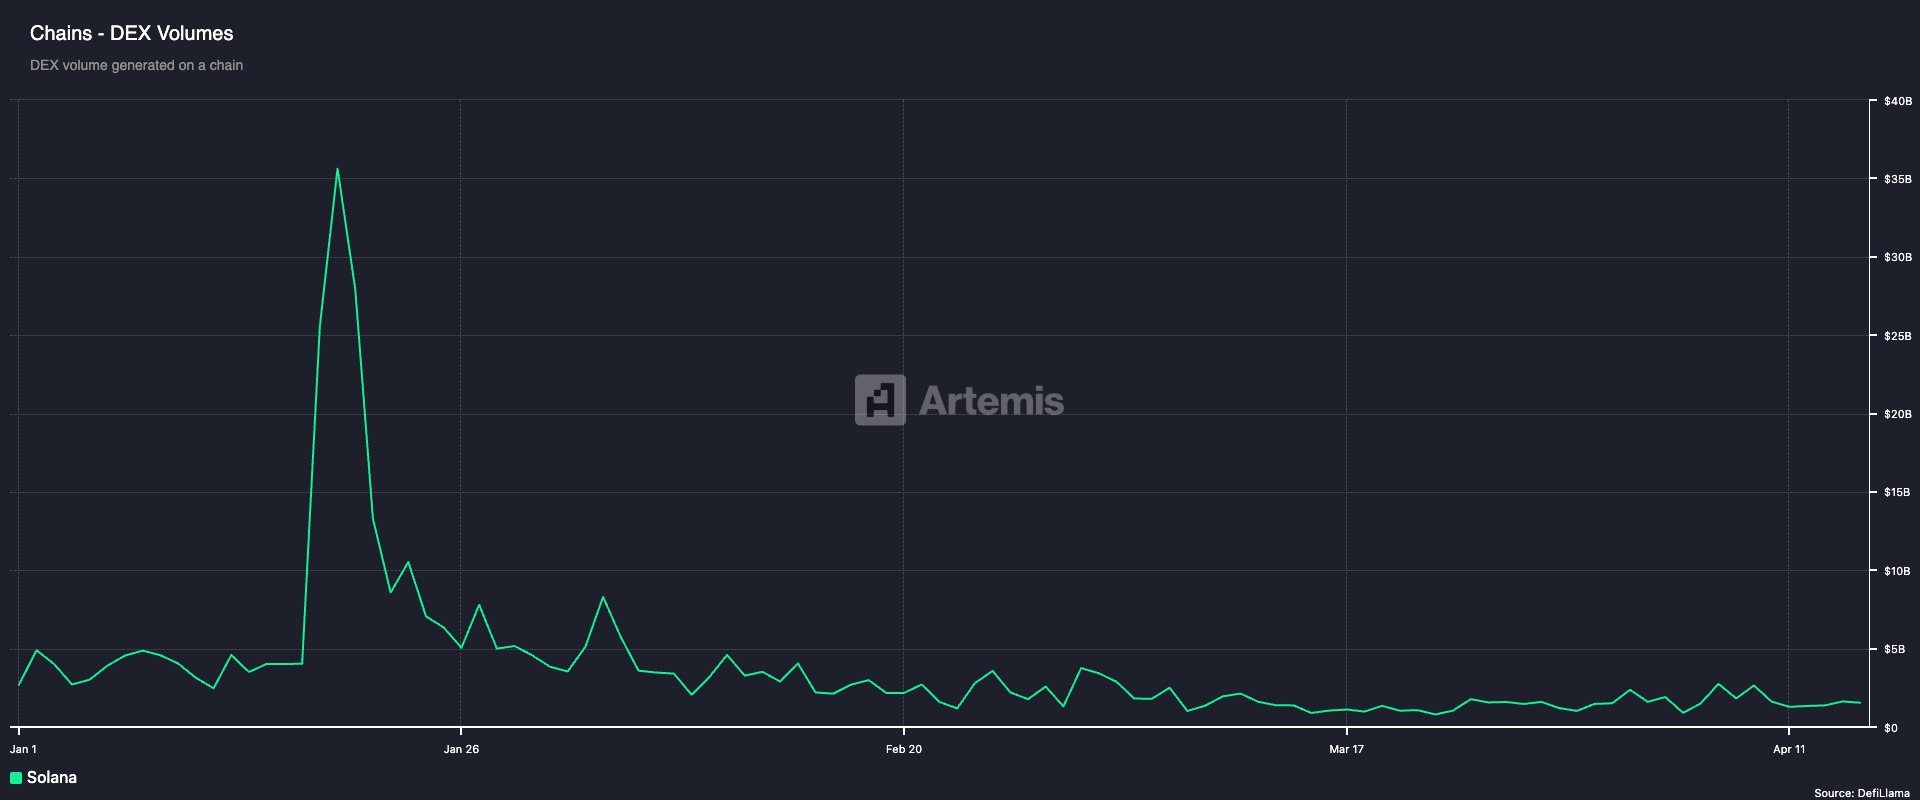
For example, SOL’s DEX volume hit an all-time high of $36 billion on January 19. But as the meme coin hype cooled off, by January 31, it had plummeted to just $3.8 billion, dropping nearly 90%. As of April 15, this totaled $1.5 billion.

Solana DEX Volume
Solana DEX Volume. Source: Artemis

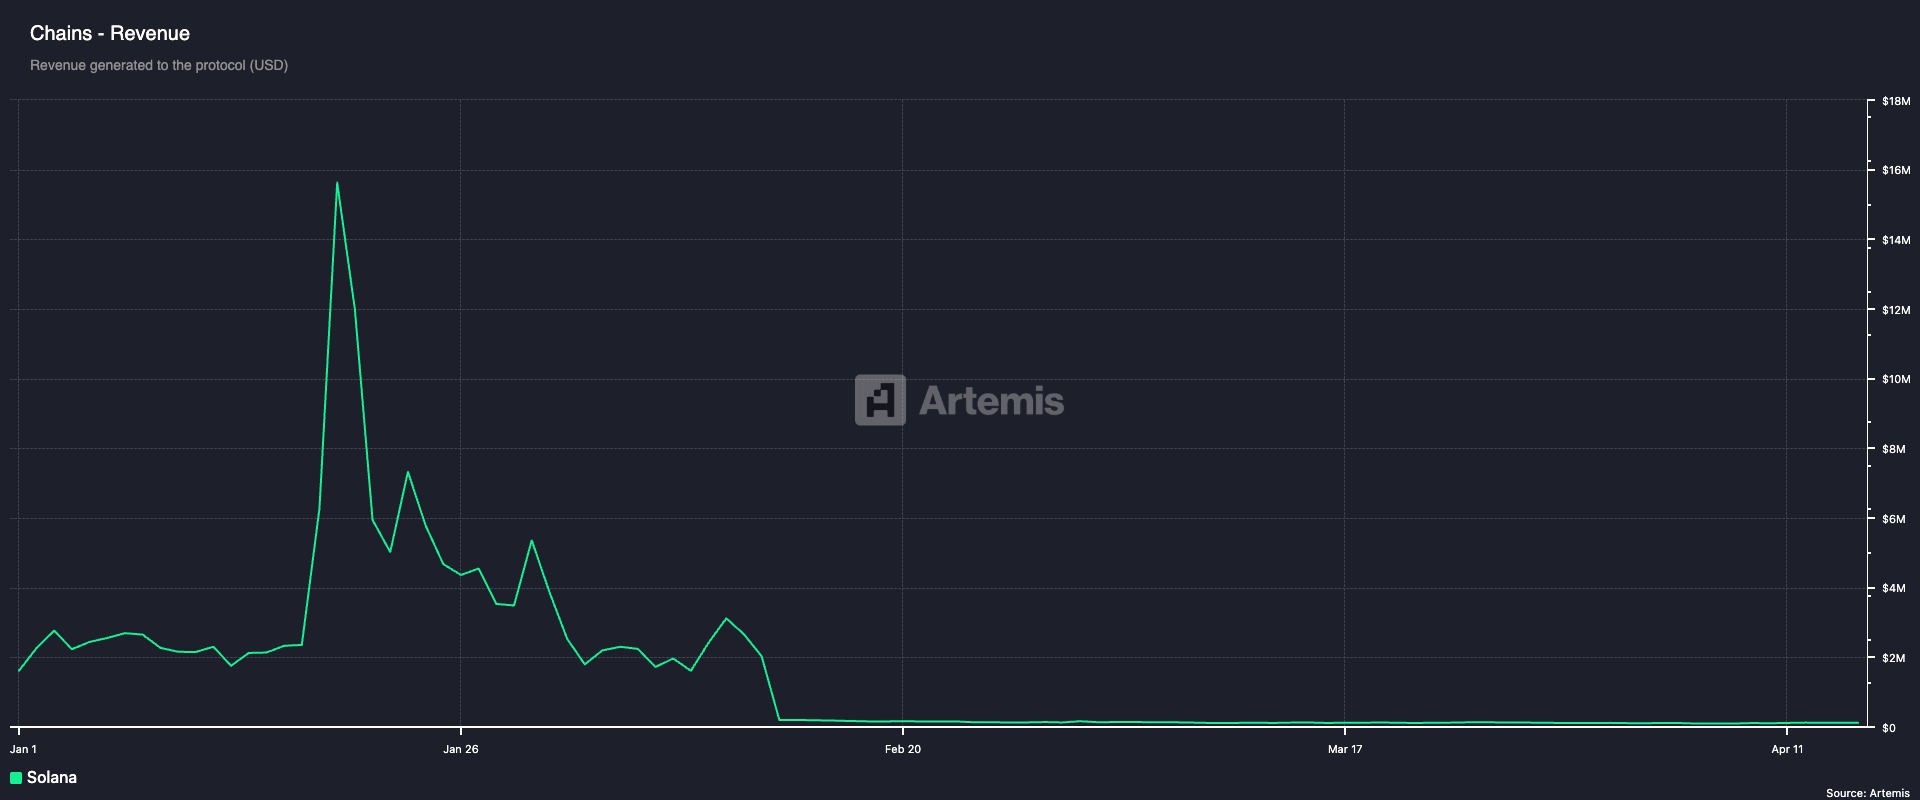
Solana’s network revenue was not spared. Daily revenue, which rose to an all-time high of $16 million on January 19, plummeted to under $5 million by the end of January. Yesterday, the network’s total revenue from all transactions completed was under $115,000. 

Solana Daily Revenue
Solana Daily Revenue. Source: Artemis

Solana Has Bigger Plans, Analyst Says

While TRUMP, MELANIA, and the slew of other meme coins that launched on Solana in the first few weeks of the year drove unprecedented network activity and boosted SOL’s value, the drop in their values and overall trading volumes has impacted the network’s performance. 

It then raises the question of whether Solana’s actual value is now tied to this highly volatile, borderline chaotic asset class.

In an exclusive interview with BeInCrypto, Binance Research spokesperson Marina Zibareva noted that while these meme assets contributed to the network’s growth at the beginning of the year, Solana’s performance remains “increasingly driven by broader ecosystem fundamentals.”

According to Zibareva:

“We’ve seen DeFi TVL grow nearly 4x in SOL terms since January, and stablecoin supply has increased over 6x – pointing to lasting interest in real utility. Developer activity is also accelerating, with smart contract deployments rising almost 6x, suggesting strong long-term potential beyond the speculative wave.”

Although Solana’s inherent features make it a go-to destination for launching meme coins via platforms like Pump.fun, Jupiter, and Meteora, Zibareva sees a future for the network that stretches beyond meme coins. 

“Meme coins have brought attention and users, but the long-term trajectory likely points toward use cases like DeFi, DePIN, Gaming, and SocialFi. Solana’s daily active addresses have increased nearly 6x year-to-date, and with its infrastructure battle-tested, we expect to see more developer activity focused on sustainable value creation,” she added. 

The post Beyond the Meme Coin Frenzy: What’s Next for Solana After the Hype? appeared first on BeInCrypto.

Russia to Consider Ruble-Pegged Stablecoin to Challenge US Dollar Dominance

A senior official from Russia’s Finance Ministry has called for the development of stablecoins linked to foreign currencies after wallets connected to Russian users and holding USDT were frozen last month.

The move comes as US-backed stablecoins dominate global liquidity and Washington moves closer to introducing new regulations for the sector. 

Russia Might Enter the Stablecoin Market

The ongoing pro-regulatory shift is drawing in new projects targeting the US market. Russia, facing growing financial restrictions, sees a digital alternative as increasingly necessary.

For Russia, this would be the perfect time to enter the stablecoin competition. Due to the US’ ongoing tariffs and worsening trade relations with China, the USD faces global pressure. Heavily tariffed countries are already considering de-dollarization.

A ruble-backed token could reduce the region’s reliance on USDT and USDC, which both track the US dollar. Such a shift would support Russia’s long-term effort to move away from dollar-based trade.

Elvira Nabiullina, head of Russia’s central bank, remains against using crypto for domestic payments. However, she confirmed that several Russian firms are testing international crypto transfers as part of a government-led trial.

Russia has explored stablecoin initiatives before. In 2023, its central bank reportedly discussed a gold-backed digital currency with Iran, intended for cross-border use and positioned as an alternative to the dollar. 

As BeInCrypto previously reported, Russian businesses are already using Bitcoin and other cryptocurrencies for international transactions.

The urgency of Russia’s stablecoin push increased after Tether blocked wallets on the Garantex exchange, freezing assets worth more than 2.5 billion rubles ($30 million). The incident occurred shortly after Garantex was hit with European Union sanctions.

At the same time, Kyrgyzstan is making moves of its own. The country has announced plans to build a crypto hub, supported by Binance founder Changpeng Zhao

A central part of the initiative is A7A5, a stablecoin tied to the ruble that aims to serve emerging markets.

The post Russia to Consider Ruble-Pegged Stablecoin to Challenge US Dollar Dominance appeared first on BeInCrypto.

Raydium’s New Token Launchpad to Compete with Pump.Fun

Raydium is releasing LaunchLab, a new token launchpad to compete with Pump.fun. The exchange announced this platform last month, and its full release has sparked community enthusiasm.

Pump.fun and Raydium have been locked in an intense competition in the Solana ecosystem. Last month, Pump.fun launched its own decentralized exchange, and now Raydium has introduced its own launchpad.

Raydium Increases Solana Dominance with new Launchpad

Raydium, Solana’s largest decentralized exchange, has the opportunity to make some serious gains in the near future. Solana meme coins are eyeing a comeback with heightened trade volumes and rising token prices, and the firm is releasing a long-awaited project.

Although it will compete with Pump.fun, Raydium’s launchpad services look more extensive. They will allow all kinds of tokens to be launched, not just meme coins, and these tokens can be directly traded on the exchange.

“Introducing LaunchLab, Raydium’s all-in-one token launchpad. Built for creators, developers, and the community. Get started with JustSendIt mode: launch a token, hit 85 SOL, [and] liquidity migrates to Raydium’s AMM INSTANTLY. Seamless, on-chain token creation. No migration fee. No gatekeepers,” the firm claimed in its launch announcement.

Pump.fun is the most popular meme coin launchpad on Solana, and its business has been intertwined with Raydium in a few ways. Since it launched Pumpswap, its own DEX, both exchanges have fueled a meme coin frenzy.

A month and a half ago, rumors that it was testing an AMM made Raydium’s RAY token drop significantly.

Last month, however, this same asset soared when Raydium first announced Launchpad. Pump.fun entered the DEX sector, and Raydium is enabling users to launch their own meme coins.

Since this launch announcement took place, RAY spiked around 10%, signifying the community’s enthusiasm.

Raydium price chart
Raydium (RAY) Daily Price Chart. Source: BeInCrypto

There may be another explanation for this token rally in addition to community hype. Raydium also mentioned that all of Launchpad’s trading fees will go towards ecosystem development.

More specifically, 25% of these fees will directly fund buybacks of RAY tokens, while the other 75% go towards a Community Pool and Program fee.

These other funds can enable a few generous user incentives. Raydium claimed that Launchpad token creators can earn up to 10% of trading fees from the AMM pool post-graduation, and users can also receive SOL tokens from referring new clients. Token creators will also enjoy several other quality-of-life features.

The post Raydium’s New Token Launchpad to Compete with Pump.Fun appeared first on BeInCrypto.

Pi Network (PI) Drops 10% as Outflows Surge and Death Cross Emerges

Pi Network (PI) is down nearly 10% in the last 24 hours, as multiple indicators point to growing bearish momentum. The DMI shows a clear shift from an uptrend to a downtrend, while CMF data confirms increasing outflows.

EMA lines are also warning of a potential death cross, which could trigger further losses. Here’s a breakdown of what the charts are signaling for PI in the near term.

Bearish Momentum Builds as PI Network’s DMI Flips to Downtrend

Pi Network’s (PI) DMI chart reveals a clear shift in momentum, with the ADX dropping from 43.68 to 39.17 over the past two days.

The ADX, or Average Directional Index, measures the strength of a trend, with values above 25 generally indicating a strong trend.

Although the current reading still suggests solid momentum, the recent decline in ADX combined with the trend reversal from uptrend to downtrend signals that bullish strength is fading and bearish pressure is taking control.

PI DMI.
PI DMI. Source: TradingView.

Supporting this shift, the +DI (Directional Indicator) has dropped sharply from 22.11 to 13.29, while the -DI has surged from 11.32 to 30.95.

The +DI represents bullish strength, and the -DI represents bearish strength—so this crossover and widening gap confirm that sellers are now in control. This setup typically points to continued downside, especially if the -DI remains dominant and the ADX stabilizes or rises again, signaling a strengthening bearish trend.

Unless there’s a sharp reversal in these indicators, PI could remain under pressure in the near term.

Selling Pressure Intensifies as Outflows Accelerate on PI Network

Pi Network’s Chaikin Money Flow (CMF) has dropped sharply to -0.13, down from 0.07 just a day ago. The CMF is a volume-based indicator that measures the flow of money in and out of an asset over a set period.

It ranges from -1 to +1, with positive values indicating buying pressure and negative values suggesting selling pressure.

A sudden shift from positive to negative typically signals a change in sentiment and potential weakness ahead.

PI CMF. Source: TradingView.

With the CMF now at -0.13, it suggests that outflows are picking up and sellers are becoming more active.

This kind of drop often reflects reduced demand and a lack of confidence from buyers, especially if it comes alongside declining prices or weakening momentum indicators.

If the CMF remains in negative territory, it could point to sustained bearish pressure and a risk of further downside for PI unless strong inflows return soon.

Will PI Fall Below $0.50?

Pi Network’s EMA lines are signaling a potential death cross, where the short-term moving average crosses below the long-term moving average.

This is typically seen as a bearish sign, often preceding further downside. If confirmed, it could lead PI to retest the support level at $0.54.

A break below that level may open the door for a move under $0.50, especially if overall momentum continues to weaken, as analysts warn about Pi Network transparency after Mantra’s OM token collapse.

PI Price Analysis.
PI Price Analysis. Source: TradingView.

However, if the trend reverses and buyers step back in, PI price could regain strength and push toward the resistance at $0.66.

A breakout above that level would be an early sign of renewed bullish momentum.

If that move holds and gains traction, the next key target would be $0.789, which could be a major test of the strength of the recovery.

The post Pi Network (PI) Drops 10% as Outflows Surge and Death Cross Emerges appeared first on BeInCrypto.

Shiba Inu Daily Volume Hits $224 Billion: Here’s What We Know

Shiba Inu Daily Volume Hits $224 Billion: Here’s What We Know

Shiba Inu (SHIB) has seen a massive spike in daily volume, reaching a total of 224 billion SHIB within 24 hours. This surge has attracted attention due to its connection with a significant rise in whale activity. The increase in large holder inflows and the overall transaction volume suggests a potential shift in market sentiment.

Surge in Shiba Inu Whale Activity

Data from IntoTheBlock shows a notable increase in large-holder inflows, which jumped from 96 billion SHIB on April 13 to 224.34 billion SHIB on April 14. Large holder inflows generally refer to transfers of tokens into wallets that belong to entities holding significant portions of the token’s total supply. A rise in these transactions often indicates accumulation, suggesting that whales may be preparing for a price movement.

Article image

This influx of SHIB tokens into large wallets coincided with a 173% surge in large transaction volume. According to the same data, SHIB saw approximately 1.31 trillion SHIB being transacted in large volumes, worth around $15.66 million.

This type of activity is often considered a signal of renewed interest from large investors or whales, who may be positioning themselves ahead of potential price changes. However, the overall trend in SHIB’s price remains uncertain, with the coin experiencing a slight decline in recent hours.

Large Transactions and Market Sentiment

The 173% increase in large transactions indicates that whale traders are actively moving SHIB, which could indicate a shift in market sentiment. These large transactions typically involve trades of $100,000 or more. When such trades increase, it often suggests that investors are rearranging their portfolios, possibly in anticipation of a future rally.

Despite the surge in large transactions, Shiba Inu’s price has not shown consistent growth. As of the latest data, SHIB’s price was down 2.75% in the last 24 hours, trading at approximately $0.00001192.

The fluctuation in SHIB’s price has led to some concern among investors, with many uncertain about the next market direction. The total trading volume has also dropped by 17.73% in the past 24 hours, indicating decreased investor interest following the recent volatility.

Shiba Inu’s Ecosystem and Recent Developments

One factor contributing to SHIB’s price movement is the ongoing developments within its ecosystem. Shiba Inu recently revealed details about its Karma system, which is designed to track user engagement across its network.

The Karma system operates similarly to an experience point (XP) system found in gaming. It allows users to earn Karma points based on their activity within the Shiba Inu ecosystem, contributing to their reputation.

According to Shiba Inu developer Kaal Dhairya, the Karma system is still in its beta phase and will continue to evolve. The introduction of features like this could help increase user interaction within the ecosystem, potentially influencing the demand for SHIB tokens in the long run.

Shiba Inu Price Analysis: Is a Bull Rally Looming?

Despite significant whale activity and ecosystem developments, SHIB’s price has been in a downtrend. It struggled to maintain momentum after rejecting resistance at $0.00001200 and remains under a descending trendline.

The current support level is around $0.00001160, and if SHIB holds at this level, a potential bullish reversal backed by the rising SHIB burn rate could occur.

SHIBUSD price chart (source: TradingView)

However, further downside risk remains possible if the price fails to maintain this support zone. According to the trading view, the next major resistance level for SHIB is $0.00001200, with a potential target of $0.00004 if the price breaks above this resistance.

The post Shiba Inu Daily Volume Hits $224 Billion: Here’s What We Know appeared first on CoinGape.

Ethereum Price Forecast: Will ETH hit $1,100 as ETH/BTC pair nears All-Time Lows?

Analyst Predicts "Most Hated Rally" For Ethereum Price Even as ETH Market Share Slips

Ethereum price plunges below $1,600 on Tuesday, with ETH conceding more ground to BTC amid multi-chain expansion and rising macro pressure. With ETH price at risk of a potential slide to multi-year lows, here are key levels traders must watch in the days ahead.

Ethereum (ETH) faces intense sell-offs a week after Trump repeals DeFi law 

Ethereum (ETH) is facing increasing headwinds as its market share among Layer-1 chains continues to erode, now approaching historic lows last seen during the 2021 altcoin supercycle. 

Ethereum is facing bearish headwinds this week as competition among Layer-1 chains continues to erode, ETH market share. While Ethereum price is holding above the $1,590 level at press time, key trading signals suggest ETH could be at risk of plunging towards  historic lows last seen during the 2021 altcoin supercycle.

Ethereum price action | Source: Coingecko

ETH’s latest sell-off intensifies just one week after former President Donald Trump repealed a Biden-approved law, mandating DeFi platforms to adhere to stringent KYC measures required of registered brokers.

Interestingly, the abrupt rollback—aimed at curbing what Trump called “bureaucratic overreach”—has instead spooked capital, accelerating outflows from Ethereum-based protocols.

With rising competition from faster, cheaper alternatives like Solana, Avalanche, and Base, Ethereum’s share of total value locked (TVL) and network activity has declined to under 55%, down from over 70% at its peak. 

Ethereum TVL plunges $12B as ecosystem demand weakens

Despite the successful rollout of Ethereum’s Dencun upgrade in March 2025, on-chain activity has remained tepid. Gas fees have stabilized at lower levels, but that has not translated into renewed demand. Daily active addresses and transaction counts are plateauing, while Ethereum L2s like Arbitrum and Optimism have absorbed increasing volume, inadvertently siphoning activity away from the base layer. 

Ethereum DeFi TVL dips from $58B to $46B between March 2 to April 16, 2025 | Source: DeFiLlama

Meanwhile, capital rotation into Solana and emerging EVM-compatible ecosystems has led to a fragmentation of liquidity, diluting Ethereum’s dominance in both DeFi and NFT verticals.

According to DeFillama data, investors have withdrawn over $12 billion from Ethereum DeFi protocols since the start of March 2025. 

ETH/BTC Pair Paint a Grim Picture

Ethereum’s underperformance is further highlighted in its ETH/BTC trading pair, which has now declined below the 0.02 level, a psychological threshold watched closely by strategic investors. 

ETH/BTC trading pair | April 2025 | Source: TradingView

The continued strength of Bitcoin’s dominance—now hovering above 54%—suggests capital is rotating out of altcoins and into more defensive majors as positive headwinds from US inflation data subsides. 

With the SEC yet to provide a regulatory model from Ethereum’s staking model, spot ETH ETF continue to face rapid outflows, as sentiment around ETH remains fragile. While US inflation eased macro pressures, investors remain jittery anticipating the impact of the US-China trade war on stock prices.

Ethereum Price Forecast: Bull counting on $1380 support

As Ethereum’s market share relative to Bitcoin near all-time lows and bullish sentiment weakens,technical indicators reveal key support levels to watch in the days ahead. 

Ethereum long-term price forecast prospects remain strong due to its global developer network and media dominance, short- to medium-term price action suggests vulnerability. Unless ETH can reclaim the $2,200 level with strong volume and improve on-chain fundamentals, the downside target near $1,100 may become an increasingly realistic scenario.

Ethereum price forecast

Hovering around $1,642, ETH price is trading at 31% discount from March highs, with a potential drop to $1,100 flagged by the measured move of a bear flag breakdown. However, the RSI at 42.45 suggests ETH is near oversold territory, hinting at possible short-term support near $1,385. While the 50-, 100-, and 200-day SMAs remain in a clear bearish alignment, the current consolidation pattern shows ETH trying to stabilize.

In this scenario, a bullish Ethereum price forecast would require a breakout above $1,730. Conversely, failure to hold $1,597 risks confirming the $1,100 downside target.

The post Ethereum Price Forecast: Will ETH hit $1,100 as ETH/BTC pair nears All-Time Lows? appeared first on CoinGape.

Bitcoin Price Predicted to Hit $90K as Saylor Buys $285M Despite $6B Losses on Q1 BTC Purchase

Here's What Would Happen to Strategy's $44B BTC if Bitcoin Price Crashes Below $67K

Bitcoin price consolidates above $83,500 on Tuesday as MicroStrategy doubles down on BTC after a lull performance in Q1 2025. With   institutional confidence as analysts forecast a parabolic BTC rally toward $90,000.

Saylor’s announces another $285M Bitcoin purchase after reporting losses for Q1 2025 

Strategy (Formerly MicroStrategy) founder and executive chairman Michael Saylor has once again reinforced commitment to the infamous Bitcoin strategy this week. Despite lackluster market performance so far in 2025, Saylor announced the purchase of an additional $285 million worth of BTC on Monday.

Notably, the latest purchase comes a week after firm’s reported a staggering $6 billion on its Bitcoin purchases in Q1 2025.

Strategy (Formerly Microstrategy) Total Bitcoin Holdings | Source: SaylorTracker.com

According to data from SaylorTracker, the firm spent $7.6 billion on BTC purchases since the start of the year, with unrealized loss reaching $6 billion as BTC price plunged below $80,000 last week, under pressure from US trade war.

As seen in the chart above, the latest buy brings MicroStrategy’s acquired 3,459 BTC for an approximate price of $285.5 million on Monday. This brings the firm’s total BTC holdings above 531,664 at press time valued at a $44 billion. Despite the short-term losses in Q1, the firm is posting $8.4 billion gains on its total holdings, reflecting 24% profit.

This aggressive accumulation comes at a pivotal moment for Bitcoin, which is currently consolidating near the $83,000 mark following a high of nearly $85,000 when hawkish US CPI reports sparked a brief buying frenzy last week.

Bitcoin Price Forecast: BTC Eyes $87,000 as MACD Momentum Turns Positive

Bitcoin price forecast suggests bullish continuation toward $87,000 after reclaiming short-term control above the mid-Bollinger Band ($82,505). BTC is trading near $83,855, finding support above this midline, signaling increasing upward pressure. The Bollinger Bands have slightly constricted, indicating a potential breakout.

BTC price hovering above the median line of the bands implies bullish dominance in the short term, especially with the upper band around $87,142 acting as the next major resistance.

Bitcoin Price Forecast

On the MACD, the blue signal line has crossed decisively above the orange baseline, and histogram bars remain positive and rising. This bullish crossover and growing momentum suggest upward acceleration. Should bulls clear $85,000 convincingly, Bitcoin could surge to test the $87,000 resistance.

Conversely, a close below the $82,500 level could reintroduce bearish momentum, exposing BTC to the lower band support at $77,867. However, the current structure leans bullish with momentum favoring higher highs.

The post Bitcoin Price Predicted to Hit $90K as Saylor Buys $285M Despite $6B Losses on Q1 BTC Purchase appeared first on CoinGape.

Semler Scientific Files To Buy $500M in Bitcoin Amid $30M DOJ Settlement

Semler Scientific Files To Buy $500M in Bitcoin Amid $30M DOJ Settlement

Semler Scientific has filed with the U.S. Securities and Exchange Commission (SEC) to issue $500 million in securities. This move follows the company’s announcement of a $30 million settlement with the Department of Justice (DOJ). The funds raised are expected to be used for various corporate purposes, including acquiring more Bitcoin.

Semler Scientific Settlement with DOJ

Semler Scientific has reached a tentative agreement with the DOJ, agreeing to pay $29.75 million to settle claims related to marketing its flagship product, QuantaFlo. The settlement addresses accusations of potential violations of federal anti-fraud laws.

While the DOJ’s investigation started in 2017, it was only in recent months that Semler entered discussions to resolve the matter. The company stated that it has complied with several subpoenas over the years, which led to the current settlement negotiations.

In its Tuesday filing with the U.S. Securities and Exchange Commission (SEC), Semler disclosed that the settlement agreement is not final yet. If the agreement is approved, the company plans to use a loan from Coinbase, secured by its Bitcoin holdings, to fund the $30 million payment. Semler’s current Bitcoin holdings amount to 3,192 BTC, valued at approximately $267 million today.

Bitcoin as Collateral for Loan from Coinbase

To finance the settlement, Semler Scientific has partnered with Coinbase, one of the largest cryptocurrency exchange.

According to the terms of the contract, the firm will receive a cash and digital asset loan from it, backed by its BTC balance.

The crypto-based loan from Coinbase will ensure Semler has adequate balance to facilitate settlement without straining its balance in other aspects of its operations.

Plans for Further BTC Purchases

Not limiting itself to the $30 million DOJ settlement, Semler Scientific has hinted at intent to purchase more Bitcoin. To issue new securities, the company has submitted an S-3 for registration with the SEC in an effort to offer $500 million in securities.

The funds raised from this selling will increase the company’s Bitcoin holdings, which it has outlined as a plan to diversify cryptocurrency.

Semler’s intentions of acquiring more Bitcoin come simultaneously with those of other firms, such as Michael Saylor’s Strategy, which also accumulates the cryptocurrency. Just recently, Strategy bought 3,459 bitcoins for $285.8 million, and thus, it is now holding 531,644 bitcoins.

Similarly, Metaplanet has bought $26.3m worth of Bitcoins, demonstrating that the firm remains bullish in this market volatility. These purchases come in light of a potential reversal in the Bitcoin price that some analysts, such as the Titan of Crypto, have estimated to hit $137,000.

The post Semler Scientific Files To Buy $500M in Bitcoin Amid $30M DOJ Settlement appeared first on CoinGape.

Starknet (STRK) Eyes Recovery With Improving Indicators

Starknet (STRK) remains under pressure, but signs of stabilization are beginning to emerge. Despite releasing 127.6 million tokens into circulation in its next unlock, the project is pushing forward with adoption efforts, including enabling STRK payments in 15,000 shops worldwide.

Technically, the RSI is in neutral territory, and the CMF is showing reduced selling pressure, hinting at a potential shift in momentum. However, the EMA lines still reflect a downtrend, keeping the outlook cautious for now.

Starknet RSI Is Still Neutral

Starknet was one of the most anticipated token unlocks of the third week of April, releasing 127.6 million STRK tokens worth approximately $15.71 million into circulation.

Despite this major supply event, the project is trying to build long-term utility.

Recently, it announced that STRK can now be used for payments in 15,000 shops worldwide—a move aimed at boosting adoption and real-world use cases.

STRK RSI.
STRK RSI. Source: TradingView.

From a technical perspective, STRK’s RSI is currently at 42.92, recovering from 37.29 yesterday but slightly down from 44.76 earlier today.

The Relative Strength Index (RSI) measures momentum on a scale from 0 to 100, with readings above 70 typically indicating overbought conditions and below 30 signaling oversold territory.

An RSI around 43 suggests neutral-to-bearish momentum, with sellers still maintaining some control. If RSI continues to climb, it could signal a shift toward a recovery, but for now, STRK remains in a cautious zone.

STRK CMF Shows Buyers Are Returning

StarkNet’s Chaikin Money Flow (CMF) has improved to -0.10, up from -0.32 yesterday, signaling a reduction in selling pressure.

The CMF is a volume-based indicator that measures the flow of money into or out of an asset over time. It ranges from -1 to +1, with values above 0 indicating buying (accumulation) and below 0 indicating selling (distribution).

STRK CMF.
STRK CMF. Source: TradingView.

Although still in negative territory, the rise toward the neutral line suggests that bearish momentum is weakening. A CMF reading of -0.10 points to moderate outflows, but the upward shift could hint at growing interest from buyers.

If this trend continues and CMF crosses into positive territory, it may support a short-term recovery in STRK’s price.

Will Starknet Fall Below $0.11?

Starknet’s EMA lines continue to reflect a downtrend, with short-term averages positioned below long-term ones—a classic bearish setup.

If this pattern holds and selling pressure increases, STRK could decline further to test the support level near $0.109.

STRK Price Analysis.
STRK Price Analysis. Source: TradingView.

However, if momentum shifts and STRK manages to reverse the current trend, it could begin retesting key resistance levels at $0.137 and $0.142.

A breakout above these zones may open the path toward $0.158, signaling a stronger recovery.

The post Starknet (STRK) Eyes Recovery With Improving Indicators appeared first on BeInCrypto.

Solana (SOL) Jumps 20% In a Week With DEX Volume and Protocol Fees Soaring

Solana (SOL) is up 20% over the past seven days, supported by strong technical indicators and rising on-chain activity. Its Ichimoku Cloud and BBTrend charts both point to bullish momentum, with trend strength and volatility on the rise.

At the same time, Solana is reclaiming the top spot in DEX volume and dominating protocol fee rankings across major DeFi apps. With a recent golden cross on the EMA lines, SOL now looks set to test key resistance levels if momentum holds.

Solana Indicators Paint A Bullish Picture

Solana Ichimoku Cloud chart shows a clear bullish structure, with price trading above both the Tenkan-sen and Kijun-sen. This alignment indicates strong short- and medium-term momentum, with buyers maintaining control.

The Kumo ahead is green and steadily expanding, which supports the continuation of the current uptrend. The distance between the price and the cloud also gives the trend some room before any potential weakness sets in.

SOL Ichimoku Cloud.
SOL Ichimoku Cloud. Source: TradingView.

The Chikou Span is positioned above the cloud and candles, confirming bullish confirmation from past price action. As long as Solana stays above the Kijun-sen and the cloud remains supportive, the trend bias remains upward.

Solana’s BBTrend is currently at 16.89, showing a strong increase from 1.88 two days ago, though slightly down from 17.54 yesterday. This sharp rise indicates that volatility and trend strength have recently expanded significantly.

SOL BBTrend.
SOL BBTrend. Source: TradingView.

The BBTrend, or Bollinger Band Trend indicator, measures the strength of a trend based on how far price moves away from its average range. Readings above 10 generally signal a strong trend in motion, while lower values reflect a range-bound or weak market.

With SOL’s BBTrend holding near elevated levels, it suggests the asset is still in a strong trending phase. If it remains high or rises again, it could support further upward movement—but a steady decline might hint at a slowing trend or consolidation ahead.

SOL Volumes and Apps Are On The Rise

Solana is firmly reestablishing its dominance in the decentralized exchange (DEX) space, pulling ahead of Ethereum and BNB in daily volume.

Over the past 24 hours, Solana recorded $2.5 billion in DEX activity, marking a 14% increase over the last seven days. That growth outpaces Base’s 10% and contrasts sharply with the declines seen on Ethereum (-3%) and BNB (-9%).

DEX Volume by Chain.
DEX Volume by Chain. Source: DeFiLlama.

More impressively, Solana’s seven-day DEX volume has surpassed the combined volume of Base, BNB, and Arbitrum.

Protocols and Chains Fees.
Protocols and Chains Fees. Source: DeFiLlama.

Beyond trading volume, Solana is also leading in protocol revenue generation. Among the top eight non-stablecoin protocols ranked by fees, five are directly built on Solana: Pump, Axiom, Jupiter, Jito, and Meteora.

Pump stands out in particular, generating $2.73 million in fees in just the past 24 hours and $15 million across the past week.

Can Solana Break Above $150 In The Next Weeks?

Solana’s EMA lines recently formed a golden cross, a bullish signal that often marks the start of a new uptrend.

This crossover suggests momentum is shifting in favor of buyers, with the potential for Solana price to soon test key resistance levels.

SOL Price Analysis.
SOL Price Analysis. Source: TradingView.

If the current trend holds, Solana could challenge resistance around the $136 zone. A breakout there may open the path toward higher levels such as $147, $160, and even $180 if bullish pressure intensifies.

However, if momentum fades, Solana may face a pullback toward the $124 support zone. A break below that could trigger deeper downside moves, potentially revisiting $112 or even $95 if selling pressure accelerates.

The post Solana (SOL) Jumps 20% In a Week With DEX Volume and Protocol Fees Soaring appeared first on BeInCrypto.