Memecoins Break Out as Bitcoin Surges—Should You be Optimistic on Fartcoin, Pepe & FLOKI?

The post Memecoins Break Out as Bitcoin Surges—Should You be Optimistic on Fartcoin, Pepe & FLOKI? appeared first on Coinpedia Fintech News

The market sentiments, specifically with the memecoins, have been witnessing quick shifts, following the BTC price rally. Moreover, they attract more bullish and bearish activity compared to Bitcoin, keeping the next price action shady. Currently, the popular memecoins like Pepe, Fartcoin, FLOKI, etc., and a few more have been demonstrating significant strength. But the question remains whether the rise is short-lived.

Fartcoin (FARTCOIN) Price Analysis

  • The FARTCOIN price is undergoing a parabolic recovery since the start of March but has been failing to surpass the crucial resistance at $0.98 since the start of the month
  • The volume has dropped significantly which has drag the volatility lower, preventing the price from rising above the pivotal resistance
  • The MACD was about to undergo a bearish crossover but the MACD line is trying hard to rise above the Signal line, as the bulls regain strength
  • On the other hand, the +Di & -Di have diverged, which were heading for a bearish crossover, flashing bullish possibilities
  • The technicals are turning bullish but as long as the volume remains drained, the FARTCOIN price may continue to consolidate around $0.9.

Pepe (PEPE) Price Analysis

  • The PEPE price has rebounded from the local bottoms for the second consecutive time, forming a double-bottom pattern
  • Despite a drop in the volume, the buyers remain dominant, keeping the bullish possibilities alive
  • The RSI is approaching the crucial barrier and may even surpass for the first time this year, which is believed to elevate the levels above the bearish range
  • On the other hand, the MACD, which is bullish is about to rise into the positive range, substantiating the bullish claim
  • Therefore, the PEPE price is believed to keep rising and reach the crucial resistance zone between $0.00000878 and $0.0000090. A breakout out from here may pave way for the token to squash a zero from it’s value

FLOKI Price Analysis

  • The FLOKI price had dropped below the descending parallel channel and had formed another parallel channel; however, the recent rise has elevated the levels within the upper channel
  • The Bollinger bands have begun to go parallel, suggesting a drop in the volatility, which may result in a squeeze and, in turn, a bullish breakout
  • Meanwhile, the RSI is rising and is trying to surpass the average zone, which could push the price close to the resistance at $0.0000068
  • Therefore, the FLOKI price appears to be self-assured of maintaining a strong ascending trend and reaching $0.00001 soon

The post Memecoins Break Out as Bitcoin Surges—Should You be Optimistic on Fartcoin, Pepe & FLOKI? appeared first on Coinpedia Fintech News
The market sentiments, specifically with the memecoins, have been witnessing quick shifts, following the BTC price rally. Moreover, they attract more bullish and bearish activity compared to Bitcoin, keeping the next price action shady. Currently, the popular memecoins like Pepe, Fartcoin, FLOKI, etc., and a few more have been demonstrating significant strength. But the question …

Bitcoin Whales Buy $4.7 Billion BTC in A Month; Price Rises To $87,400

Bitcoin’s price recently hit a monthly high, surpassing $87,000 and marking a notable rise for the crypto king. This rally is attributed to favorable macroeconomic conditions and the increased conviction of key investors. 

Despite this growth, long-term holders’ profits have dropped to a two-year low, signaling a more cautious outlook among certain market participants.

Bitcoin Whales Remain Bullish

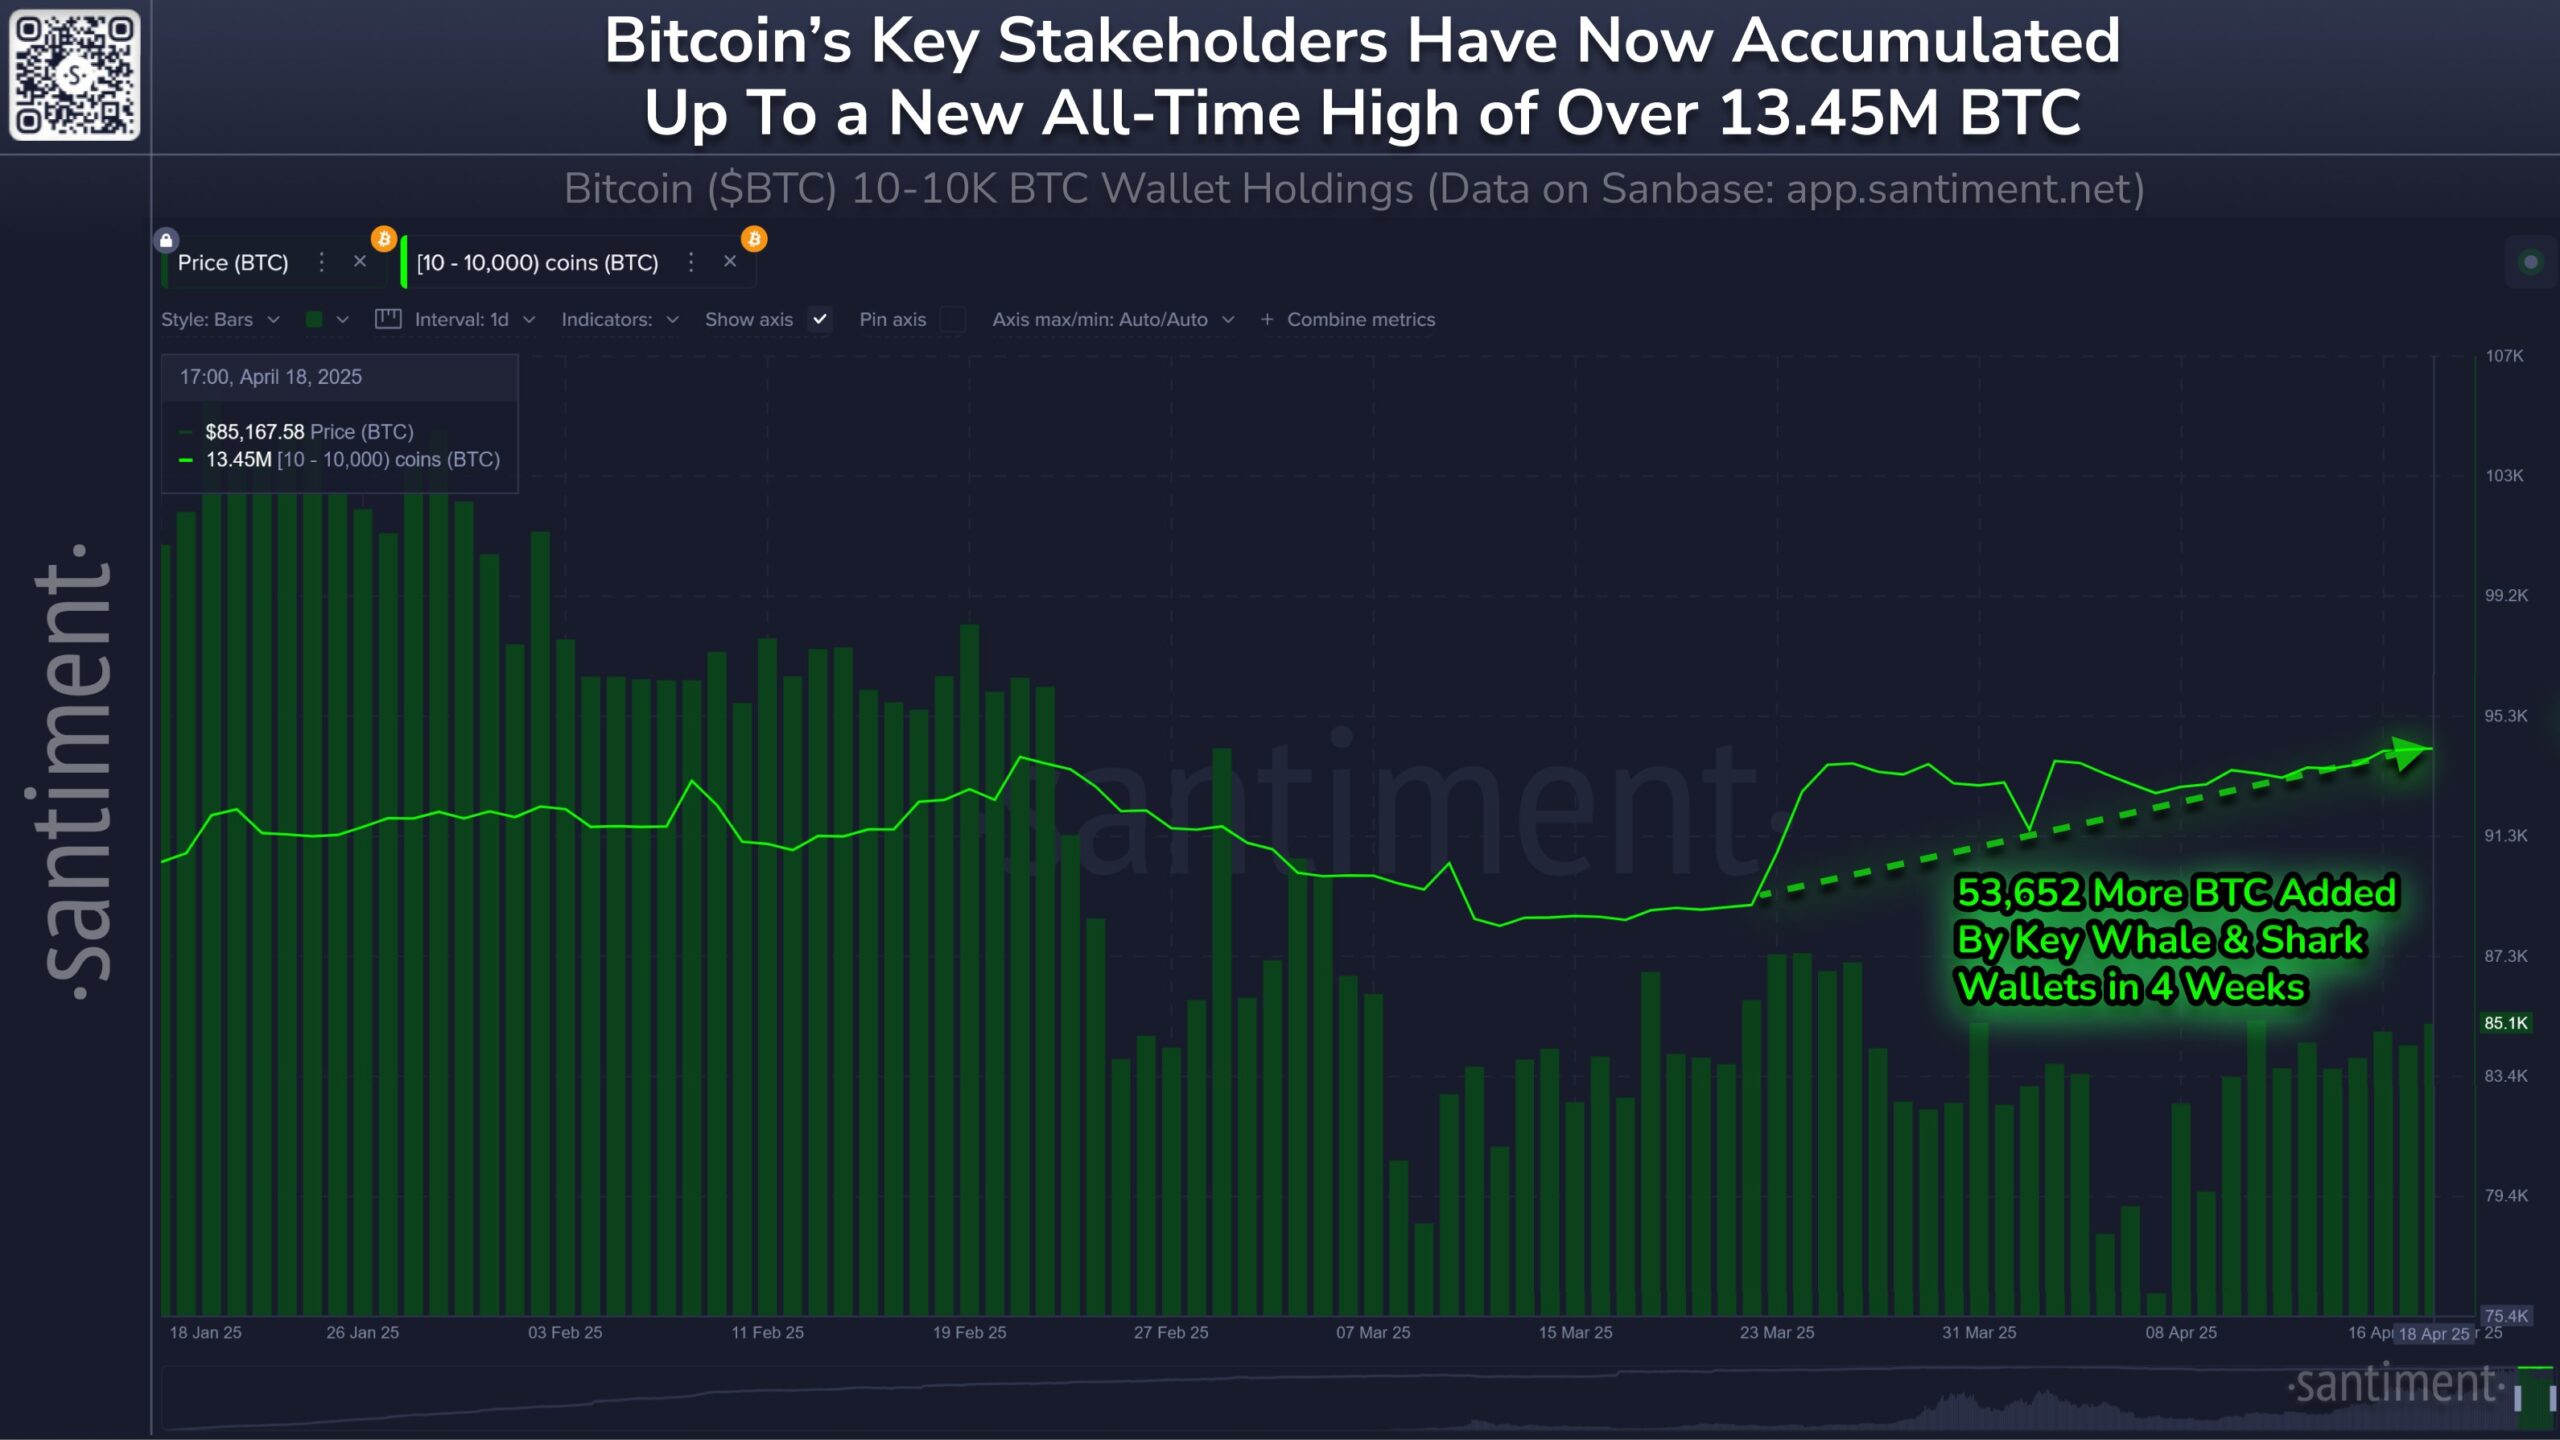
Whale and shark addresses, which hold between 10 and 10,000 BTC, have been actively accumulating Bitcoin at lower price levels. Over the past month, these addresses have purchased approximately 53,652 BTC, worth nearly $4.7 billion. This buying spree indicates that large investors are taking advantage of Bitcoin’s recent dip, believing in the asset’s long-term potential. 

The accumulation by these large investors highlights confidence in Bitcoin’s growth. While some market participants might have been uncertain during Bitcoin’s recent price fluctuations, these major holders appear to be positioning themselves for future gains.

Bitcoin Whale and Shark Holding
Bitcoin Whale and Shark Holding. Source: Santiment

The MVRV Long/Short Difference indicator, which tracks the difference between short-term holders (STHs) and long-term holders (LTHs) in terms of realized profits, is currently at a two-year low. This indicates that STHs are dominating the market, which reflects the whale accumulation. However, the dominance of short-term holders in profits often signals that the market is ripe for selling, which could result in downward pressure on Bitcoin’s price.

With the MVRV indicator flipping below the zero line, there’s a risk that Bitcoin’s price could be negatively impacted if STHs decide to cash out. While whales continue to accumulate, the growing influence of STHs could lead to increased volatility, especially if the market sentiment shifts.

Bitcoin MVRV Long/Short Difference
Bitcoin MVRV Long/Short Difference. Source: Santiment

BTC Price Aims At $90,000

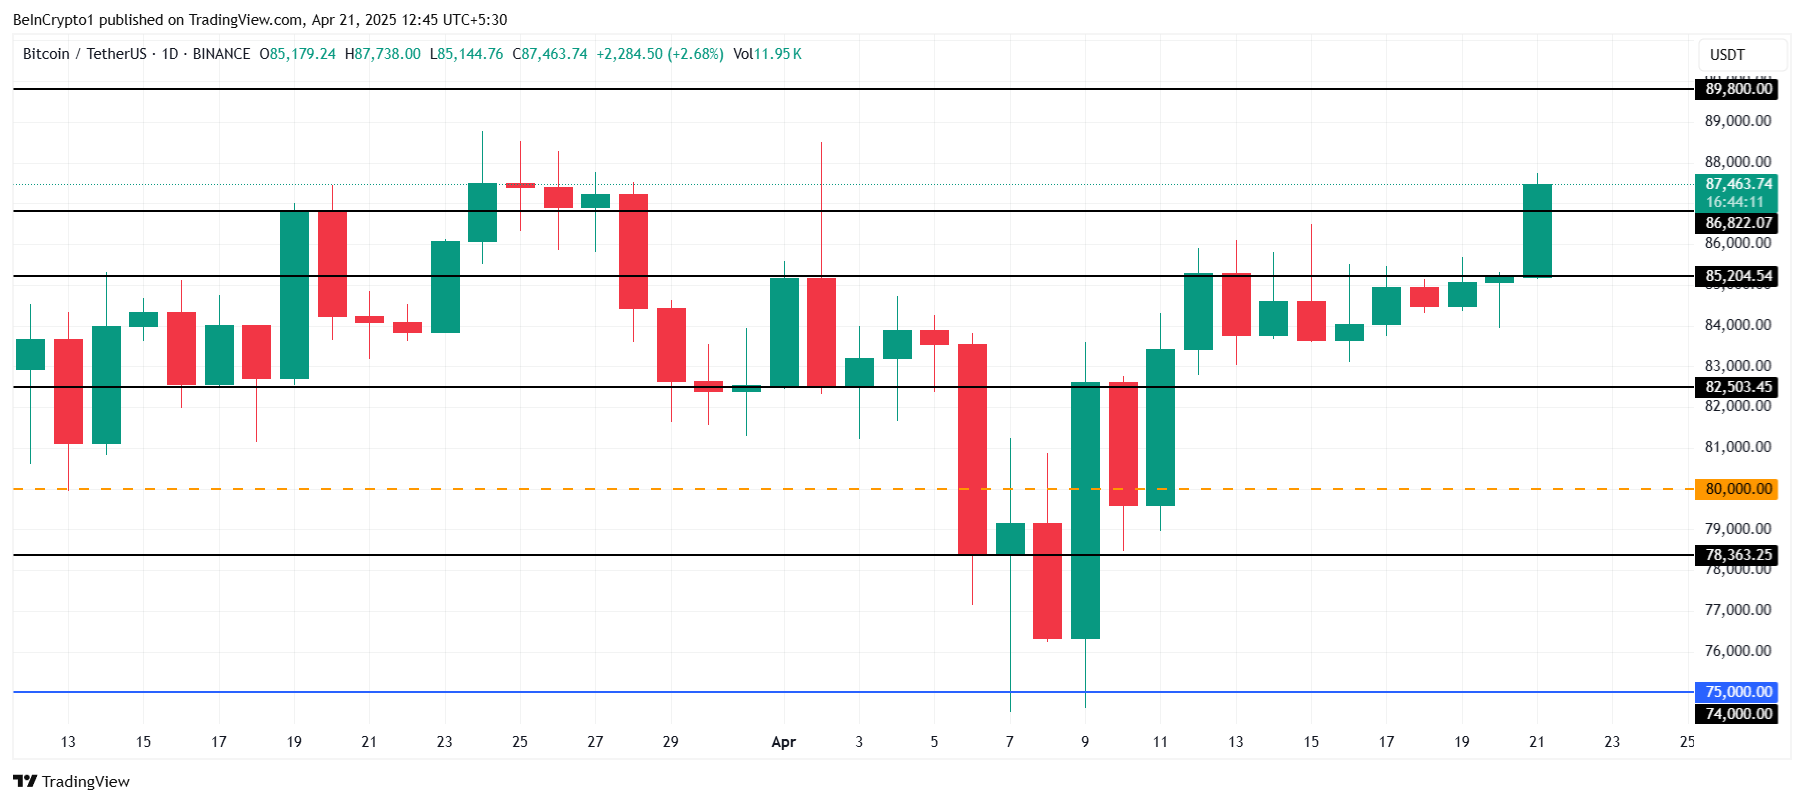
Bitcoin is currently trading at $87,463, holding above the crucial support level of $86,822. The last time Bitcoin failed to secure this support, the price fell significantly. However, if Bitcoin can maintain support at $86,822, it could move toward the next resistance level at $89,800.

Breaking through the $90,000 mark is a key milestone for Bitcoin. If Bitcoin can reclaim $90,000 as support, it will likely continue its upward trend. This psychological level is crucial for bolstering investor confidence, which would drive further price increases.

Bitcoin Price Analysis.
Bitcoin Price Analysis. Source: TradingView

On the downside, if Bitcoin faces bearish momentum, it could struggle to hold support at $86,822. A drop through this level would likely lead to a further decline, with the next support level at $85,204. If this fails, Bitcoin could slide to $82,503, erasing a significant portion of the recent gains.

The post Bitcoin Whales Buy $4.7 Billion BTC in A Month; Price Rises To $87,400 appeared first on BeInCrypto.

Decentraland (MANA) Hits Two-Month High Amid Bullish Momentum

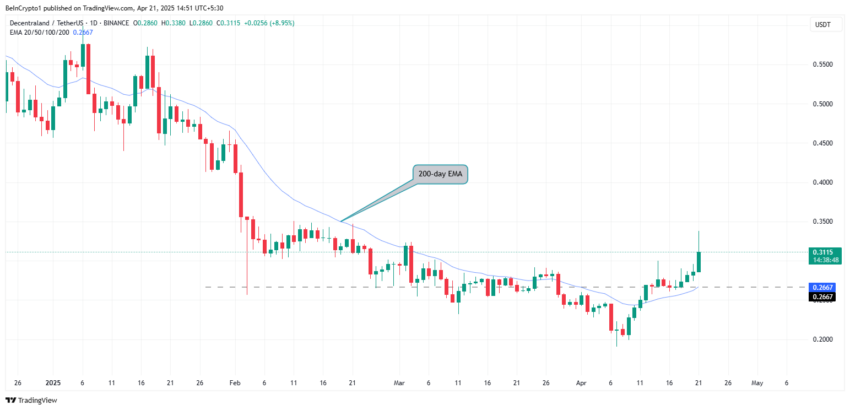
Metaverse-based token Decentraland (MANA) is today’s top-performing asset. The altcoin’s value has soared over 10% in the past 24 hours, pushing it to a two-month high of $0.31 at press time. 

With technical indicators pointing at renewed investor interest and a strong bullish trend, MANA price may be poised to extend its rally in the short term.

MANA Price Rally Supported By Demand

An assessment of the MANA/USD one-day chart reveals a steady uptick in the token’s on-balance volume (OBV), reflecting the rise in its demand. This momentum indicator is at 9.47 billion at press time, its highest level since December 2024. 

MANA OBV.
MANA OBV. Source: TradingView

The OBV indicator measures an asset’s buying and selling pressure. It adds volume on up days and subtracts it on down days. This dynamic helps traders determine whether volume supports the price trend at any given moment. 

As observed with MANA, an asset’s OBV rising alongside its price signals strong buying interest. This effectively confirms the sustainability of a bullish move. The trend signals that traders’ demand backs the token’s double-digit price rally over the past day.

Moreover, MANA trades above its 20-day exponential moving average (EMA), supporting this bullish outlook. At press time, this key moving average forms a dynamic support level below MANA’s price at $0.26.

MANA 20-day EMA
Decentraland (MANA) 20-day EMA

The 20-day EMA measures an asset’s average price over the past 20 trading days, giving more weight to recent prices. When it falls below the price, it suggests that the market is in a short-term uptrend, with recent prices higher than the average of the past 20 days.

This indicates strong bullish momentum, as MANA’s price currently outperforms the recent average.

MANA Bulls Maintain Control 

On the daily chart, MANA was trading above an ascending trend line, accentuating its price surge. This bullish pattern acts as support and emerges when an asset’s price forms higher lows.

It indicates a consistent upward movement over time amid growing buyer momentum. 

This technical formation suggests MANA buyers are in control, signifying bullish market sentiment. If this outlook sustains, MANA price growth will likely continue, with the trendline providing downward support.

Such an action could see the token’s price break above $0.34, potentially climbing toward $0.44. Such a move would constitute a 41% move above current levels.

Decentraland (MANA) price performance
Decentraland (MANA) price performance. Source: TradingView

Converesly, if profit-taking commences, MANA could shed its recent gains and plunge to $0.19, down nearly 40% below current levels.

The post Decentraland (MANA) Hits Two-Month High Amid Bullish Momentum appeared first on BeInCrypto.

$20 Million HBAR Liquidations Ahead as Price Breaks 7-Week Downtrend

Hedera (HBAR) has recently seen a shift in momentum after enduring a tough seven-week downtrend. The price of the altcoin dropped from $0.265 to as low as $0.130, signaling a significant decline. 

However, there is optimism now, as HBAR seems poised to recover its losses. While this may signal a positive turn for investors, some traders could face significant liquidations.

Hedera Investors Are Gunning For Gains

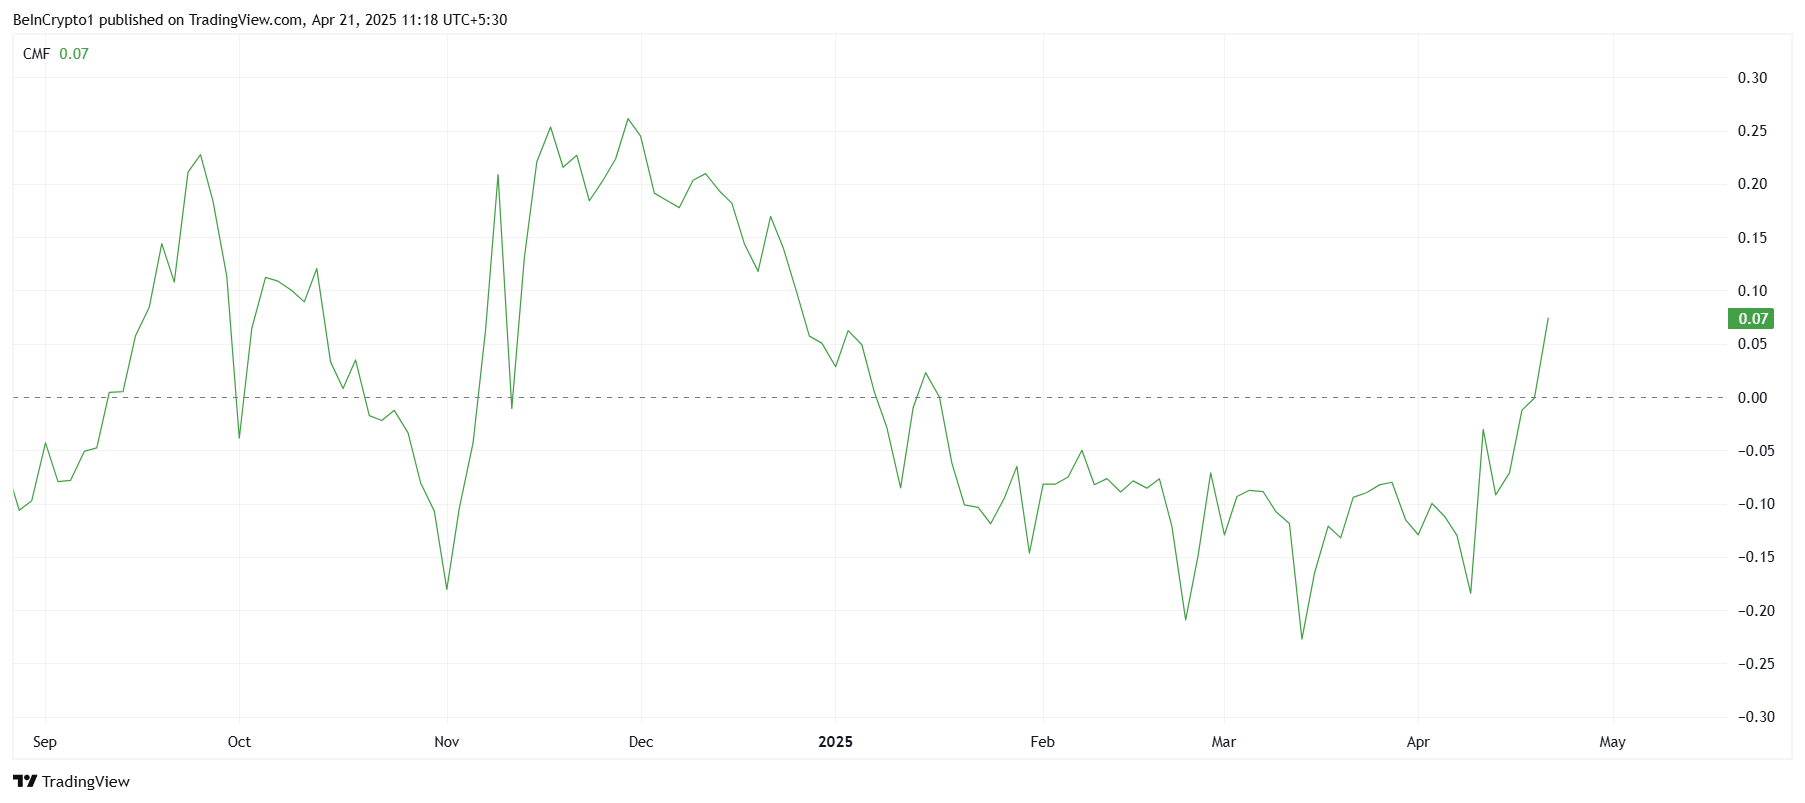
The Chaikin Money Flow (CMF) indicator is showing signs of improvement, recently entering the positive zone above the zero line. This indicates that inflows are significantly outpacing outflows, suggesting a bullish outlook for HBAR

Investors seem to have regained confidence in the token, entering at lower price levels in anticipation of price gains. The CMF is at its highest since the beginning of 2025, further reinforcing this positive sentiment and signaling that the altcoin’s prospects are improving.

HBAR CMF
HBAR CMF. Source: TradingView

The liquidation map indicates a significant event for short traders. As HBAR price approaches $0.178, shorts are at risk of facing $20 million in liquidations. This resistance level is crucial, and if HBAR breaches it, it could shift traders’ sentiment from bearish to bullish. 

The looming liquidations would likely fuel more buying pressure, pushing the price upward. The recent market conditions hint at a potential breakout, which could drive HBAR into new territory, benefiting those who’ve entered the market at a low point.

HBAR Liquidation Map
HBAR Liquidation Map. Source: Coinglass

HBAR Price Rise Gives New Hope

HBAR is currently trading at $0.171, marking a 3.3% gain today. While this increase may seem modest, the price action is more significant in the context of breaking a seven-week downtrend. This shift is creating optimism among investors, and it suggests that the altcoin is poised for further recovery.

The immediate next resistance lies at $0.177. Given the rising optimism and improving market conditions, there is a strong possibility that HBAR will break through this level. A successful breach could see HBAR pushing towards $0.197 and even reaching $0.200, which would confirm a bullish trend reversal.

HBAR Price Analysis.
HBAR Price Analysis. Source: TradingView

However, if HBAR fails to break through $0.177, the altcoin could experience a pullback. This would result in the price falling to $0.154, with further decline potentially bringing HBAR down to $0.143. Any drop below $0.154 would invalidate the bullish outlook and may continue the downtrend.

The post $20 Million HBAR Liquidations Ahead as Price Breaks 7-Week Downtrend appeared first on BeInCrypto.

President Trump’s Push to Oust Powell Sends DXY Plummeting, Bitcoin Hits Liberation Day Highs

The US Dollar Index (DXY) has dropped to a three-year low amid reports that President Donald Trump is considering removing Federal Reserve Chairman Jerome Powell. 

Meanwhile, the development positively affected Bitcoin’s (BTC) price, pushing it to its highest level since President Trump’s Liberation Day.

Trump’s Push Against Powell Adds Pressure on the Dollar

According to the latest data, DXY has plunged below 99. At press time, it stood at 98.2, representing the lowest value since March 2022

DXY Performance
DXY Performance. Source: TradingView

Economist Peter Schiff highlighted the severity of the situation in the latest post on X (formerly Twitter).

“Gold is up over $50, hitting a record high of $3,380. The euro is above $1.15. The dollar has also fallen below 141 Japanese yen and .81 Swiss francs (a new 14-year low, just 3% above a record low). The dollar Index is below 98.5, a new three-year low. This is getting serious,” Schiff posted.

The dollar’s steep fall comes amid the latest comments made by National Economic Council Director Kevin Hassett on Friday, April 18. Hassett revealed that Trump and his team are actively exploring the possibility of ousting Powell.

His statement was in response to a reporter’s question about whether removing Powell was an option.

“The president and his team will continue to study that matter,” Hassett replied.

In addition, he called out the Federal Reserve for politically motivated actions under Powell’s leadership. Specifically, Hassett criticized the Fed for raising interest rates shortly after Trump’s election and cutting them ahead of the election, moves he claims favored the Democratic Party. 

Notably, the growing contempt towards Powell is a response to the Fed’s stance on interest rates. BeInCrypto reported earlier that the Fed will likely not cut rates in May amid rising inflation and President Trump’s tariff pause.

Recently, Trump also blamed the Fed Chair for being slow to act on interest rate cuts. In a post on social media, Trump compared Powell’s actions unfavorably to the European Central Bank (ECB), which is set to implement its seventh interest rate cut. 

Trump argued that Powell, whom he described as “always too late and wrong,” should have taken similar measures long ago to address economic conditions.

“Powell’s termination cannot come fast enough!” the President wrote.

The Fed Chair’s potential removal raises serious questions about the Federal Reserve’s independence and its implications for global markets. Powell, whose term as chair extends to May 2026, has previously stated that legal protections prevent his removal and that he intends to serve out his term.

Will Dollar Weakness Drive Bitcoin to New Heights?

Nonetheless, it’s worth noting that if Powell is removed and President Trump successfully persuades the Federal Reserve to cut interest rates, it could likely lead to a crypto market rally. Generally, when the Fed lowers interest rates, the US dollar tends to weaken.

Therefore, investors prefer cryptocurrencies, especially Bitcoin, which is often seen as a hedge against inflation and the weakening of fiat currencies. The inverse relation between the DXY and BTC further solidifies the case for a rally if the dollar depreciates.

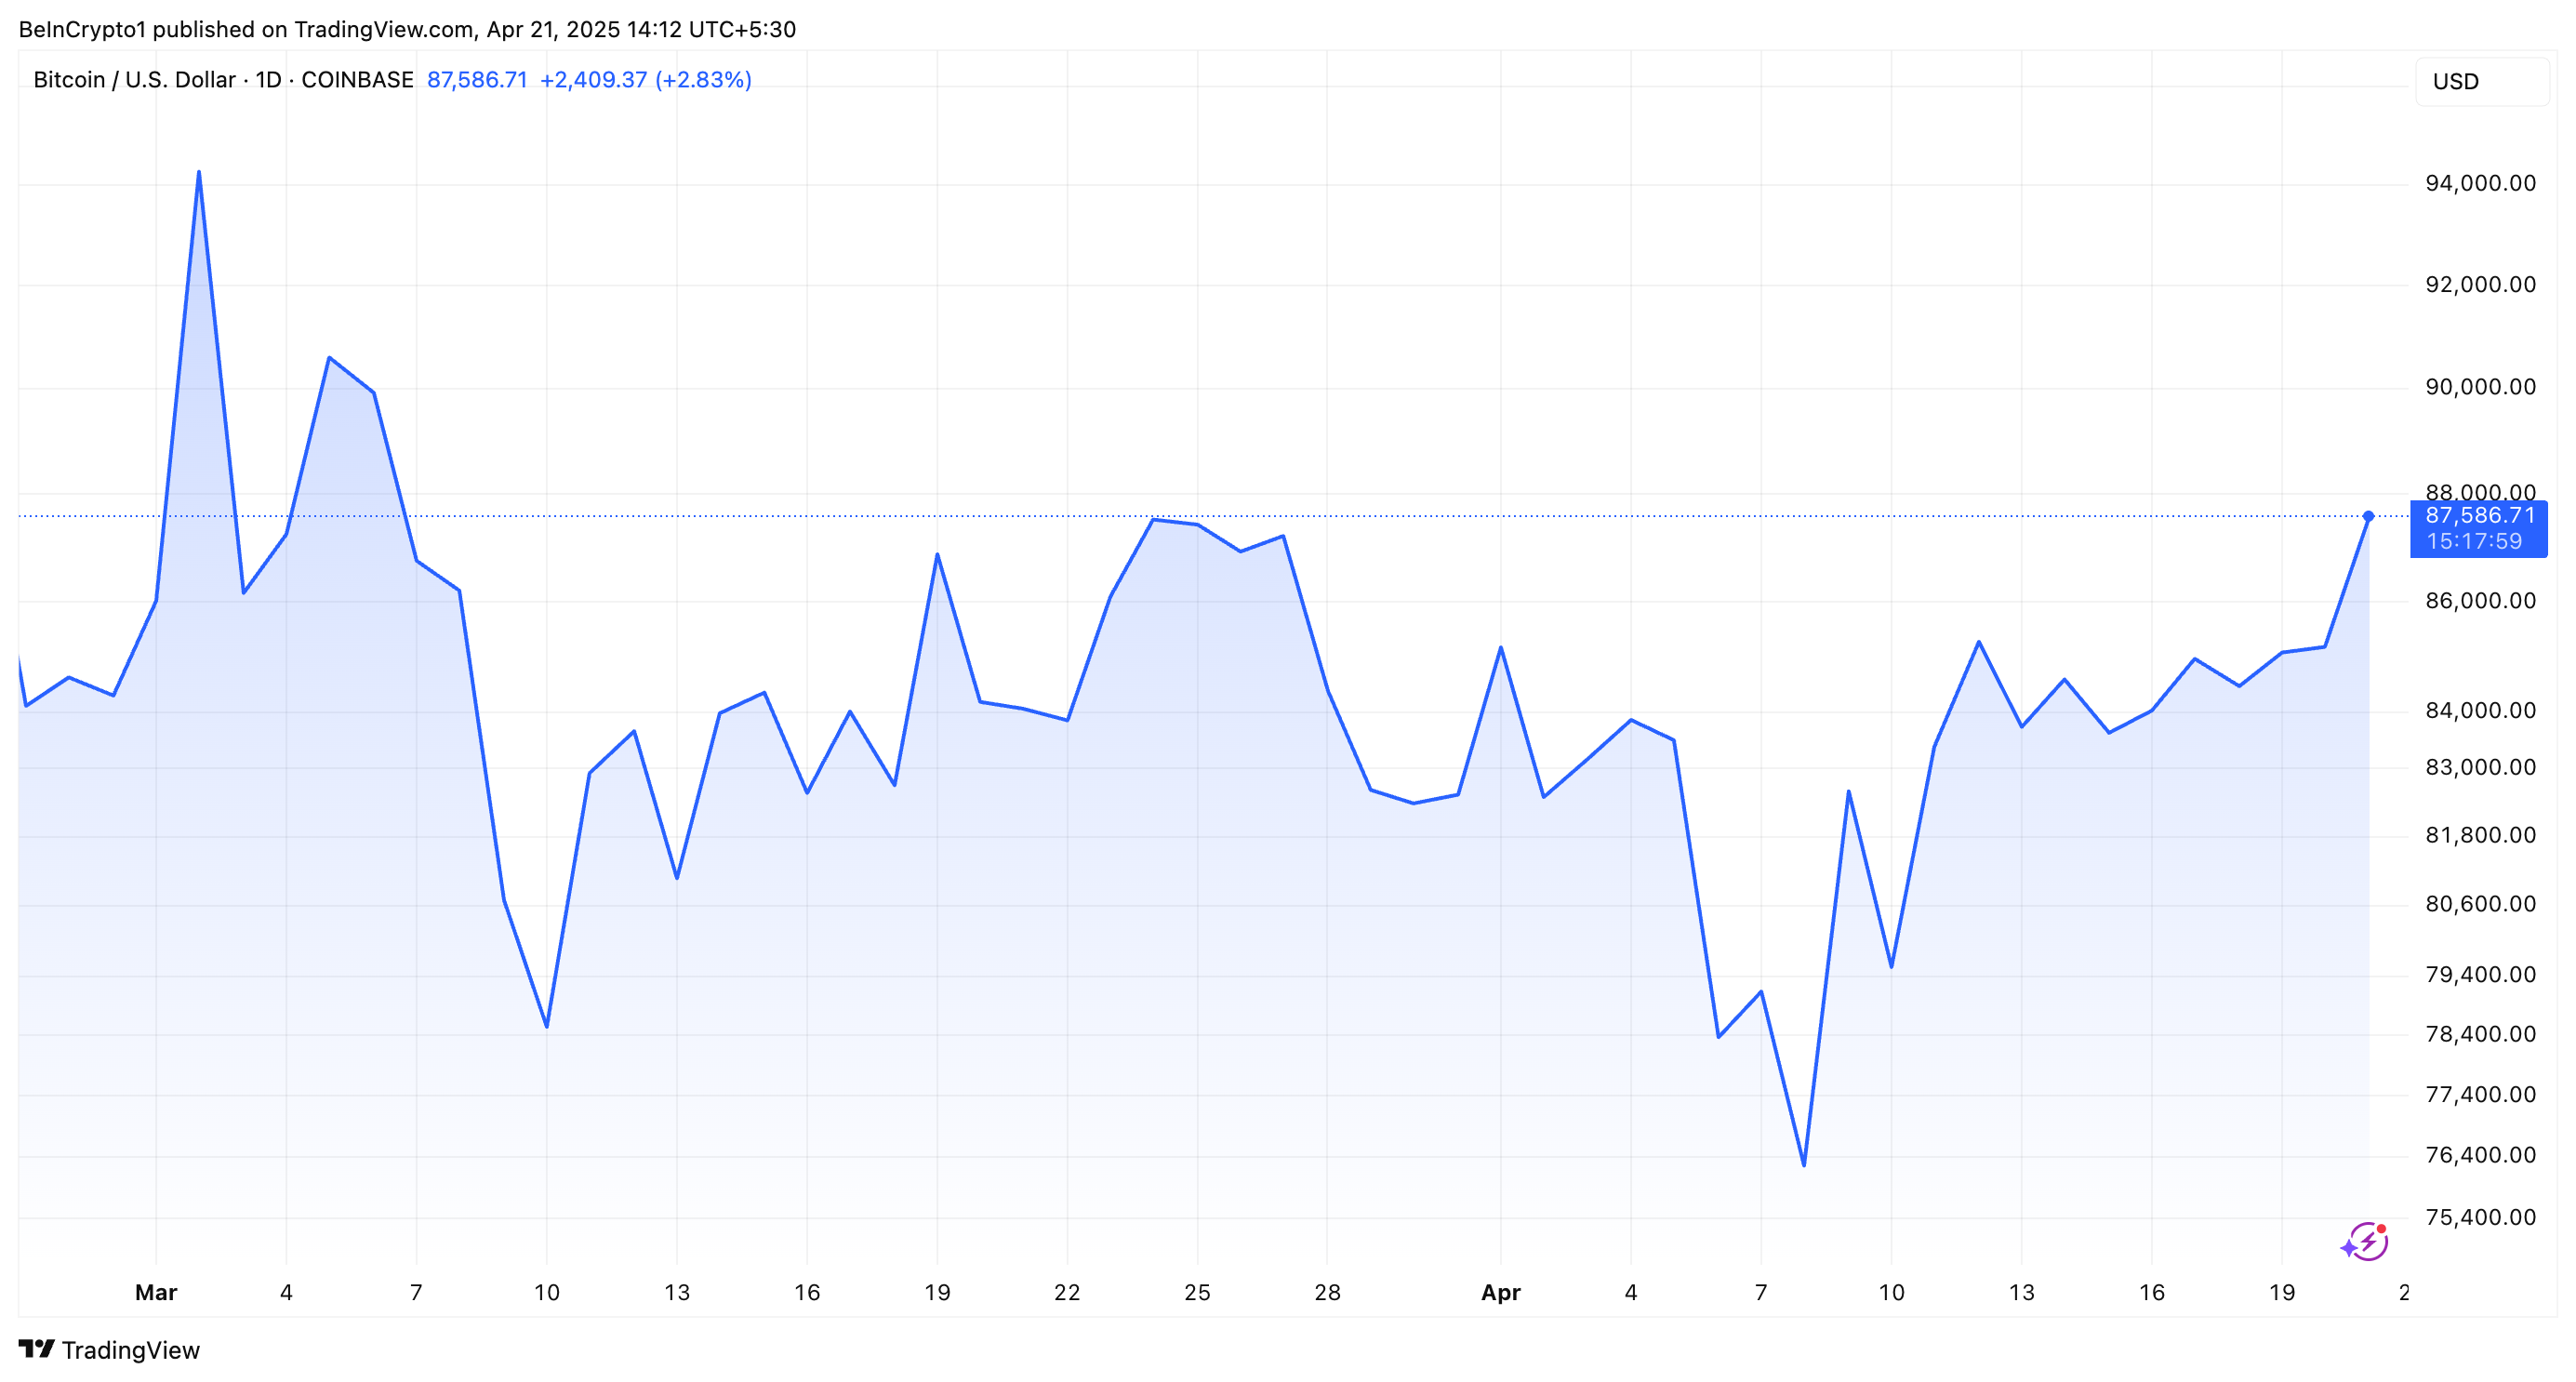
In fact, the latest decline in the dollar index has coincided with a notable increase in Bitcoin’s price. The largest cryptocurrency surged to over $87,000 for the first time since April 2.

“USD weakness is driving the rally in crypto,” Sean McNulty, Derivatives Trading Lead at FalconX, told Bloomberg.

Bitcoin Price Performance
Bitcoin Price Performance. Source: TradingView

At the time of writing, BTC was trading at $87,586. BeInCrypto data showed that this represented an appreciation of 3.5% over the past day. As markets celebrate these gains, the focus remains on Trump’s next moves and their broader economic consequences.

The post President Trump’s Push to Oust Powell Sends DXY Plummeting, Bitcoin Hits Liberation Day Highs appeared first on BeInCrypto.

Solana Surpasses Ethereum in Staking Market Cap: Breakthrough or Just Hype?

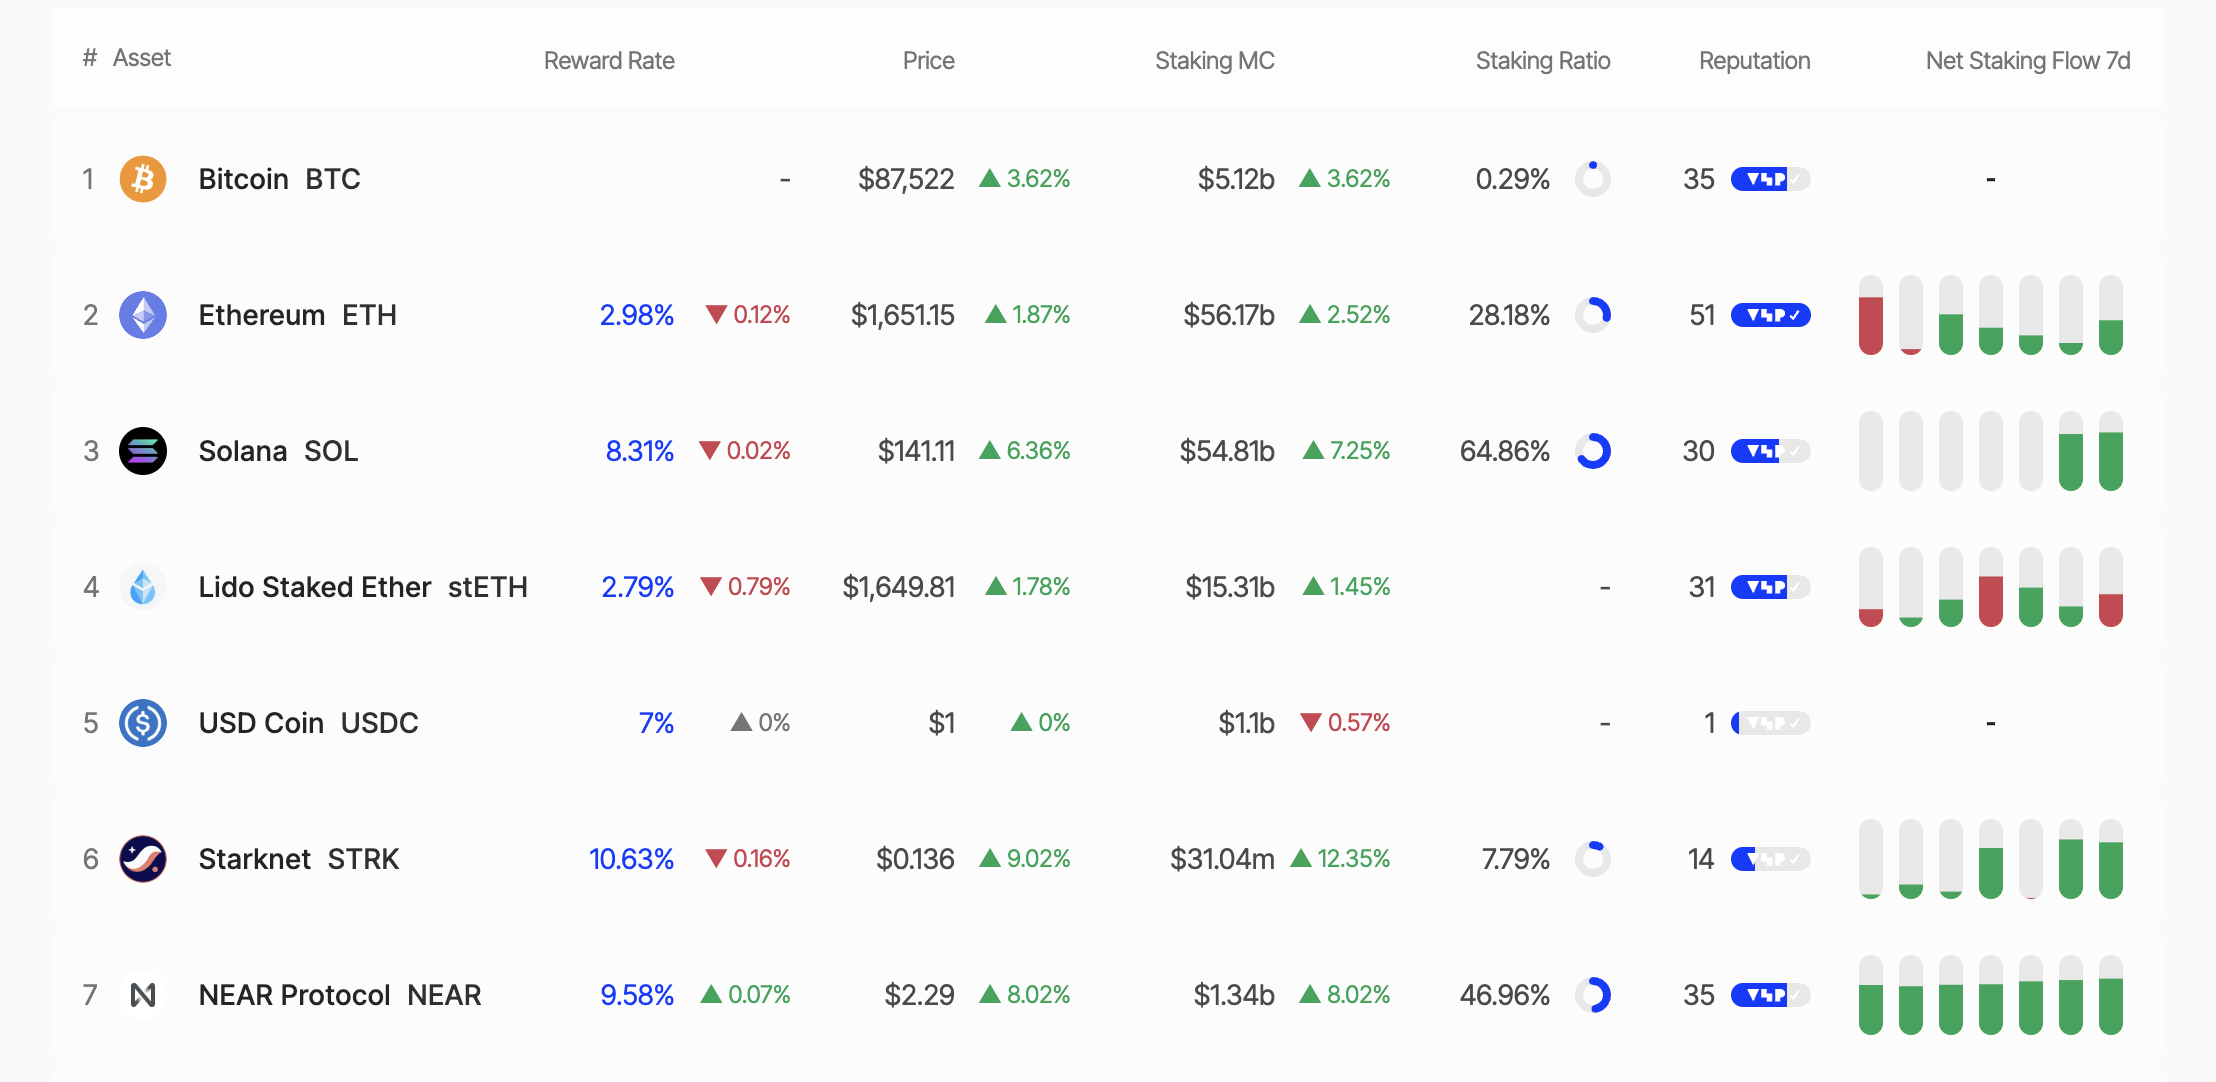
According to data from StakingRewards, Solana (SOL) has overtaken Ethereum (ETH) in staking market capitalization, reaching $53.15 billion compared to Ethereum’s $53.72 billion. 

This milestone has sparked heated discussions across the social media platform X, raising the question: Is this a turning point for Solana, or merely a short-lived surge?

Solana Outpaces Ethereum As High Staking Yields Prove Appealing

Recent data reveals that 64.86% of Solana‘s total supply is currently staked, delivering an impressive annual percentage yield (APY) of 8.31%. In contrast, Ethereum has only 28.18% of its supply staked, with an APY of 2.98%.

Staking rewards for Solana and Ethereum
Staking rewards for Solana and Ethereum. Source: StakingRewards

This disparity highlights Solana’s growing appeal for investors seeking passive income through staking. Staking market capitalization is calculated by multiplying the total number of staked tokens by their current price. With SOL priced at $138.91 as of this writing, Solana has officially surpassed Ethereum in this metric.

However, Solana’s high staking ratio has sparked some controversy. Critics, such as Dankrad Feist on X, argue that Solana’s lack of a slashing mechanism (or penalties for validator violations) undermines the economic security of its staking model. With its slashing mechanism, Ethereum offers greater security, despite its lower staking ratio.

“It’s very ironic to call it ‘staking’ when there is no slashing. What’s at stake? Solana has close to zero economic security at the moment,” Dankrad Feist shared.

Increased Whale Activity Signals Caution

Meanwhile, recent moves by “whales” (large investors) have further fueled interest in Solana. On April 20, 2025, a whale unstaked 37,803 SOL (worth $5.26 million). Similarly, Galaxy Digital withdrew 606,000 SOL from exchanges over four days (April 15–19, 2025), concluding with 462,000 SOL.

Additionally, on April 17, 2025, a newly created wallet withdrew approximately $5.15 million worth of SOL from the Binance exchange. In the same tone, Binance whales withdrew over 370,000 SOL tokens valued at $52.78 million.

While some whales withdrew their SOL holdings, other large holders accumulated. Janover, a US-listed company, increased its Solana holdings to 163,651.7 SOL (worth $21.2 million) and partnered with Kraken exchange for staking on April 16, 2025.

These actions signal diverging plays from institutional investors and whales, as the Solana price fluctuates around key levels.

SOL Price Analysis: Opportunities and Challenges

As of this writing, SOL was trading at $140.49, up 3.53% in the past 24 hours. Analysts highlight $129 as crucial support for the Solana price, with $144 presenting the key roadblock to overcome before Solana’s upside potential can be realized. Breaking above the aforementioned roadblock could propel SOL toward new highs.

The most important support for SOL is at $129. Source: Ali/X

Conversely, dropping below the $129 support level could trigger increased selling pressure. Nevertheless, SOL has shown a remarkable recovery, with a 14.34% increase over the past week.

Another factor to consider is the ongoing development of the Solana ecosystem. Key innovations include the QUIC data transfer protocol, the combination of Proof-of-History (PoH) and Proof-of-Stake (PoS), and the diversification of validator clients.

With these, Solana continues to enhance its performance and decentralization. Additionally, the launch of the Solang compiler, compatible with Ethereum’s Solidity, has attracted developers from the Ethereum ecosystem.

BeInCrypto also reported on Solana’s upcoming community conference, otherwise termed Solana Breakpoint. Key announcements from this event could provide further tailwinds for the SOL price.

Nevertheless, despite surpassing Ethereum in staking market capitalization, Solana faces significant challenges. Ethereum benefits from a more mature DeFi ecosystem, greater institutional trust, and enhanced security through its slashing mechanism.

To some, Ethereum’s lower staking ratio (28%) may be a deliberate strategy to reduce network pressure and ensure liquidity for DeFi applications.

In contrast, Solana’s high staking ratio (65%) could limit liquidity within its DeFi ecosystem. This raises the question of whether Solana can strike a balance between staking and the growth of its decentralized applications.

As Solana continues challenging Ethereum’s dominance, the crypto community remains divided. Is Solana’s rise a sustainable breakthrough, or just another wave of hype?

The post Solana Surpasses Ethereum in Staking Market Cap: Breakthrough or Just Hype? appeared first on BeInCrypto.

Expert Says Solana Price To $2,000 Is Within Reach, Here’s How

Expert Says Solana Price To $2,000 Is Within Reach, Here's How

While investors are scanning the horizon for a short-term Solana (SOL) rally, cryptocurrency expert CryptoCurb is predicting an ultra-bullish price movement. CryptoCurb argues that a Solana price of $2,000 is “absolutely realistic” given the current fundamentals and on-chain indicators.

Solana Price To $2,000 Is A Realistic Projection

Pseudonymous cryptocurrency analyst CryptoCurb is predicting a massive growth spurt for Solana in the near future. In an X post, the expert says the Solana price can achieve a valuation of $2,000 given its impressive network metrics.

He hinges his projection on several factors, including Ethereum’s previous price performance. Ethereum price spiked to a $600 billion market capitalization during the last cycle with its steep fees and scalability issues.

A $2K SOL price will translate to a $1 trillion market capitalization that will see it flip Ethereum as the largest altcoin. CryptoCurb notes that if Ethereum can post impressive figures during the last cycle, Solana has the capabilities to be valued at $2,000.

“2K is absolutely realistic if Solana keeps its global adoption pace with minimal disruptions and continues to scale,” said CryptoCurb.

Rising network inflows are expected to send the Solana price on a short-term rally to $150 before a big push to $2K. Currently, the Solana price is pegged at $140 with a market capitalization of $72.6 billion, making CryptoCurb’s prediction an uphill climb.

A Wave Of Impressive Metrics Around SOL

While CryptoCurb did not disclose an exact timeline for his $2,000 prediction, he points to a short-term seismic price increase. The expert his backing his predictions with a swathe of network metrics pointing to fresh bullishness.

Solana has the highest number of active addresses over the last seven days at 28.4 million. The network led the pack for transactions at 369 million, trouncing Tron, BNB Chain, Base, and Bitcoin.

Solana is finding application in several Web 3 verticals given its speed, low cost, and scalability. In the last week, the Solana price has risen by nearly 7% while 24-hour trade volume has risen by 36%.

Last week, Canada launched the first SOL ETF with prices projected to surpass $250, reversing a forming death cross. Solana open interest crossed 5.5 billion, climbing by 10% amid rising whale activity in the ecosystem.

Rising bullish metrics for the network suggest that SOL will reach $200 before ETH reclaims $3,000.


The post Expert Says Solana Price To $2,000 Is Within Reach, Here’s How appeared first on CoinGape.

Bitcoin Price Flashes Brilliance As China Increases Gold Holdings By Five Tonnes

Bitcoin Price Flashes Brilliance As China Increases Gold Holdings By Five Tonnes

China is loading up on its gold holdings, racking up five tonnes in a frenetic accumulation spree over the last month. The push for gold is triggering unintended consequences for Bitcoin price, with BTC comfortably holding the $85K mark.

Bitcoin Price Shows Resilience Amid China’s Gold Rush

According to an X post by the Kobeissi Letter, China is continuing its streak of stacking up gold bars. The latest accumulation spree sees the People’s Bank of China (PBoC) bolster its existing gold holdings by five tonnes over the last month.

While China’s frenetic push for gold continues to raise eyebrows, the Bitcoin price is riding the tailwind of the purchases. At the moment, Bitcoin price is trading at $85,000 despite a whirlwind of negative macroeconomic reports in recent days.

Barely four days ago, Bitcoin and other cryptocurrencies tanked after US President Trump slapped 245% tariffs on China. The recent recovery on the heels of the PBoC’s disclosure of its gold holdings has left investors scratching their heads.

A plausible reason for the BTC price resurgence is its rising safe-haven appeal flowing from China’s gold embrace. Traders are seeing upside in Bitcoin’s value as a hedge against inflation flowing from China’s decision to ditch the US dollar.

Another reason for Bitcoin’s rise is the growing possibility that China is inching toward a Strategic Bitcoin Reserve. However, reports of China selling 15,000 BTC on offshore exchanges poke holes in the Strategic Bitcoin Reserve theory.

Gold Surges To New Highs With BTC Poised To Follow Its Path

The price of gold has soared to new highs, sparking speculation that the Bitcoin price will follow suit. Gold is trading at $3,326 after adding nearly $100 over the last week. The surge in gold prices stems from renewed institutional interest, with China leading the charge.

The US-China tariff wars are powering a mad dash for safe-haven assets, with gold receiving renewed interest. Bitcoin, on the other hand, is set to record similar institutional interest as a complementary safe-haven asset.

However, Peter Schiff warns that Bitcoin is in a bear market, dousing enthusiasm for a push to mirror gold prices. Spot Bitcoin ETFs have recorded the largest drawdown since launch, but Bitcoin price is holding up in a strong show of strength.

“$4.8B has left the ETF market since the cumulative flow ATH,” said cryptocurrency analyst Darkfost. “Meanwhile, the price of BTC has recently remained relatively stable so far, showing limited reaction to this selling pressure.”


The post Bitcoin Price Flashes Brilliance As China Increases Gold Holdings By Five Tonnes appeared first on CoinGape.

Bitcoin Price Forecast: Oregon Attorney General Sues Coinbase, is BTC $100K Rally at Risk?

Bitcoin price consolidates above the $84,600 on Sunday, April 20. Having closed eight consecutive sessions above the $80,000 mark, on-chain data trends suggest BTC market outlook for the week ahead remains bullish despite regulatory pressures on Coinbase.

Oregon State to Sue Coinbase as Bitcoin Price Holds Above $80,000 for Consecutive Days

Oregon Attorney General Dan Rayfield has filed a securities enforcement action against Coinbase, alleging that the exchange facilitated the sale of unregistered crypto assets, exposing investors to significant risk.

In the lawsuit, Oregon state alleges that Coinbase has encouraged the sale of unregistered cryptocurrencies to people in Oregon exposing residents to risk of pump-and-dump schemes and fraud. 

“After building trust with Oregon consumers, Coinbase sold high risk investments without them being properly vetted to protect consumers Oregonians lost money, and we believe Coinbase should be held accountable and take steps to protect consumers.”

Rayfield said in a statement  issued on April 18.

The complaint accuses Coinbase of misleading consumers in Oregon by offering high-risk digital assets without sufficient oversight.

In response, Coinbase’s Chief Legal Officer, Paul Grewal, called the suit a “desperate scheme” and “a giant leap backwards” in crypto policy progress.

Despite this legal headwind, Bitcoin has remained resilient. Following a sharp decline to $74,300 on April 9, triggered by China’s new tariffs on U.S. tech, BTC swiftly rebounded after the U.S. Consumer Price Index for March came in lower than expected.

Bitcoin price action, April 20, 2025  | Source: Coingecko 
Bitcoin price action, April 20, 2025  | Source: Coingecko

Bitcoin price is trading at $84,500 at press time on April 20, having closed above $83,000 for eight consecutive trading sessions.

This steady uptrend, even in the face of a fresh regulatory attack, suggests that the market sees the lawsuit as isolated to Coinbase—not a major threat to Bitcoin’s near-term price prospects. With continued institutional interest and technical strength holding above key support, BTC price appears poised to maintain positive momentum in the week ahead

BTC Showing Resilience to U.S. Pressures

Bitcoin’s recent price action showcases strength relative to U.S. equities, particularly in the tech sector.

While flagship stocks such as NVIDIA and Microsoft grapple with declining investor sentiment, Bitcoin continues to draw inflows and sustain support.

US Tech Stocks Heatmap, April 20| Source: TradingView

NVIDIA shares dropped over 7% this week following a $5.5 billion charge related to China export compliance. The erasing billions in market capitalization for adjacent US tech stocks including Microsoft, Tesla, and Apple.

Against this backdrop, Bitcoin has appreciated nearly 12% since April 12.

More so, Lower-than-expected jobless claims last week increased pressure on the Fed to maintain a hawkish stance—yet BTC has continued its upward trajectory, bucking the risk-off trend.

This decoupling signals renewed investor conviction in Bitcoin as a long-term macro asset, especially as U.S. fiscal policy and central bank dynamics introduce heightened volatility to traditional markets.

Investors Pull 14,000 BTC from Exchanges in the Last 8 Days as BTC Sets Up Local Bottom

A critical on-chain indicators supporting the current BTC rally is the notable drop in exchange-held Bitcoin.

Data from CryptoQuant shows that more than 14,000 BTC have been withdrawn from centralized exchanges since April 12, aligning with the day Bitcoin reclaimed the $80,000 level.

Bitcoin Price vs. BTC Exchange Reserves, April 2025 | Source: CryptoQuant 
Bitcoin Price vs. BTC Exchange Reserves, April 2025 | Source: CryptoQuant

These outflows suggest increasing long-term conviction among holders, reducing available supply for trading and heightening the potential for price appreciation. Historically, sustained withdrawal activity often marks local bottoms and preludes major bullish cycles.

The drop in exchange balances comes at a time of increased spot demand—especially with platforms like Charles Schwab signaling intentions to enter direct crypto spot trading.

As regulatory uncertainty begins to decouple from Bitcoin’s price performance, investors appear to be front-running the next wave of institutional participation.

In conclusion, while the Oregon lawsuit against Coinbase may create noise in the short term, Bitcoin’s structural and technical foundation remains intact. A continued consolidation above $83,000—paired with supply contraction and strong macro divergence—puts the $90,000 and $100,000 targets well within reach for Q2.

Bitcoin Technical Analysis Today: BTC Eyes $88K Breakout After Sideways Coil

Bitcoin price is consolidating below a descending trendline resistance near $85,489, with short-term support from the 4-day SMA at $84,632.  As see in the Bitcoin price forecast chart below, BTC has formed a coiling pattern with higher lows and marginally lower highs—often a prelude to a decisive breakout.

On April 20, BTC closed at $84,594, holding above the critical $84K level for the eighth consecutive session, suggesting persistent underlying demand.

Bitcoin Technical Analysis Today

The Average Daily Range (ADR) remains muted at 3.06, indicating consolidation but also priming BTC for a potential expansion in volatility.

Meanwhile, the bullish BBP (Buy Balance Power) reading at 1,553.76 reinforces near-term strength, showing that buying momentum is outpacing sell pressure. Volume has declined modestly, but the broader context of consistent closes above $83,000 reflects solid market absorption.

Bitcoin price forecast today leans bullish as the 4-day SMA trends above price, creating a compression zone between it and the 60-SMA. A daily candle close above $85,500 could confirm a breakout, targeting $88,000 short term. Failure to hold $84,000 would re-expose $82,300 as interim support.

The post Bitcoin Price Forecast: Oregon Attorney General Sues Coinbase, is BTC $100K Rally at Risk? appeared first on CoinGape.

Elizabeth Warren Warns Stock Market Will Crash If Trump Fires Powell, Will Crypto Market Crash Too?

Elizabeth Warren Warns Stocks Will Crash If Trump Fires Powell, Will Crypto Market Crash Too?

Senator Elizabeth Warren has sounded a warning to US President Donald Trump about firing Fed Chair Jerome Powell. The Senator believes such action will crash the stock market, while it is also possible that the crypto market could follow suit.

Elizabeth Warren Says Trump Firing Powell Will Crash Stock Market

In a CNBC interview, Senator Warren, a member of the Banking Committee, stated that the stock market would crash if US President Donald Trump were to fire Fed Chair Jerome Powell. She explained that the Fed’s supposed independence is the infrastructure that keeps the market strong.

As such, if Trump were able to fire Powell, this would erode the US Central Bank’s independence and send a message to market participants that politics can influence the Fed’s economic decisions, which is bearish for the markets.

Warren’s warning is significant because the crypto market could also follow suit if the stock market were to crash following Powell’s termination. IntoTheBlock data shows that the Bitcoin price has a 0.63 correlation with the S&P 500, indicating a strong positive correlation between BTC and stocks.

Therefore, crypto assets, led by Bitcoin, could witness another crash alongside the stock market if Trump fires Powell. The US president has hinted over the past few weeks that he is looking forward to the Fed Chair’s departure. However, traders are betting against Trump firing Powell this year.

Other Reasons To Still Be Bullish

While discussions grow on whether Trump will fire Powell or not, there are still other reasons to be bullish on the Bitcoin price and the broader crypto market. As CoinGape reported, the US president recently signaled a potential end to the US-China trade war, which is bullish for the market, seeing the negative impact tariffs have had so far.

Meanwhile, the US continues to push for a ceasefire in the Russia-Ukraine war. Although it seems no progress has been made so far, Trump’s insistence could eventually pay dividends with Putin and Zelensky reaching an agreement.

From a technical analysis perspective, crypto analyst Titan of Crypto also suggested that BTC and altcoins may have bottomed out. He noted that BTC is holding well at a key support, while some are already calling it “dead”.

crypto market

His accompanying chart indicated that BTC could soon reclaim the $100,000 price level. The broader crypto market is expected to rebound alongside the flagship crypto if this happens.

The post Elizabeth Warren Warns Stock Market Will Crash If Trump Fires Powell, Will Crypto Market Crash Too? appeared first on CoinGape.