As $25 Billion Remains Locked on L2s, Diffuse Shows How That Capital Could Do More
diffuse

The post As $25 Billion Remains Locked on L2s, Diffuse Shows How That Capital Could Do More appeared first on Coinpedia Fintech News

As of April 2025, over $25 billion in assets sit across Ethereum’s Layer 2 (L2) platforms, rollups, and alt-layer ecosystems. These assets, originally deployed for liquidity or governance, have remained confined to their specific ecosystems, unable to contribute to broader network security or generate additional yields due to interoperability challenges, trust concerns, and connectivity issues. 

This fragmentation is a side effect of Ethereum’s L2 success. Networks like Arbitrum, Optimism, and zkSync have significantly improved transaction speed and cost, but at the cost of composability across chains. Assets locked in liquidity pools or lending protocols often remain stuck, unable to move or be repurposed without relying on bridges or wrappers that introduce new risks, fees, and delays.

And yet, those locked assets represent untapped potential. Capital already earning yield in AMMs , lending platforms, or backing overcollateralized stablecoins could do more: supporting broader validation, contributing to shared security, participating in restaking systems, backing overcollateralized stablecoins, cross-chain lending protocols, if only the infrastructure allowed it.

Now, as the industry looks for ways to unlock more utility from already deployed capital, one approach gaining traction focuses on using those assets without moving them. Rather than bridging funds across chains, an approach that introduces friction and risk, some protocols are exploring how locked assets can participate in broader systems while staying exactly where they are.

One such protocol is Diffuse, which is building infrastructure for this kind of cross-chain collaboration. Its Diffuse Collateral enables users to maximize their assets’ utility without relocating them. 

Now, they can contribute locked assets from across L1s and L2s to shared security protocols and restaking networks (which are, by default, constrained by interoperability challenges, trust concerns, and connectivity bottleneck) like Symbiotic without moving, wrapping, or giving up custody, with support for EigenLayer coming soon. In return, participants can earn an additional 2–5% in rewards annually, without taking on the risks typically associated with bridging or reallocation.

The Architecture Behind Diffuse Collateral and zkServerless Execution

A cross-chain mechanism for Collateral Abstraction is powered by a zkServerless architecture. At the core of this protocol design are two key principles: verifiable data and trustless interoperability.

As of early 2025, over $2.5 billion has been lost to bridge and oracle exploits, highlighting the risks of relying on intermediaries for cross-chain coordination and off-chain data. At the same time, demand for real-world inputs in tokenization, lending, and restaking is rising fast, making verifiability essential.

Verifiable data ensures inputs like on-chain events are provably correct. Trustless interoperability allows protocols to work across chains without custodians, wrapped tokens, or fragile governance models – now a baseline requirement, not a nice-to-have.

The zkServerless system enables developers to define logic that reacts to on-chain or off-chain events, using authenticated data from Web2 and Web3 sources. This ensures that smart contract interactions across chains, such as linking assets on one blockchain to restaking or some other protocols, can occur securely, without intermediaries.

There are several core components that work together to make cross-chain collateralization secure and trustless. Diffuse’s data feeds use a combination of zero-knowledge (zkTLS) proofs (cryptographic methods that prove something is true without revealing the underlying data) and trusted execution environments (TEEs), which are secure hardware zones that ensure data can’t be tampered with during processing. Together, they fetch real-time prices directly from centralized exchange APIs in a way that’s both accurate and verifiable.

Risk parameters for each collateral type are calculated using these same feeds, allowing the protocol to adjust safeguards dynamically for volatile or complex assets. The Diffuse Protocol tracks key events like deposits, withdrawals, or slashing across chains, while Diffuse Core generates the cryptographic proofs that confirm and authorize each action.

For example, a user holding an asset like wrapped Bitcoin (wBTC) on Ethereum, if supported as collateral, could deposit it directly on Ethereum. From there, Diffuse Collateral helps allocate it to Symbiotic’s vaults on other chains, like Optimism. Rather than moving the asset, Diffuse uses its zkServerless system to generate cryptographic proofs that verify deposit events and other cross-chain actions. This allows the asset to contribute to shared security while remaining in place. All transactions and state changes are backed by verifiable data, giving users and protocols confidence in the process without relying on intermediaries.

Unlocking More Than Yield from the Billions Locked Across Chains

With billions in locked assets still siloed across chains, Diffuse Collateral offers more than just yield. It brings infrastructure-level benefits to the networks themselves. By enabling high-quality collateral to support shared security protocols without relocating capital, Diffuse helps blockchains retain liquidity, reduce fragmentation, and scale participation in restaking. Built on zkServerless, it delivers the cryptographic guarantees, low-overhead automation, and verifiable execution needed to support this coordination at scale. As restaking and shared security reshape DeFi’s foundation, Diffuse is creating new reward pathways and giving blockchains a smarter way to stay liquid, secure, and connected.

The post As $25 Billion Remains Locked on L2s, Diffuse Shows How That Capital Could Do More appeared first on Coinpedia Fintech News
As of April 2025, over $25 billion in assets sit across Ethereum’s Layer 2 (L2) platforms, rollups, and alt-layer ecosystems. These assets, originally deployed for liquidity or governance, have remained confined to their specific ecosystems, unable to contribute to broader network security or generate additional yields due to interoperability challenges, trust concerns, and connectivity issues.  …

Solana Price Aims At Crossing $150 As Investors’ Activity Hits 2-Month High

Solana (SOL) has made significant strides in recent weeks, reaching a monthly high after a steady incline in its price action. Currently trading at $139, the altcoin has encountered resistance at the $148 level, which it failed to breach previously. 

However, further rally from this point could set the stage for a move beyond $150, contingent upon investor support.

Solana Investors Are Optimistic

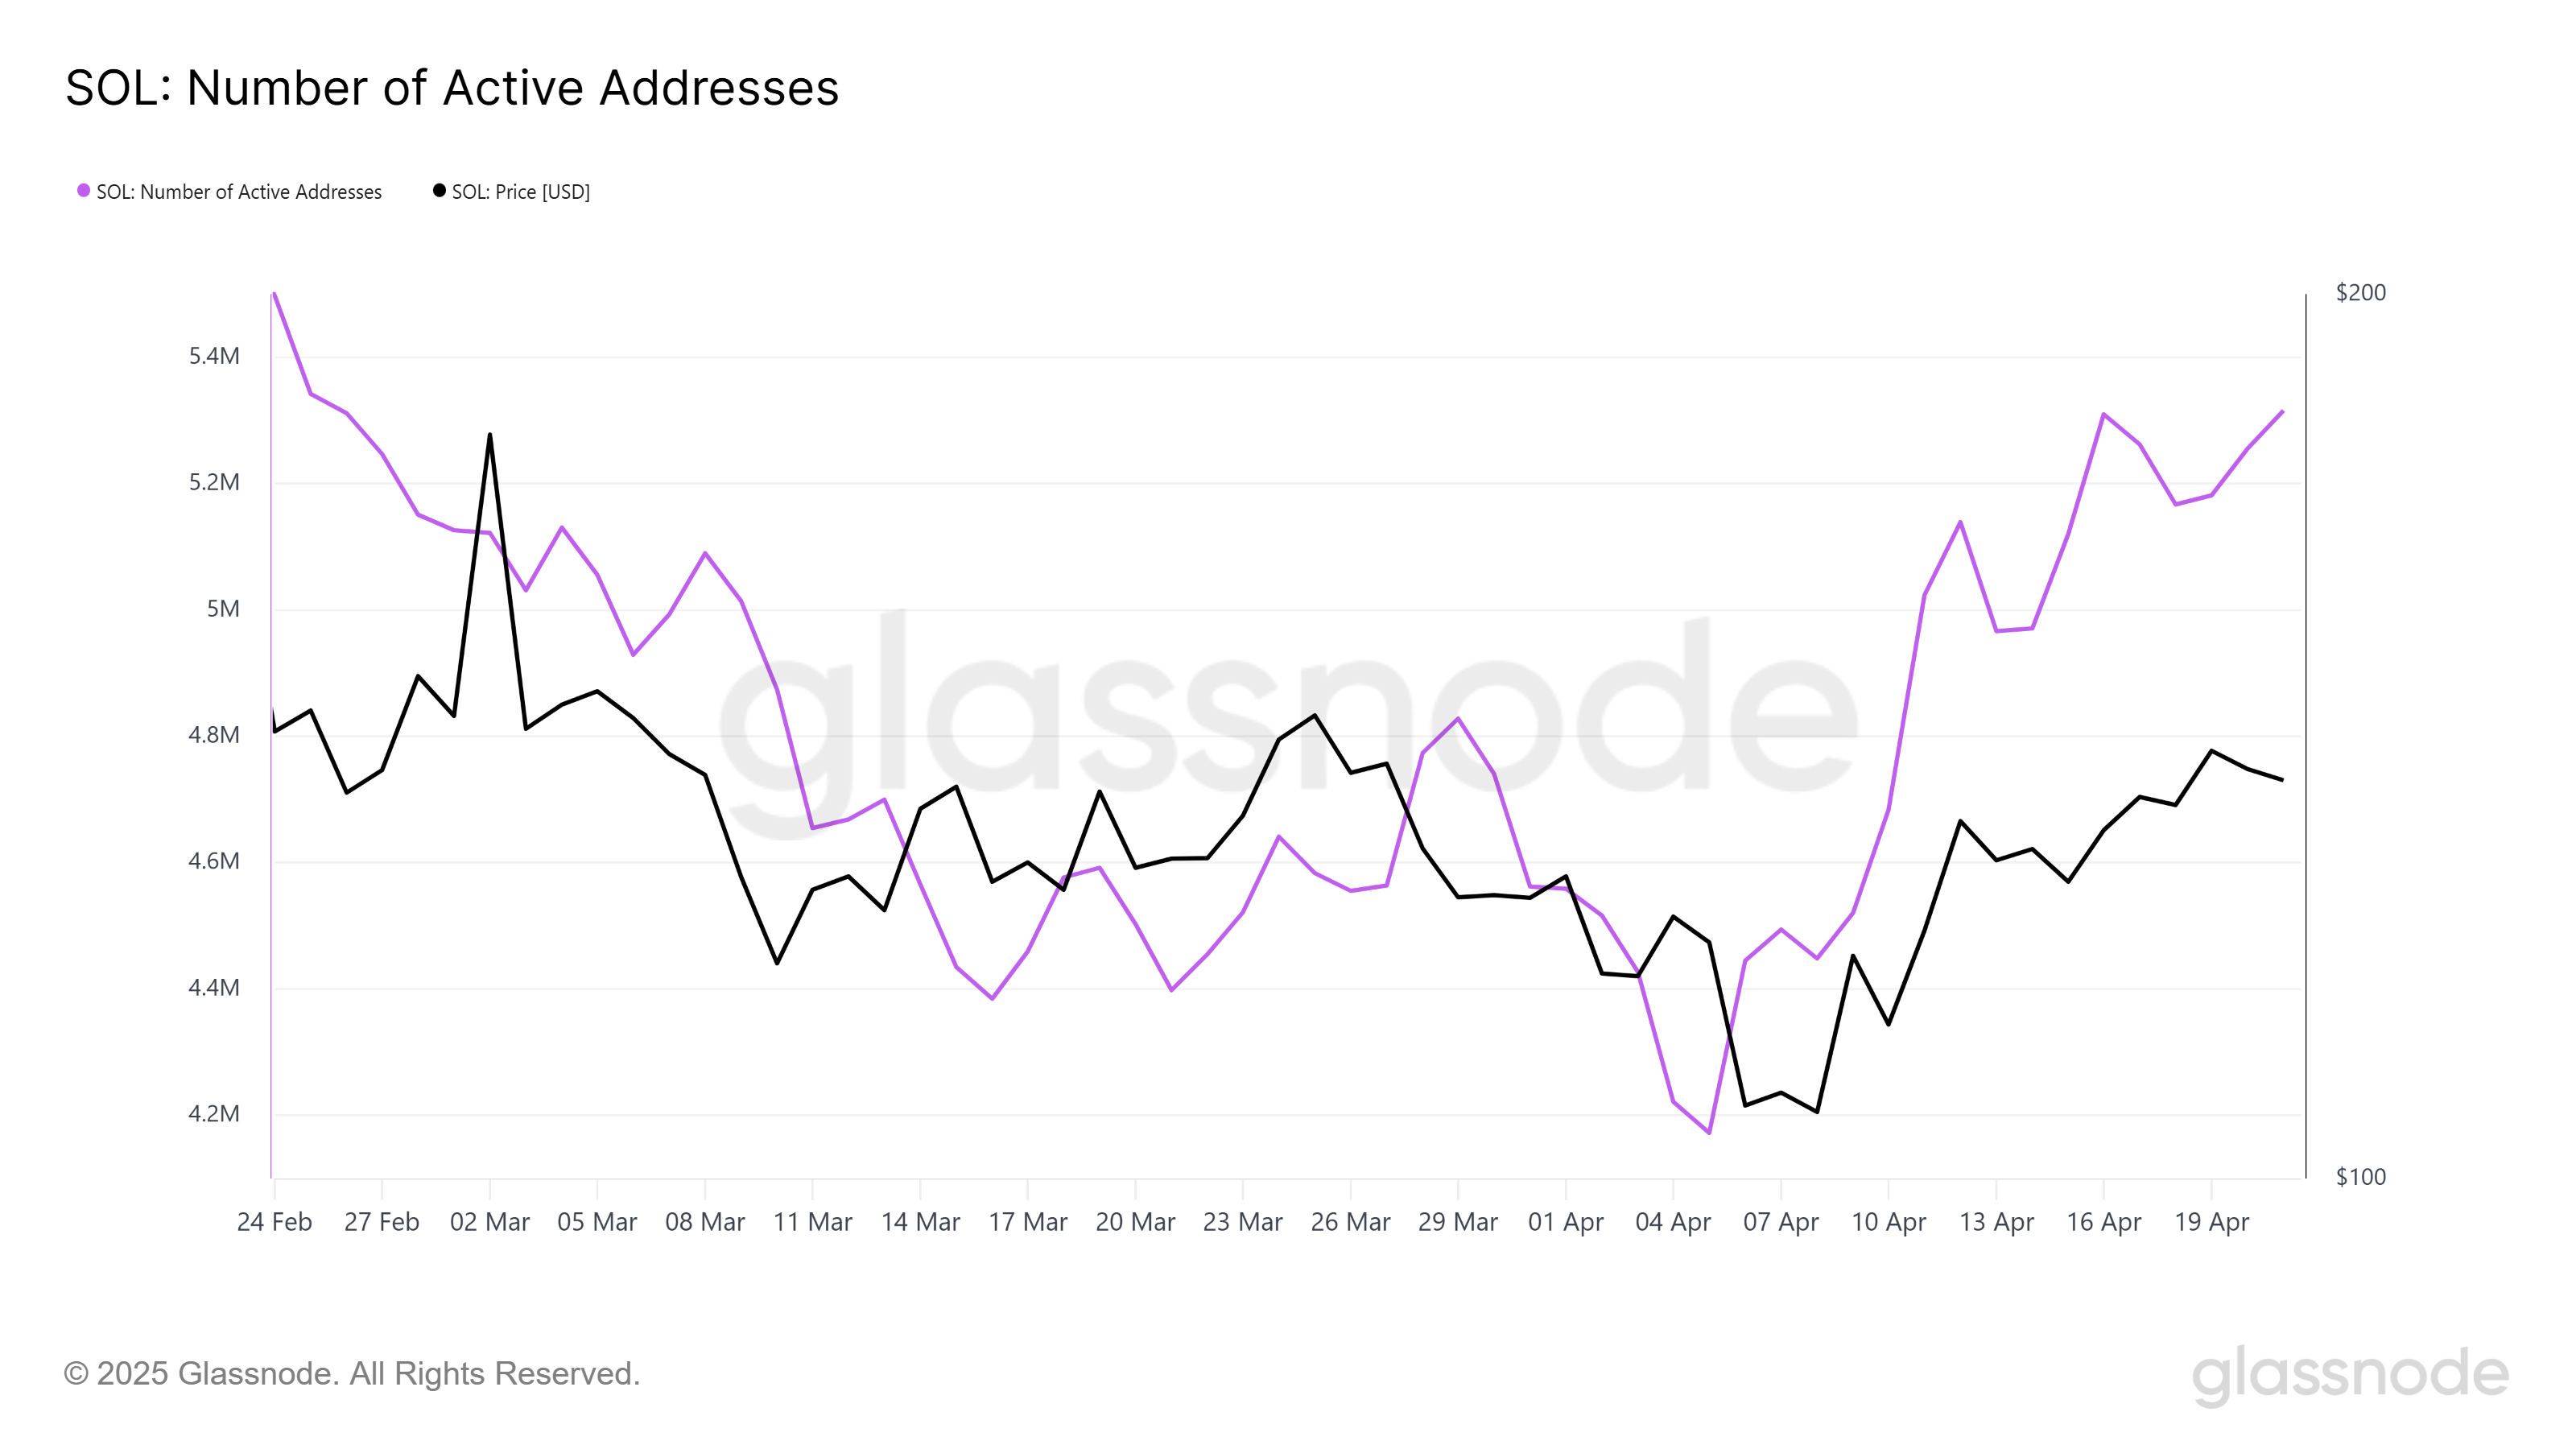
Solana’s recent uptick has been fueled by growing investor participation. Active addresses have surged to a two-month high, signaling renewed interest and confidence in the blockchain.

This rise in activity, combined with the price increase, is providing a strong buy signal. With more investors entering the market, there’s a higher likelihood that Solana will maintain its bullish momentum.

Increased participation in the network is often a strong indicator of investor confidence. The higher the number of active addresses, the more likely it is that the price will continue to rise. If these trends persist, Solana could build enough momentum to break through the $148 resistance and target $150.

Solana Active Addresses
Solana Active Addresses. Source: Glassnode

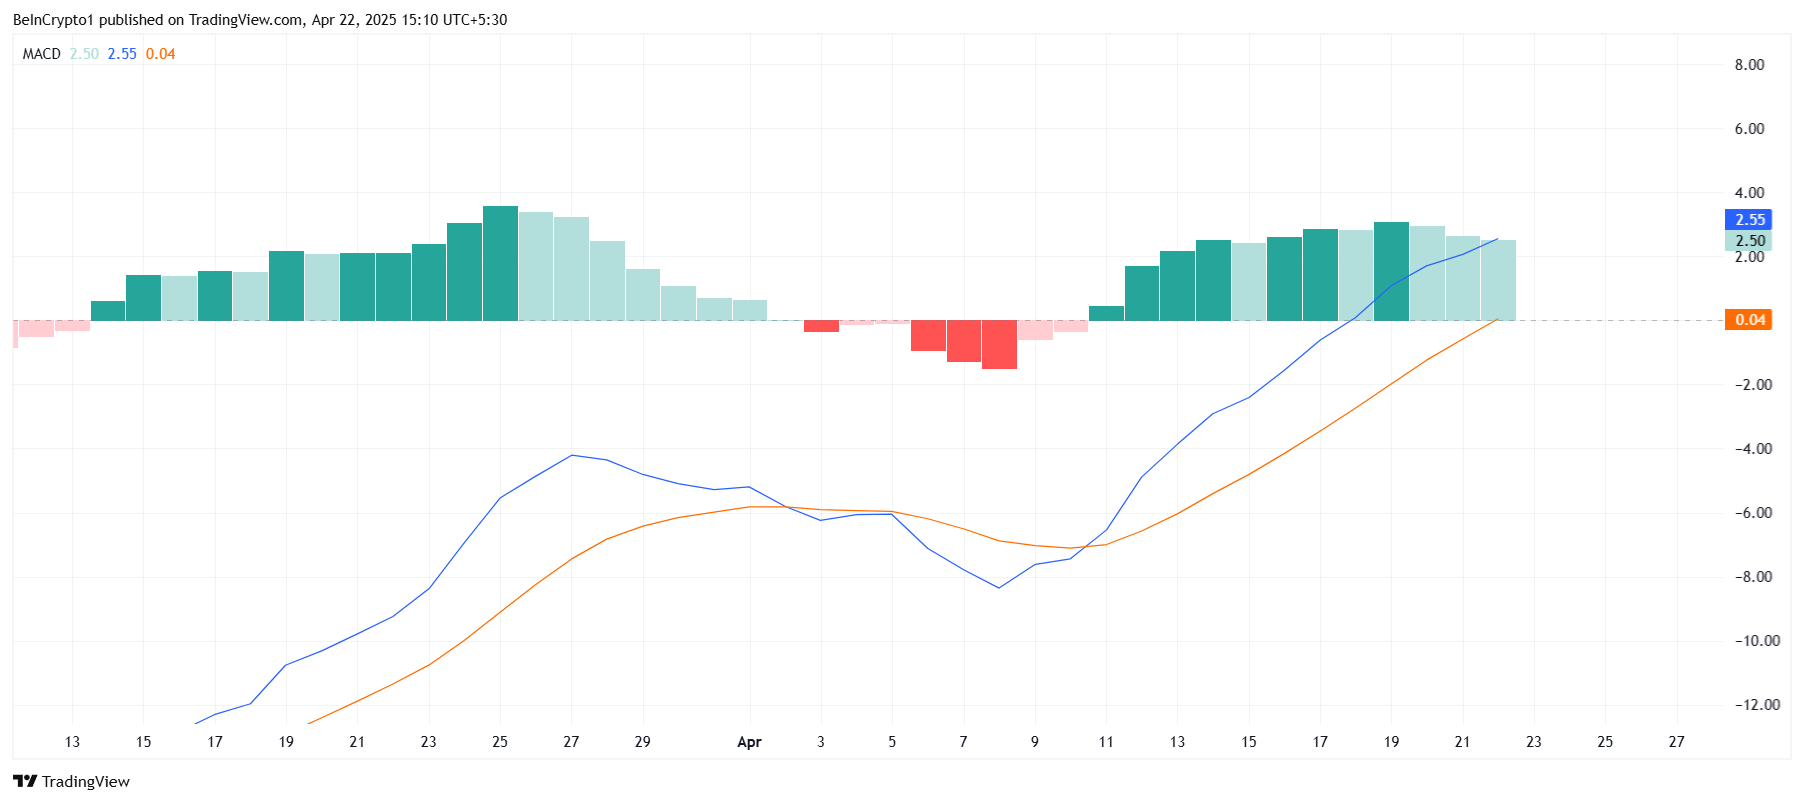
Despite the strong market sentiment, technical indicators such as the MACD suggest that Solana’s bullish momentum is showing some signs of slowing. The MACD histogram has begun to display declining bars, which could indicate that the intensity of the buying pressure is diminishing. While this decline is still mild, it’s worth watching closely for any signs of a shift in momentum.

However, it’s important to note that these fluctuations are part of the typical market cycle. The lack of a significant slowdown in the MACD at this point suggests that Solana has room to grow further, especially if market conditions remain favorable. A consistent rise in price could prompt a renewed surge in demand from investors.

Solana MACD
Solana MACD. Source: TradingView

SOL Price Needs A Boost

Solana is currently trading at $139, with support holding firm at $136. This has helped the altcoin maintain stability despite facing resistance at $148. The price has tested this barrier multiple times in the past six weeks but has failed to breach it, signaling a crucial point for its future direction.

If Solana can overcome the $148 resistance with sustained investor support, it could see a substantial increase, potentially reaching $150 in the coming weeks. Positive market sentiment and increasing active addresses are likely to play a role in helping SOL achieve this target.

Solana Price Analysis.
Solana Price Analysis. Source: TradingView

However, if the altcoin fails to breach $148 once again, it could see a correction toward $123. If this happens, Solana will likely consolidate at that level, and any further drop could invalidate the current bullish outlook.

The post Solana Price Aims At Crossing $150 As Investors’ Activity Hits 2-Month High appeared first on BeInCrypto.

US Bitcoin ETF Records Highest Inflow of $381M in 58 Days

US Bitcoin ETF Records Highest Inflow of $381M in 58 Days

US-based Bitcoin exchange-traded funds (ETFs) experienced their largest single-day net inflow in nearly two months. As per the data, this is the highest daily inflow since January 30, when the funds attracted $588.1 million shortly after Bitcoin price reached its all-time high.

ARK and Fidelity funds show strong Bitcoin ETF performance

The strong inflow on April 21 saw $381.3 million entering the funds. It was widely distributed across multiple ETF providers, with ARK 21Shares Bitcoin ETF (ARKB) capturing the largest share at $116.1 million. Fidelity Wise Origin Bitcoin Fund (FBTC) followed with the second-highest inflow at $87.6 million. The data comes as Bitcoin price has reclaimed the $88,000 level.

Bitcoin ETF Overview: Coinglass

Grayscale, which had previously experienced substantial outflows after converting its Bitcoin trust to an ETF, showed signs of stabilization with its Bitcoin Trust (GBTC) and Bitcoin Mini Trust ETF (BTC) recording combined inflows of $69.1 million.

BlackRock’s iShares Bitcoin Trust ETF (IBIT), which maintains the largest assets under management among the Bitcoin ETFs, attracted $41.6 million, approximately half of what it had received before the weekend trading break on April 17. Other funds including HODL and EZBC also contributed to the day’s positive performance with inflows of $11.7 million and $10.1 million respectively. The positive ETF inflow comes amidst the expectation of the first ever XRP ETF going live.

United States experience continued crypto outflow

While US Bitcoin ETFs saw strong performance on April 21, overall digital asset investment data for the week shows notable geographic variations in investor behavior. According to CoinShares’ weekly report, the overall digital asset investment sector showed modest total inflows of $6 million for the week.

The United States continued to experience net outflows totaling $71 million for the week despite the strong single-day performance on April 21. This suggests that the substantial inflow day was an exception to the generally cautious US investor stance.

Funds Flow by country: CoinShares

In contrast, European markets displayed more positive sentiment toward digital asset investments. Switzerland led with inflows of $43.7 million, followed by Germany with $22.3 million. Canada also contributed positively with $9.4 million in net inflows during the same period.

The CoinShares report highlighted that broader market sentiment fluctuated throughout the week, with stronger-than-expected US retail sales figures that caused significant outflows of $146 million mid-week.

Bitcoin products specifically ended the week with minor outflows of $6 million despite the substantial daily inflow seen in the ETF data. Additionally, short Bitcoin investment products recorded outflows of $1.2 million which was their seventh consecutive week of outflows. These products have now seen investors withdraw approximately 40% of their total assets under management over this period.

The post US Bitcoin ETF Records Highest Inflow of $381M in 58 Days appeared first on CoinGape.

Altcoins That Could 10X As Paul Atkins Becomes SEC Chair

Paul Atkins, a pro-crypto lawyer, has become the new head of the Securities and Exchange Commission (SEC). He replaces Gary Gensler, an official who focused on litigation, filing lawsuits against multiple companies. Therefore, it is likely that some altcoins, such as Hedera Hashgraph (HBAR), Ripple (XRP), and Solana (SOL), will surge 10X after this change in leadership at the agency.

Best Altcoins to Buy for 10X Gains as Paul Atkins Becomes SEC Chair

The crypto market is expected to thrive after the new change in leadership. A likely catalyst for this is that the agency is expected to approve most of the 72 crypto ETFs filed by companies such as Franklin Templeton, Canary, and Grayscale. 

Additionally, the SEC is likely to avoid filing major lawsuits against the crypto sector. XLM, XRP, and SOL will all be beneficiaries of these events.

Hedera Hashgraph  (HBAR)

Hedera Hashgraph is one of the top altcoins that could surge 10x after the recent events at the SEC. That’s because Canary has applied for a spot HBAR ETF, which will likely be approved in the coming months.

HBAR price has also formed a falling wedge pattern on the daily chart. The two lines are nearing their confluence level, while the price has moved slightly above the upper side. Additionally, top oscillators, such as the Relative Strength Index, have formed a bullish divergence pattern, indicating a strong surge. 

Therefore, the HBAR token is likely to experience a strong bullish breakout in the coming months, with a target of $0.2500.

Hedera Price Chart
Hedera Price Chart

Ripple (XRP)

XRP is another top altcoin to buy due to its history with the SEC. The SEC recently concluded its litigation with Ripple, allowing the company to engage in transactions with other financial services industry entities.

The agency is also expected to approve some or all of the ETF applications by companies like Grayscale, Canary, Bitwise, and 21Shares. Such a move is expected to lead to over $8 billion in inflows

XRP price has formed a falling wedge chart pattern, pointing to an eventual rally in the coming weeks. If this happens, the price to watch will be $3, up by 43% from the current level.

XRP Price Chart
XRP Price Chart

Solana (SOL)

Solana is also one of the top altcoins to buy and hold for 10x gains in the near term. Like XRP and HBAR, several companies like Canary and Bitwise have applied for a spot SOL ETF

The coin has also formed a cup-and-handle pattern on the weekly chart. It has a depth of about 96%. Therefore, measuring the same distance from the upper side of this pattern will bring the next target to $500. 

Solana Price Chart
Solana Price Chart

Solana may also benefit from the growing ecosystem, and the fact that some companies like Upexy and Janover have started accumulating the token.

The post Altcoins That Could 10X As Paul Atkins Becomes SEC Chair appeared first on CoinGape.

Why This Bitcoin Price Rally Might Be Fake – Is Crash to $80K Coming Soon?

Why This Bitcoin Price Rally Might Be Fake - Is Crash to $80K Coming Soon?

Bitcoin price has made a bold uptrend this week as it reclaims $90,000 for the first time in nearly two months. This rally has been attributed to a wide range of factors, including rising inflows to spot BTC ETFs, but one analyst has said that this pump might not last as it is simply driven by leverage. Other analysts have also attributed the gains to macro factors like the declining value of the US dollar.

Why This Bitcoin Price Rally May Be Fake 

Bitcoin price is currently approaching its highest level in two months despite growing skepticism among some analysts that this rally might reach exhaustion. Per analyst Maartunn on X, this rally was a “leverage-driven Easter pump” after Bitcoin recently added more than $2 billion in open interest within 24 hours. 

Why This Bitcoin Price Rally Might Be Fake - Is Crash to $80K Coming Soon?
Bitcoin Open Interest

The rising open interest is also seen on Coinglass data after this metric hit $60 billion, which is the highest level in two months. Another analyst known as TXMC observed that the rapid surge in OI indicates that the ongoing BTC price rally might fade. He opined, 

“If Bitcoin ever breaks away into a bona fide decoupling from other risk assets, it won’t be fueled by over $1.5B worth of leveraged futures longs opening in a 24-hour period.” 

Besides the rising BTC’s open interest, TXMC added that this rally is also stemming from the weakening value of the US dollar. The US dollar index has plunged to its lowest level in more than three years amid the ongoing tariff war, and this is benefiting the Bitcoin price. He said,

“Bitcoin priced in dollars is about 7-8% higher than Bitcoin priced in other major currencies, relative to the Jan 20 top.”

The third reason behind the rising BTC value today is the rising inflows to spot BTC ETFs, suggesting that institutions are also buying into the ongoing rally. Data from SoSoValue shows that on April 21, inflows to these products reached $381M, marking the highest level since late January. 

Will BTC Price Crash to $80,000? 

Despite the ongoing concerns about a possible correction in Bitcoin price after the recent rally, the king coin might avoid a crash to $80,000 due to bullish technical indicators and macroeconomic conditions. 

Analyst MerlijnTrader on X shared a bullish Bitcoin price prediction on X after the coin formed a classic double bottom pattern, which often precedes significant upswings. He noted that BTC might drop to test support at the neckline of $86,900 in the near term before resuming the uptrend and possibly flip $100,000.

Why This Bitcoin Price Rally Might Be Fake - Is Crash to $80K Coming Soon?
BTC Price Chart

At the same time, trader DaanCrypto noted that Bitcoin can extend the rally if it makes a decisive daily close above the psychological price level of $90,000. However, if it fails to flip the 200-day MA and the trend reverses to cause a downtrend below the support at $85,000, it could crash to $80,000.

Meanwhile, BitMEX co-founder Arthur Hayes noted that as the US dollar weakens, the US bond market will be in a crisis. This will also attract capital inflow to BTC and support the uptrend as investors choose to abandon the greenback for assets such as crypto and gold.

Therefore, amid these factors, it is likely that the Bitcoin price might avoid a crash to $80,000 in the near term. However, if it faces rejection at $90,000, it might drop to test the support level of $85,000 and consolidate within this range if the selling pressure eases. 

The post Why This Bitcoin Price Rally Might Be Fake – Is Crash to $80K Coming Soon? appeared first on CoinGape.

Bitcoin Price Climbs to Two-Week High of $91K, What Next?

Bitcoin Price Climbs to Two-Week High of $90K, What Next?

Bitcoin price has surged to a two-week high, crossing the $91,000 mark, following a strong period of upward momentum. This marks a significant achievement for BTC, which had faced recent volatility, but now appears to be on an impressive rally.

The Bitcoin price surge has drawn attention from market participants, as several analysts and traders share their views on what might come next for the leading cryptocurrency.

Bitcoin Price Surges Above $91K

Bitcoin’s recent movement has been notable for surpassing crucial resistance levels. The price managed to break through the $88,700 barrier and has set its sights on the next target: the $90,000 to $94,000 range. At press time, BTC price was trading at $91,245, a 3% surge from the intraday low and 7% up in the last week.

According to Daan Crypto Trades, a market analyst, Bitcoin price faces resistance from its 200-day simple moving average (SMA), which sits just above the $89,000 level. In a recent post, Daan emphasized that overcoming these levels is crucial for confirming a continued breakout. He added, “Quite a few resistances close by, but a few percentage moves and you’ll break through all of them.”

Image

Traders have noted the strength of the momentum, pointing out that Bitcoin’s current rally could be part of a larger trend, potentially signalling the start of the third and final leg of the current market cycle. Michael Saylor, the strategy chairman of MicroStrategy, also expressed optimism about Bitcoin’s growth. His simple post, “Bitcoin is Climbing,” resonated with market watchers who believe the cryptocurrency’s value will continue to rise.

Why Is BTC Price Rising Today?

Several factors appear to be contributing to Bitcoin’s recent price climb. One key element is the weakening of the U.S. dollar, which has created a more favourable environment for Bitcoin and other assets.

This is because, as the dollar weakens, Bitcoin has been seen as an inflation hedge, attracting investors. Moreover, the interest in exchange-traded products has also surged, as Bitcoin ETFs in the United States observed the most daily inflows since January 2025. This positive sign indicates that more institutional players are entering the Bitcoin space.

Recently, the famous author of “Rich Dad, Poor Dad,” Robert Kiyosaki, gave his forecast and said that he has no doubt that Bitcoin can easily reach $180k or even $200k by 2025.

Furthermore, despite the continued volatile conditions in the global markets, the price of Bitcoin has remained quite stable. Analysing Bitcoin price movements, Bloomberg analyst Eric Balchunas observed that Bitcoin has shown a negative correlation with stock markets more recently. The global stocks have been under pressure, but Bitcoin rose, suggesting that it can act as a hedge with respect to stocks, especially to portfolios.

What’s Next for Price After Hitting Two-Week High?

After hitting its 14-day high, Bitcoin price will have to break one more level; the consolidation area is between $90,000 and $94,000. Based on these levels, analysts claim that the next reachable level might be $92,000, although some of the experts believe that BTC might even surpass this value despite some worries of a fake bullish breakout.

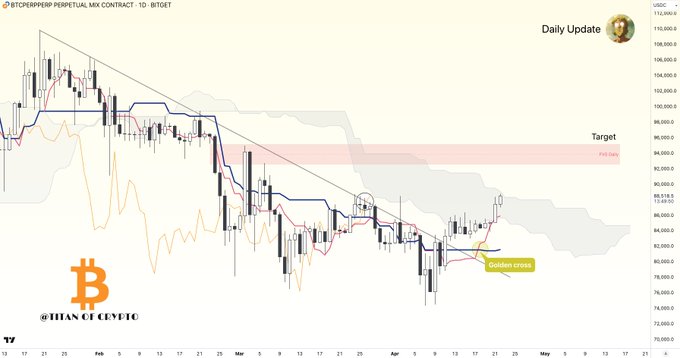
The previous high at the Kumo cloud also acts as a resistance level. In an analysis, Bitcoin is currently at the upper side of the Kumo Cloud, which is a highly resistant region according to crypto analyst Titan of Crypto. Should Bitcoin price close above this level, the next probable target would be the daily Fair Value Gap at $92,000.

Image

According to analyst Crypto Rover, Bitcoin’s long-term outlook also remains positive, with analysts pointing to the increasing supply of long-term holders as another bullish signal. As more investors hold onto their Bitcoin for extended periods, the available supply on exchanges decreases, creating potential upward pressure on the price.

The post Bitcoin Price Climbs to Two-Week High of $91K, What Next? appeared first on CoinGape.

Here is the Timeline for Pepe Coin Price to Rise 7,220% as Ethereum Hits “Legendary” Level

Pepe Coin price could be on the cusp of a mega bullish breakout as technicals and fundamentals align. One PEPE token goes for $0.000008150 and has shown signs that it is bottoming. This article provides a timeline for when PEPE price will rise by 7,220% as Ethereum drops to a legendary level.

Pepe Coin Price to Rebound as Ethereum Drops to ‘Legendary’ Level

One reason the PEPE price has imploded this year is that Ethereum has been in a free fall, moving from $4,100 in November to $1,600 today. In some cases, meme coins drop as their main blockchain falls, and vice versa.

Therefore, a potential Ethereum price rebound would boost PEPE, the second-biggest meme coin in its ecosystem after Shiba Inu. One crypto analyst has taken a contrarian view and predicted that ETH is about to surge after falling to a so-called legendary level. 

He used a three-month candlestick chart of the ETH/BTC pair and identified a double-bottom pattern at 0.01730. The neckline of this pattern was at 0.08825. Therefore, he believes that the token ETH price will eventually rebound and move from the current $1,600 and rise by 525% to get to $10,000 over time. 

The risk, however, is where the ETH/BTC price falls below the double-bottom pattern and invalidates the bullish view. Such a move would also trigger more downside. The other risk is that the Ethereum Foundation is selling ETH, and it has formed a triple-top pattern on the weekly chart.

Ethereum vs Bitcoin Price Chart

Can PEPE Surge by 7,220% to $0.0005856?

A strong Ethereum price surge would trigger more upside for Pepe Coin. However, it is highly unlikely that the coin will have a strong bullish breakout of about 7,220% and get to $0.00005856.

For that to happen, ETH needs to be in a strong bullish rally from the current $1,600 to $10,000 and above. Historically, PEPE tends to do well when the value of ETH is doing well. It will likely take a few years for ETH to reach $10,000, based on its historical performance.

Pepe Coin Price Prediction for 2025

Pepe Coin Price
Pepe Coin Price

On the positive side, there are signs that the Pepe Coin price is on the verge of a strong bullish rally that could push it to its all-time high. It has formed a tiny double-bottom pattern at $0.0000057. Combined with its lowest swing in July last year, it means that it has formed a giant triple-bottom pattern whose neckline is at its all-time high of $0.00002835. 

PEPE price also formed a falling wedge and a bullish divergence pattern. Therefore, the coin will likely keep rising as buyers target the all-time high, which is about 250% above the current level. This positive PEPE price coin prediction will become invalid if it drops below the triple-bottom low of $0.000058.

The post Here is the Timeline for Pepe Coin Price to Rise 7,220% as Ethereum Hits “Legendary” Level appeared first on CoinGape.

Top 3 Best Cryptos to Buy Now for Under $1 — One of Them Is Still at $0.025

muttum-finance-doge

The post Top 3 Best Cryptos to Buy Now for Under $1 — One of Them Is Still at $0.025 appeared first on Coinpedia Fintech News

Not all high-potential cryptocurrencies come with high price tags. In fact, some of the most talked-about tokens trading under $1 today are being quietly accumulated by investors who are focused on long-term value rather than temporary market spikes. With increased retail and institutional interest heading into the second half of the year, sub-dollar tokens are beginning to look like some of the best crypto investments—especially for those looking to build a position ahead of the next market surge.

While many are already familiar with long-established tokens that continue to make headlines, a few newer entrants are showing early signals of serious growth potential. Among them is a project that hasn’t yet hit centralized exchanges—but is already attracting attention for its real utility and well-structured presale pricing.

Before getting into that, here’s a brief look at two better-known names already circulating widely.

Dogecoin (DOGE)

Although it began as a meme coin, Dogecoin continues to be part of conversations about leading cryptocurrencies worth keeping an eye on. With a current price hovering around $0.15, DOGE has managed to maintain strong community support and wide recognition across the industry. Its integration with several payment platforms and consistent visibility in mainstream media have kept it relevant, even in periods of market slowdown. Although its utility remains relatively limited compared to newer DeFi tokens, Dogecoin’s consistent trading volume and long-term presence give it a spot on this list.

TRON (TRX)

TRON is another well-established token trading below $1. At around $0.23, TRX supports a global network focused on decentralized content sharing and high-throughput dApps. Known for its fast transaction speeds and low fees, the TRON blockchain continues to attract developers and users in Asia and beyond. While the project doesn’t generate the same headlines as Ethereum or Solana, it has quietly built a stable ecosystem that supports millions of daily transactions. Its ability to support entertainment platforms and NFT infrastructure makes it a relevant player in the DeFi space.

Mutuum Finance (MUTM)

Mutuum Finance is emerging as one of the lesser-known opportunities in the market, with its token still in presale and available at a price of only $0.025. What sets this project apart isn’t just the entry price—it’s the system behind the token that long-term investors are starting to take seriously.

Mutuum is building a decentralized, non-custodial lending protocol where users will be able to deposit digital assets into smart contracts and earn passive income. Borrowers, meanwhile, can lock their holdings as collateral to receive liquidity without selling off their portfolios. Supported assets will include widely used tokens like ETH, USDC, and DAI, and the platform will offer two distinct lending models—pool-based (P2C) and direct P2P agreements—allowing users to choose between automated liquidity or custom terms.

The platform is still in development, with the team preparing to launch a beta version by the time the token goes live. This makes the current presale stage one of the final chances to enter early, especially with over $6.9 million already raised and more than 8,300 users participating on-chain. Once exchange listings go live, the price is expected to move quickly. 

muttum-finance

The next presale phase will raise the price to $0.03, and projections suggest the token could reach $5 in the coming months, representing nearly 20,000% upside from its current price.

A key highlight of Mutuum’s design is its revenue model. The protocol uses a portion of its income to buy MUTM tokens from the open market, which are then redistributed to users who actively support the platform. This mechanism supports consistent demand for the token while directly rewarding active participants, aligning long-term value with actual protocol engagement.

On top of that, the protocol is preparing to introduce an overcollateralized stablecoin minted directly from deposited collateral. The stablecoin will operate natively within Mutuum’s ecosystem, enhancing liquidity while offering users a stable borrowing option. All interest from stablecoin loans flows into the treasury, further reinforcing the platform’s self-sustaining model.

As smart contract audits move forward and the team prepares to launch a beta version of the platform, Mutuum Finance is gaining traction through its active presale and shaping up to be a strong player in the DeFi sector. For investors looking for the best cryptocurrency under $1 with real-world use and long-term upside, MUTM stands out—not just for its price today, but for where it’s likely headed next.

For more information about Mutuum Finance (MUTM) visit the links below:

The post Top 3 Best Cryptos to Buy Now for Under $1 — One of Them Is Still at $0.025 appeared first on Coinpedia Fintech News
Not all high-potential cryptocurrencies come with high price tags. In fact, some of the most talked-about tokens trading under $1 today are being quietly accumulated by investors who are focused on long-term value rather than temporary market spikes. With increased retail and institutional interest heading into the second half of the year, sub-dollar tokens are …

Startup Village Balkan: 10 Days of Building, Pitching & Plotting Big Things in Split (Croatia)

Balkan Startup Village is turning the Split Technology Park into a full-blown playground for founders, builders, and Web3 misfits who are actually here to get things done. Less talk, more coworking. Less hype, more pitch decks.

You’ll find everything from hands-on workshops and panels (think DePIN, AI, infra, gaming, Web3 marketing: you know, the stuff we all keep saying we need to “double down on”) to casual fireside chats, a solid Demo Day, and yes – a couple of airsoft battles and city tours to balance it out.

No ticket fees. No velvet ropes. Just open space to build, learn, and meet people who are actually building cool stuff, like the folks from Solana ID, Metaplex, Solflare, dReader, Ceres, Kamino Finance, Limechain and a bunch more.

Come early to claim your coworking corner, drop into a few panels, or stick around for Demo Day and catch some of the region’s sharpest startups pitching live. There’s even a podcast zone, career speed dating (still cooking), and a founder’s dinner if you’re lucky enough to score an invite.

They’re tagging along as a media partner, so expect interviews, daily recaps, and behind-the-scenes coverage straight from Split. But honestly, you kind of have to be there.

Event link

The post Startup Village Balkan: 10 Days of Building, Pitching & Plotting Big Things in Split (Croatia) appeared first on BeInCrypto.

Bitcoin Breaks Above $90,000 After 7 Weeks – What’s Next?

Bitcoin (BTC) broke above the $90,000 mark for the first time since March 5, as momentum indicators flash increasingly bullish signals. The latest surge comes alongside a sharp rise in ADX, a bullish Ichimoku Cloud formation, and EMA alignment favoring continued upside.

With buying pressure outweighing selling activity and ETF inflows hitting a three-month high, market sentiment is leaning in favor of the bulls. If resistance is breached, BTC could open the path toward $100,000, reinforcing its role as a hedge amid broader market uncertainty.

Bitcoin Bulls Regain Control as ADX Signals Strengthening Uptrend

Bitcoin’s Directional Movement Index (DMI) is signaling a significant shift in momentum, with its ADX rising sharply to 29.48 — up from just 15.3 two days ago.

The ADX, or Average Directional Index, measures the strength of a trend regardless of its direction. Readings below 20 indicate a weak or sideways market, while values above 25 suggest a strong trend is forming.

With ADX now nearing 30, the current move is gaining traction, confirming that a clearer directional trend is taking hold.

BTC DMI.
BTC DMI. Source: TradingView.

Looking deeper into the DMI components, the +DI (positive directional indicator) currently stands at 30.99 — nearly doubling from 15.82 two days ago, though slightly down from its 37.61 peak yesterday.

This suggests that while buying pressure surged recently, it has eased slightly in the last 24 hours. Meanwhile, the -DI (negative directional indicator) has dropped sharply to 10.86 from 22.48, indicating a clear weakening of selling pressure.

The combination of a strong ADX and a high +DI versus a declining -DI implies that bulls are currently in control. If the trend holds, Bitcoin may continue its upward trajectory in the short term.

Bitcoin Trend Strengthens With Clear Bullish Momentum Signal

Bitcoin’s Ichimoku Cloud chart is showing clear bullish signals. Price action is well above the Kumo (cloud), indicating strong upward momentum.

The cloud itself has flipped from red to green, signaling a transition from bearish to bullish sentiment.

The Tenkan-sen (blue line) remains above the Kijun-sen (red line), reinforcing the short-term bullish bias. The gap between them continues to widen, a sign of strengthening momentum.

BTC Ichimoku Cloud.
BTC Ichimoku Cloud. Source: TradingView.

Additionally, the future cloud (Senkou Span A and B) is angled upward. This suggests that the bullish trend could persist if current conditions hold.

The Chikou Span (green lagging line) is also positioned above the price candles and the cloud, confirming trend alignment from a lagging perspective.

Together, these elements point to a healthy uptrend, with no immediate signs of reversal unless a strong breakdown below the Tenkan-sen or the cloud emerges.

Bitcoin Eyes New Breakouts as Bullish Momentum Builds

Bitcoin’s EMA lines are bullish, with short-term averages positioned above the longer-term ones, signaling strong upward momentum.

Bitcoin’s price is approaching a key resistance level at $92,920. A breakout above this zone could open the door for further gains.

If buying pressure intensifies, a potential target of $96,484 could be reached, as Bitcoin ETFs are registering their biggest net inflows in three months.

The current structure suggests that bulls remain in control, as long as support levels are respected and upward momentum persists.

According to Tracy Jin, COO of crypto exchange MEXC, Bitcoin’s recent performance has been reviving its label as “digital gold”:

“Bitcoin’s recent strength in the face of market-wide volatility is reviving its long-dormant status as a “digital gold.” With U.S. equities slipping back to tariff-era lows and the dollar plunging to a three-year nadir, Bitcoin’s ability to post gains is reshaping investor perception.” Jin told BeInCrypto.

BTC Price Analysis. Source: TradingView.

However, if the trend loses strength and a reversal takes place, Bitcoin could face a short-term pullback toward the support at $88,800.

A break below this level would weaken the structure and increase the chances of deeper corrections. The next key areas to watch are $86,532 and $83,133.

The post Bitcoin Breaks Above $90,000 After 7 Weeks – What’s Next? appeared first on BeInCrypto.