Helium Network Announces Strategic Partnership With AT&T: What Next for $HNT Price?

The post Helium Network Announces Strategic Partnership With AT&T: What Next for $HNT Price? appeared first on Coinpedia Fintech News
- The AT&T subscribers can connect to Helium’s community-built Wi-Fi network.
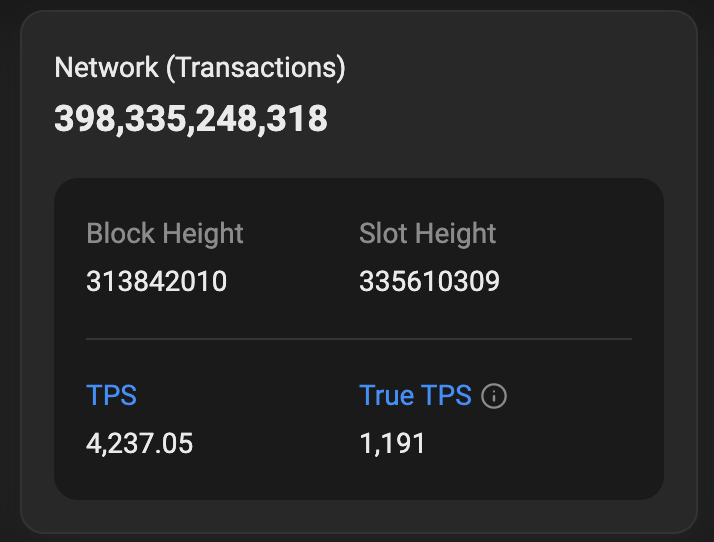
- The Helium network has grown to over 800k daily users, thus increasing the utility of HNT tokens.
- The HNT price is on the cusp of at least a 100 percent rally following a successful bullish rebound.
Helium (HNT) network, a decentralized physical infrastructure network (DePIN), announced a strategic partnership with AT&T Inc. (NYSE: T), a veteran telecommunication company with a significant presence in the North American market. The two entities intend to enhance WiFi coverage across the United States,
Furthermore, AT&T subscribers can now connect to Helium’s community-built WiFi network, which consists of more than 93.5k community-operated WiFi hotspots. In the past, several mobile carriers – led by Telefónica’s Movistar and other Mobile Network Operators (MNOs) and Mobile Virtual Network Operators (MVNOs) – have joined the Helium network to enhance their WiFi coverage.
“Working with AT&T is a massive step forward in our mission to bring affordable and accessible connectivity to the masses. Teaming up with such a global leader in the industry allows us to rapidly accelerate the adoption of Helium and provide real-world value to both AT&T and their subscribers,” Amir Haleem, Co-founder of Helium and CEO of Helium Mobile, noted.
HNT Price Ready for Liftoff
Following the collaboration announcement, HNT’s price gained nearly 6 percent to trade at about $3.79 on Thursday, during the mid-North American trading session. As a result, the small-cap altcoin, with a fully diluted valuation of about $844 billion and a 24-hour average trading volume of about $20 million, has gained over 44 percent in the past two weeks.
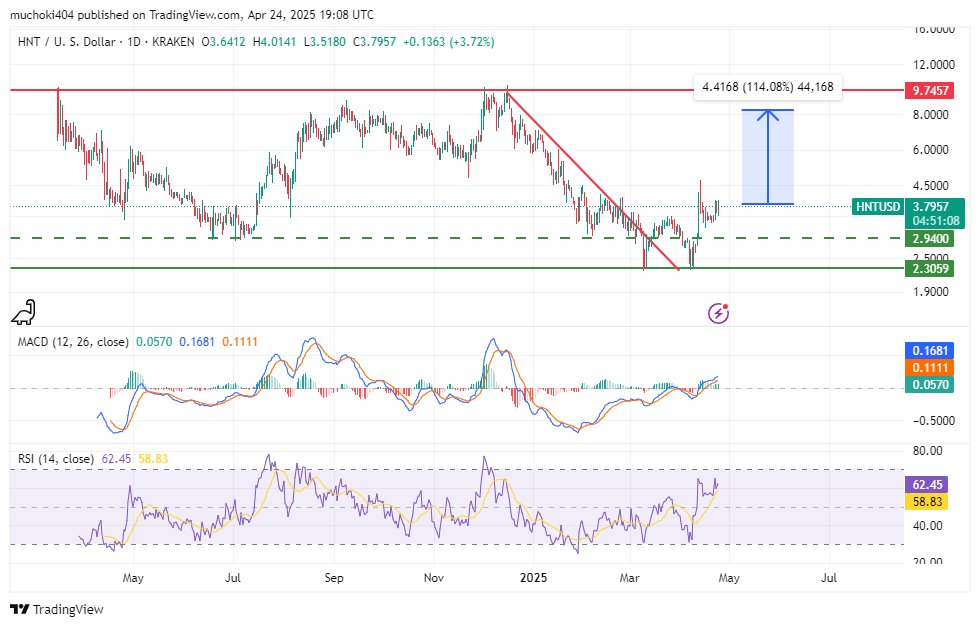
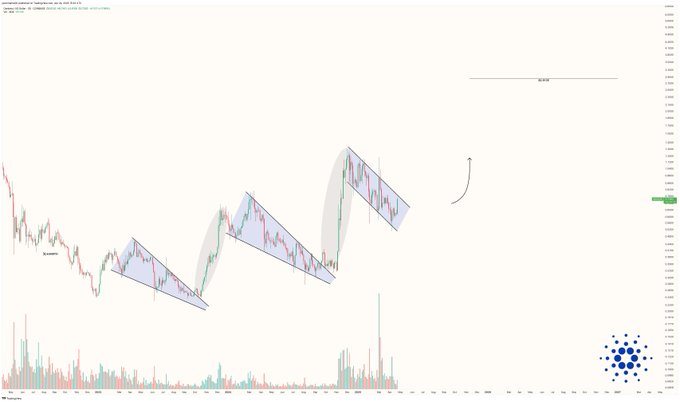
In the daily timeframe, HNT price has already retested the recent macro bullish breakout, and on the cusp of rallying towards a crucial resistance level around $9.7 in the coming weeks. Moreover, the daily MACD has already crossed above the signal line for the first time in 2025, signaling the buyers are gaining momentum.
The post Helium Network Announces Strategic Partnership With AT&T: What Next for $HNT Price? appeared first on Coinpedia Fintech News
The AT&T subscribers can connect to Helium’s community-built Wi-Fi network. The Helium network has grown to over 800k daily users, thus increasing the utility of HNT tokens. The HNT price is on the cusp of at least a 100 percent rally following a successful bullish rebound. Helium (HNT) network, a decentralized physical infrastructure network (DePIN), …