Solana’s On-chain Metrics Continue to Struggle Despite Price Recovery: What’s Next for SOL Price?

The post Solana’s On-chain Metrics Continue to Struggle Despite Price Recovery: What’s Next for SOL Price? appeared first on Coinpedia Fintech News
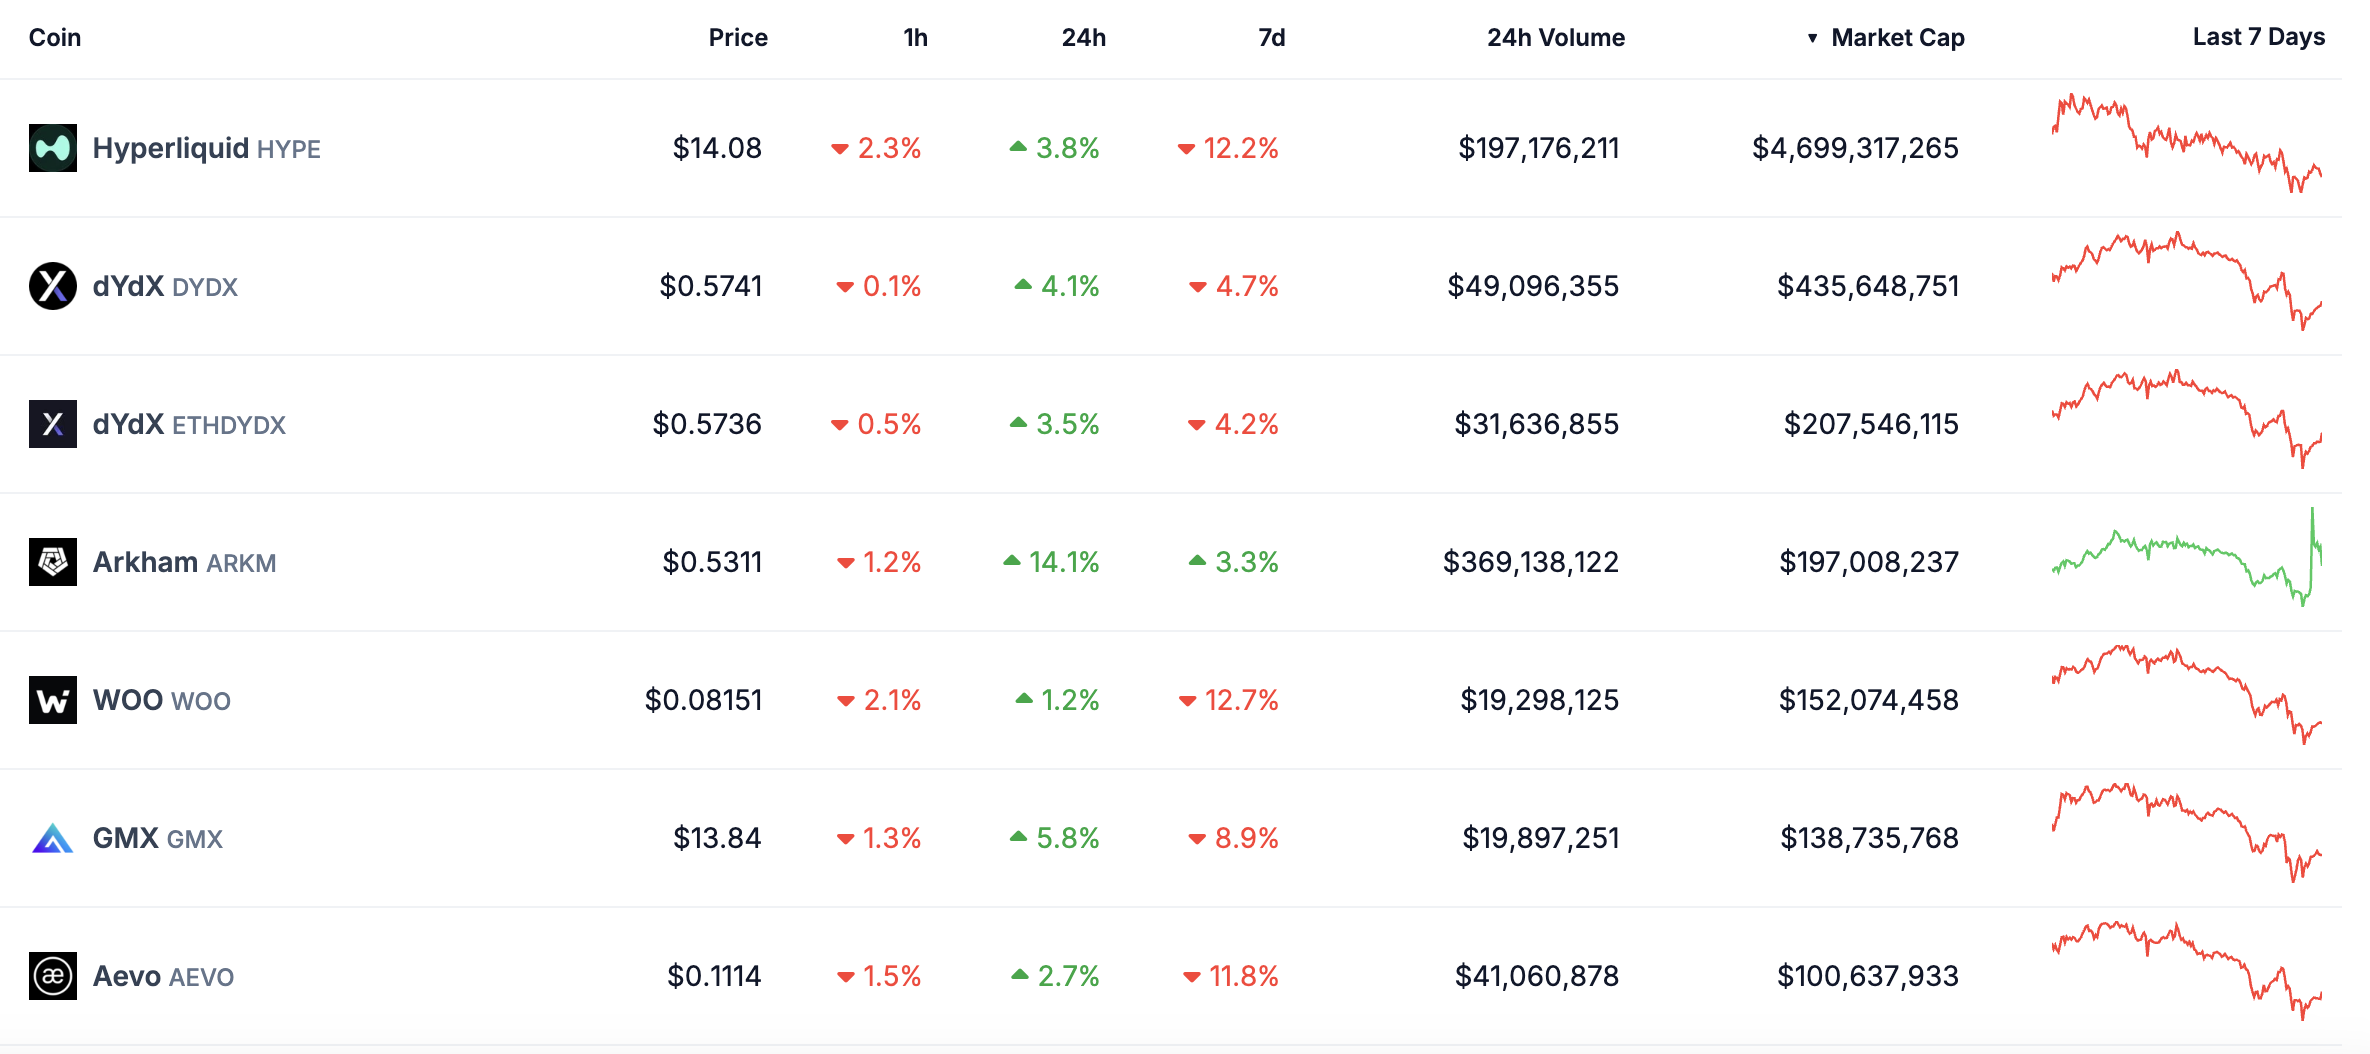
The crypto market is experiencing a significant decline, triggered by global trade tensions. Moreover, President Trump’s Executive Order to set up a Strategic Bitcoin Reserve has surprisingly left crypto traders feeling let down. As a result, the price of Solana has fallen sharply, along with a decrease in important on-chain metrics. Despite a recent recovery from its lows, the price of Solana appears likely to fall below $100 soon.
Solana’s Realized Price Drops to 3-Year Low
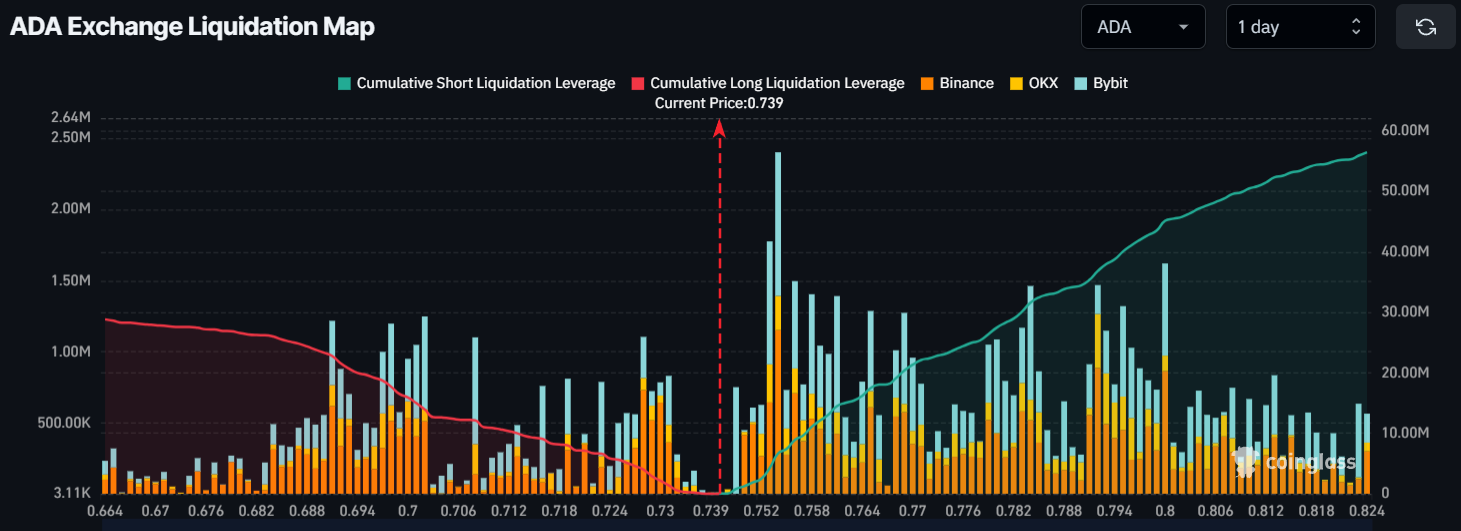
Over the last 24 hours, SOL price witnessed nearly equal domination among buyers and sellers. Data from Coinglass shows that Solana faced a total liquidation of around $27.3 million. Of this, buyers liquidated $15.7 million and sellers closed $11.6 million worth of positions.
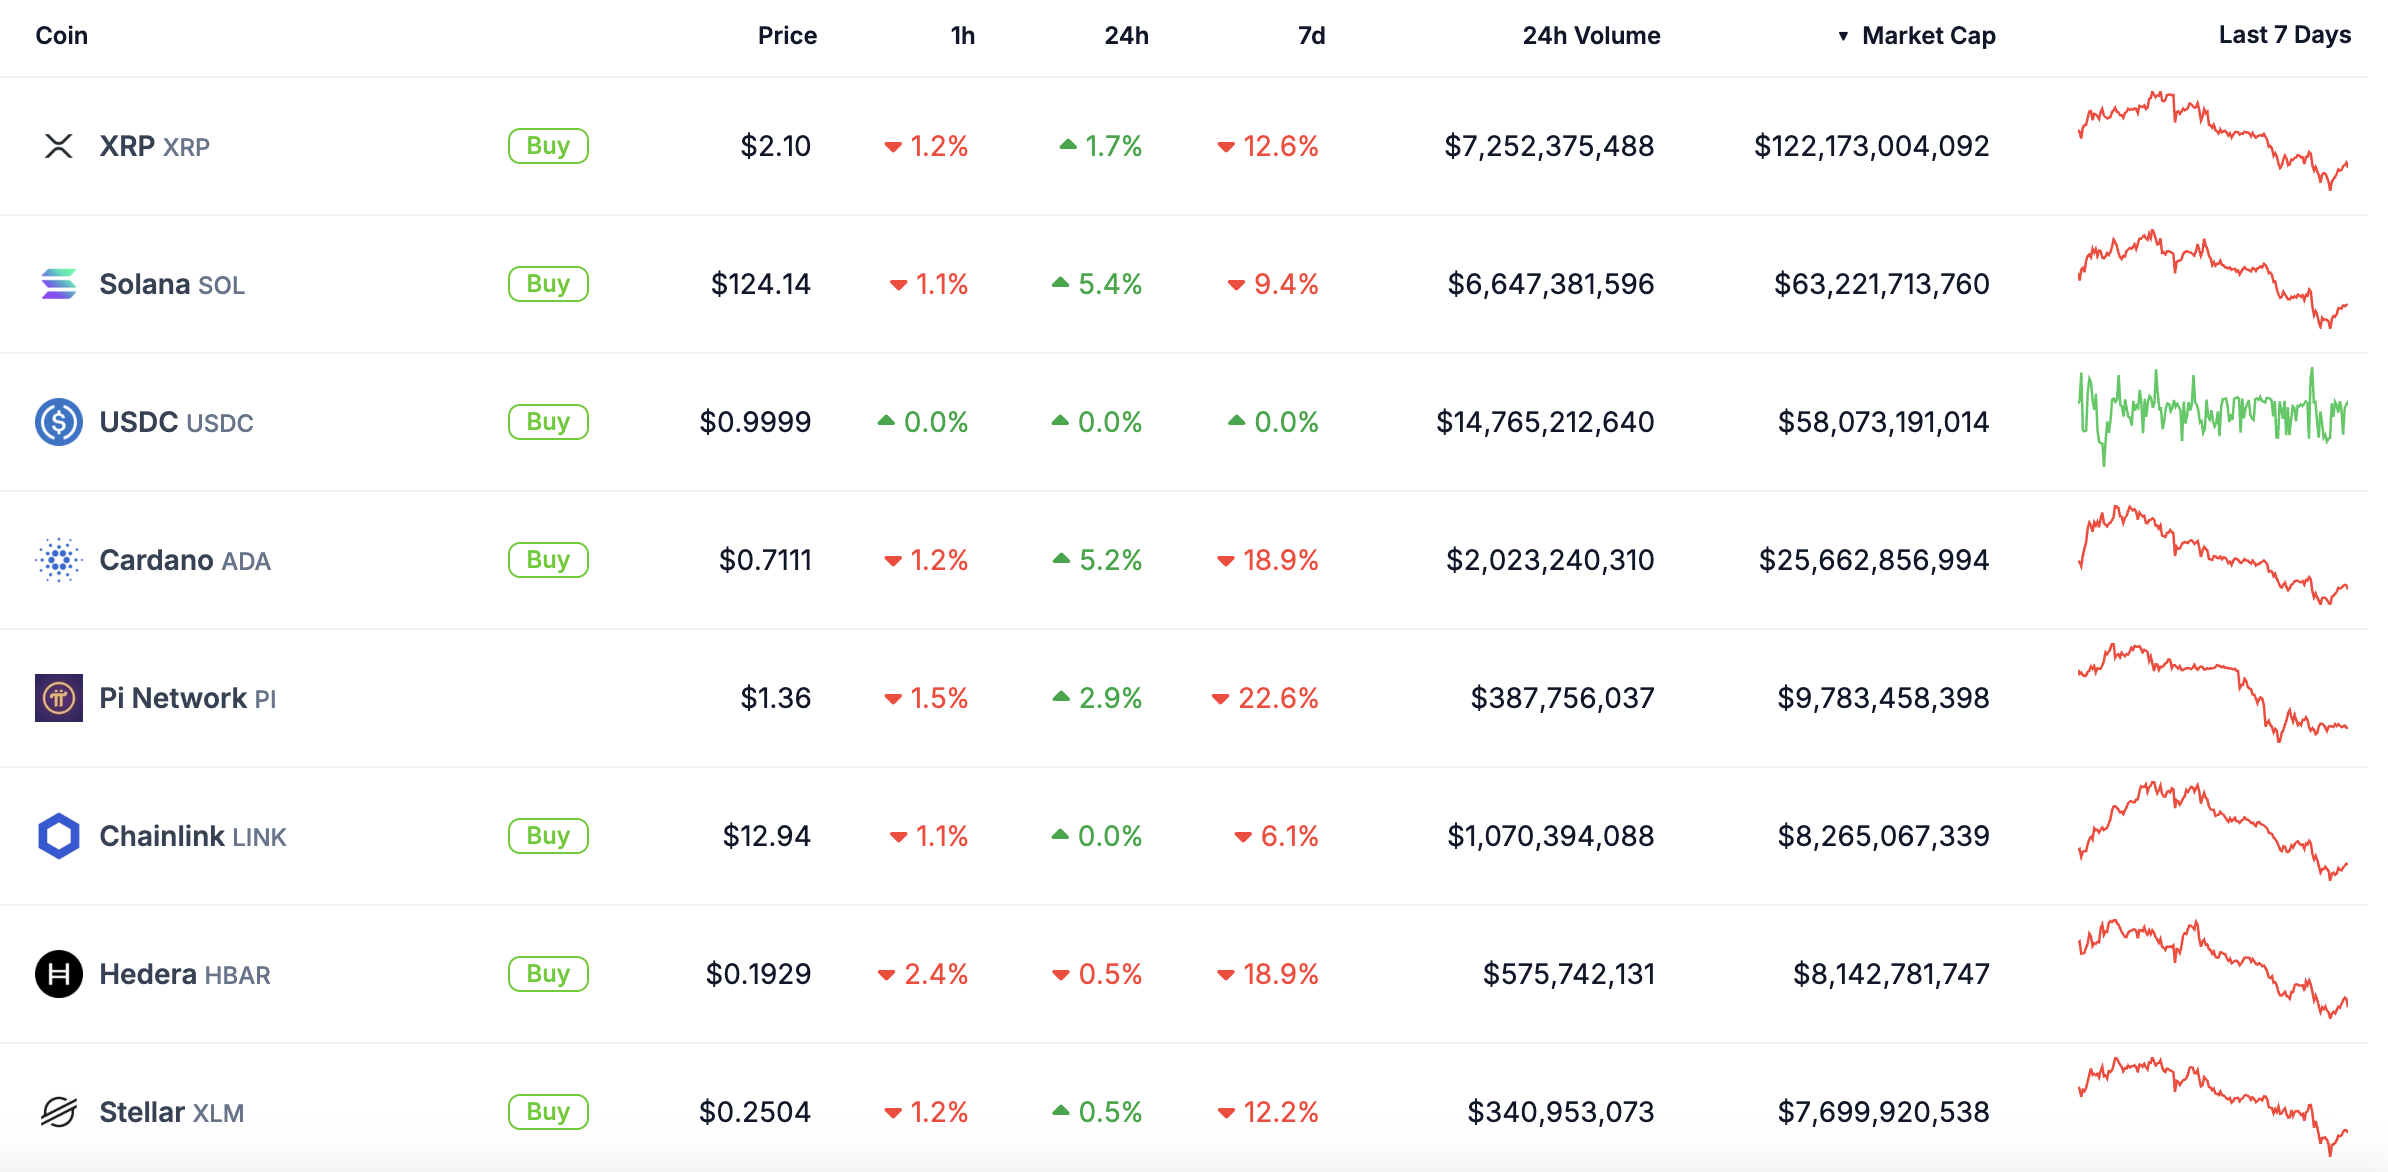
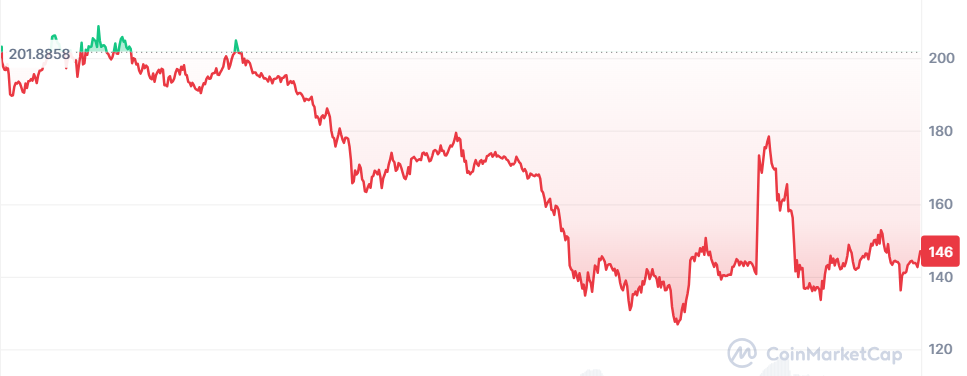
Solana’s SOL faced turbulent times as it plunged by 15% to $114 amid a severe downturn in the crypto market today. This marked the first time the token fell below its realized price of $134 since May 2022, based on data from Glassnode.
Also read: Will Solana (SOL) Reclaim $180? Key Chart Signals Massive Move
The realized price, which represents the average cost basis of all coins last moved, suggests that the average holder is now facing losses. This situation is typically seen as a bearish indicator and may lead to panic selling or capitulation.
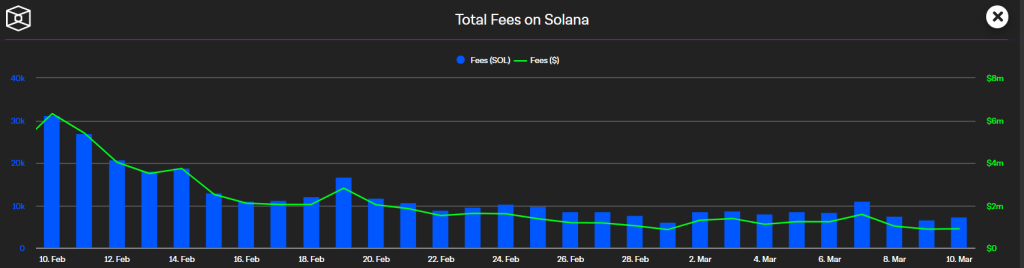
Additionally, Solana’s revenue dropped by 93% to around $4 million, the lowest it has been since September 2024. Additionally, the income from its decentralized applications (DApps) fell by 86%, from $238 million in mid-January to just $32 million by March 2025.
In the wake of these downturns, the total value locked (TVL) in Solana’s DeFi ecosystem also halved, dropping from a January peak of more than $12 billion to roughly $6.38 billion, as reported by DeFiLlama.
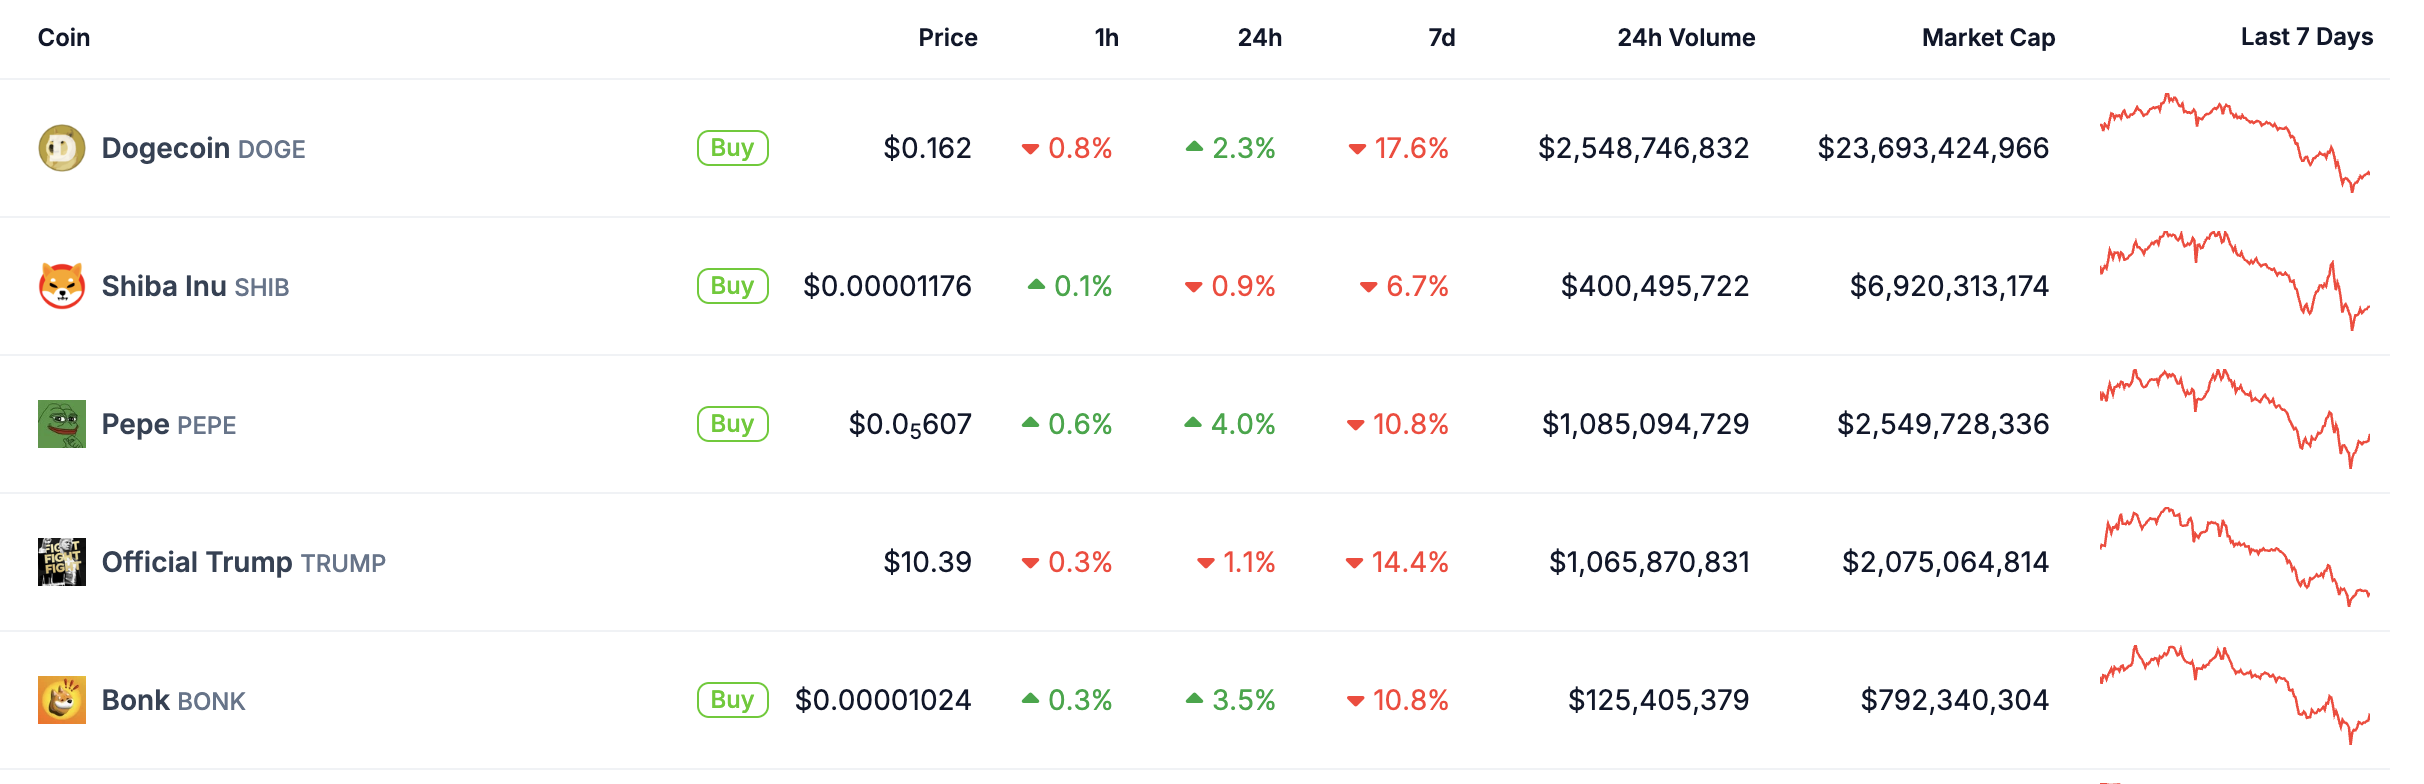
It’s not surprising that Solana experienced a significant drop as interest in memecoins within the crypto community dropped. After reaching its all-time high in January, SOL’s value has fallen by nearly 57%.
What’s Next for SOL Price?
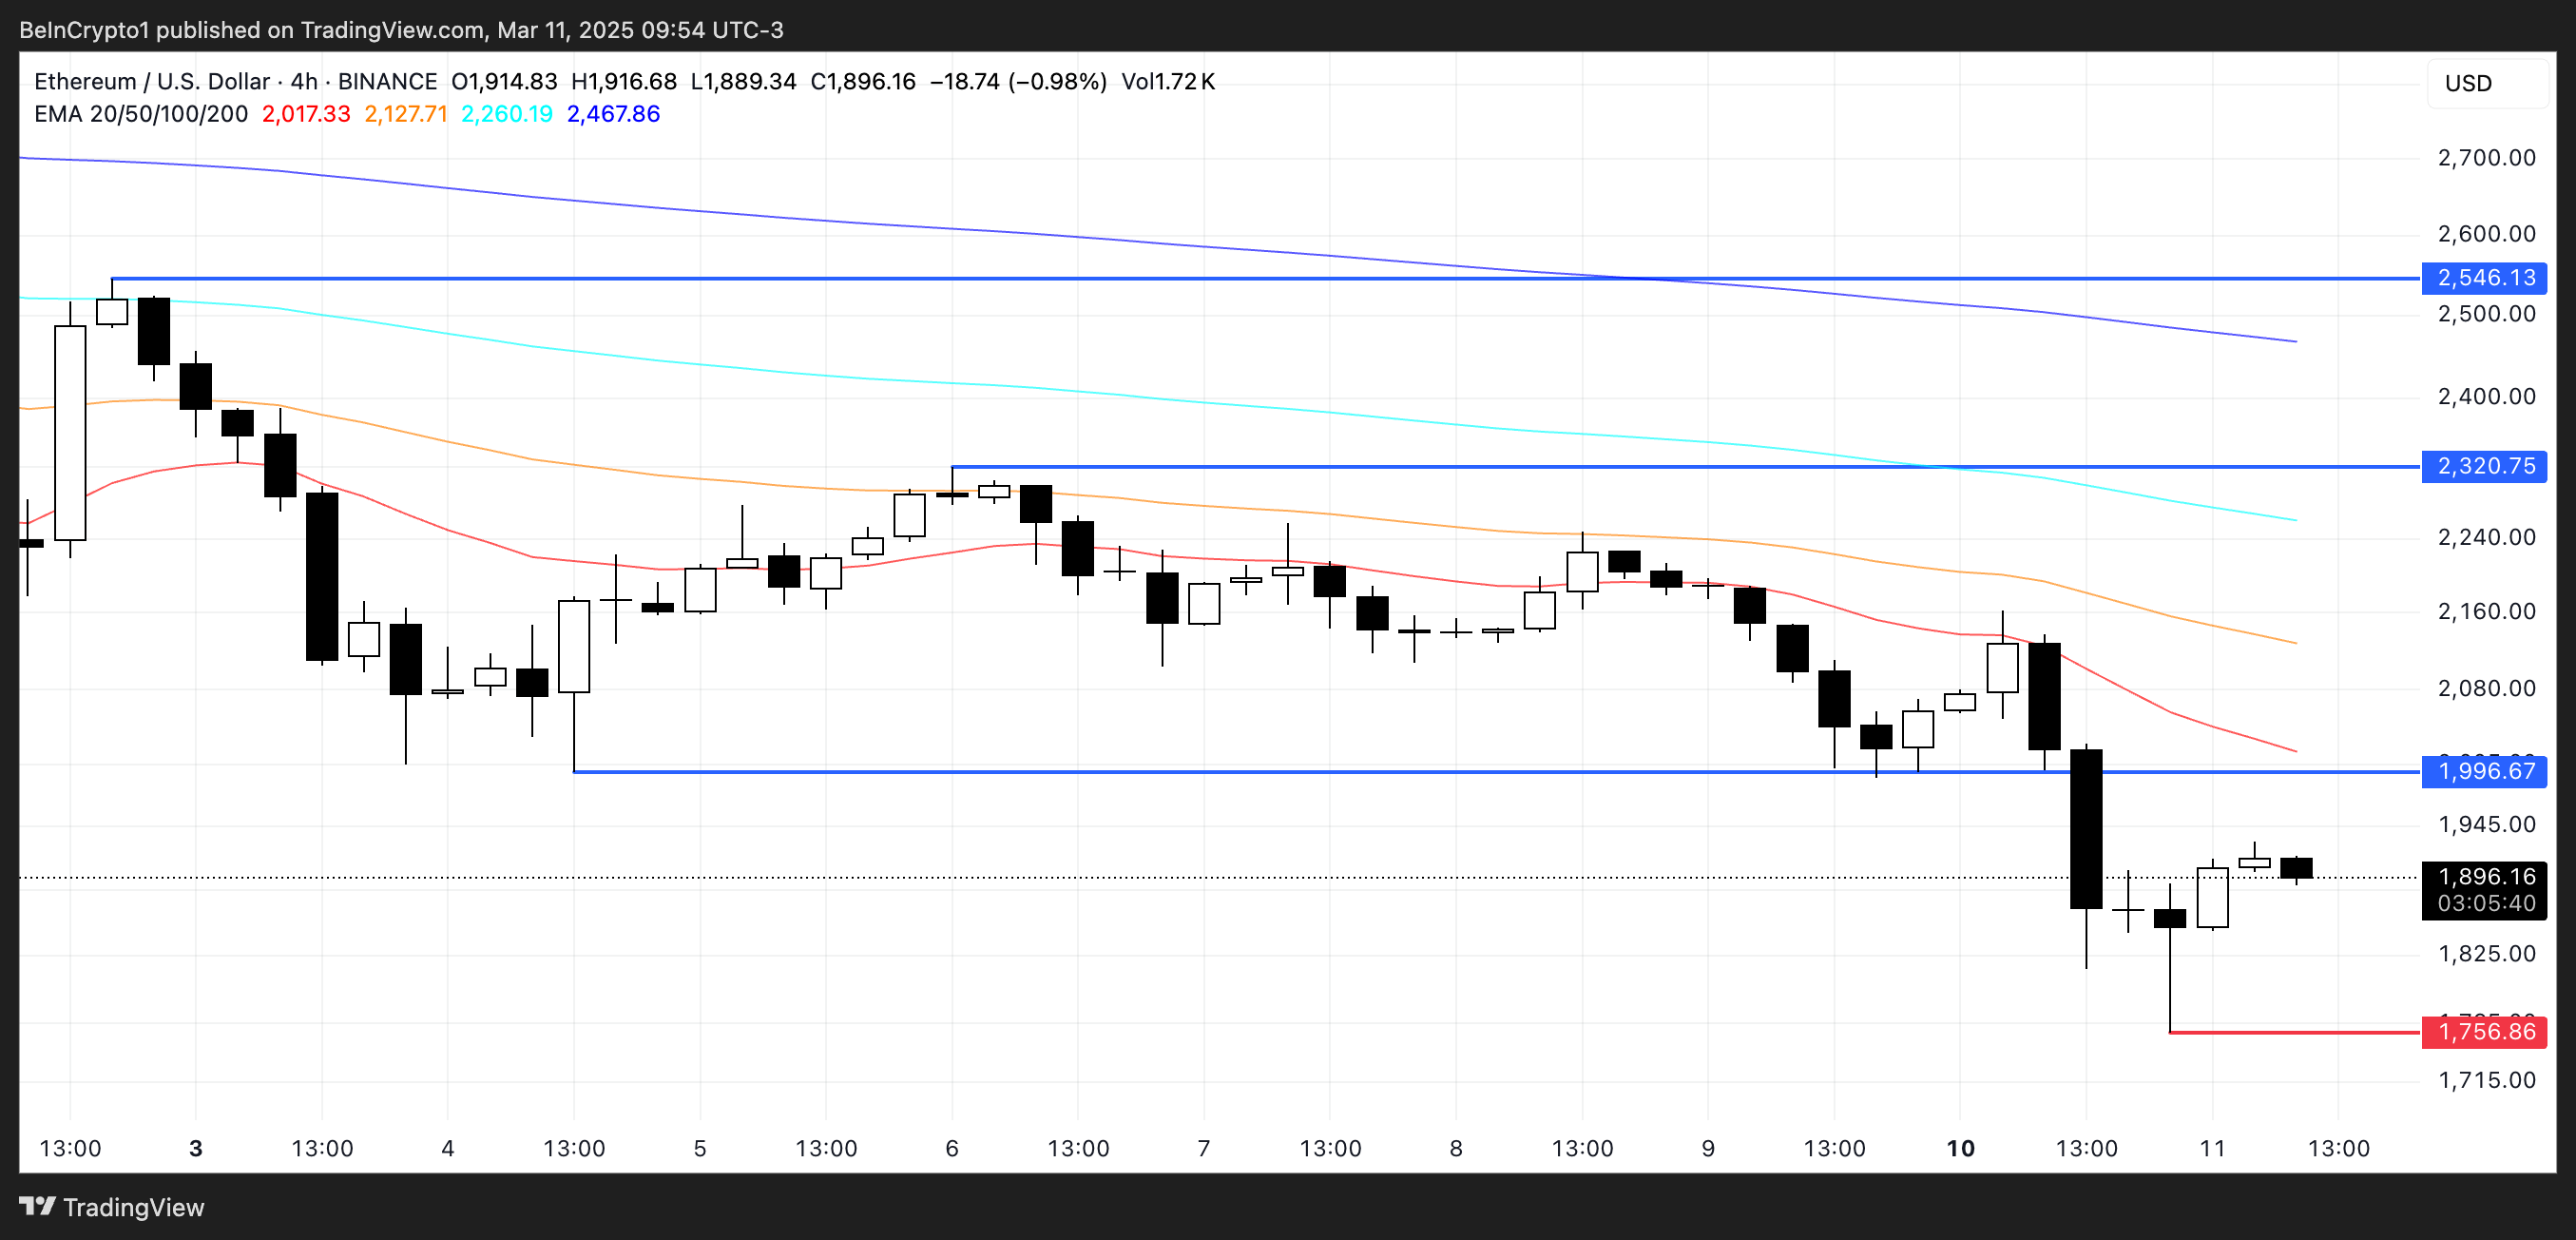
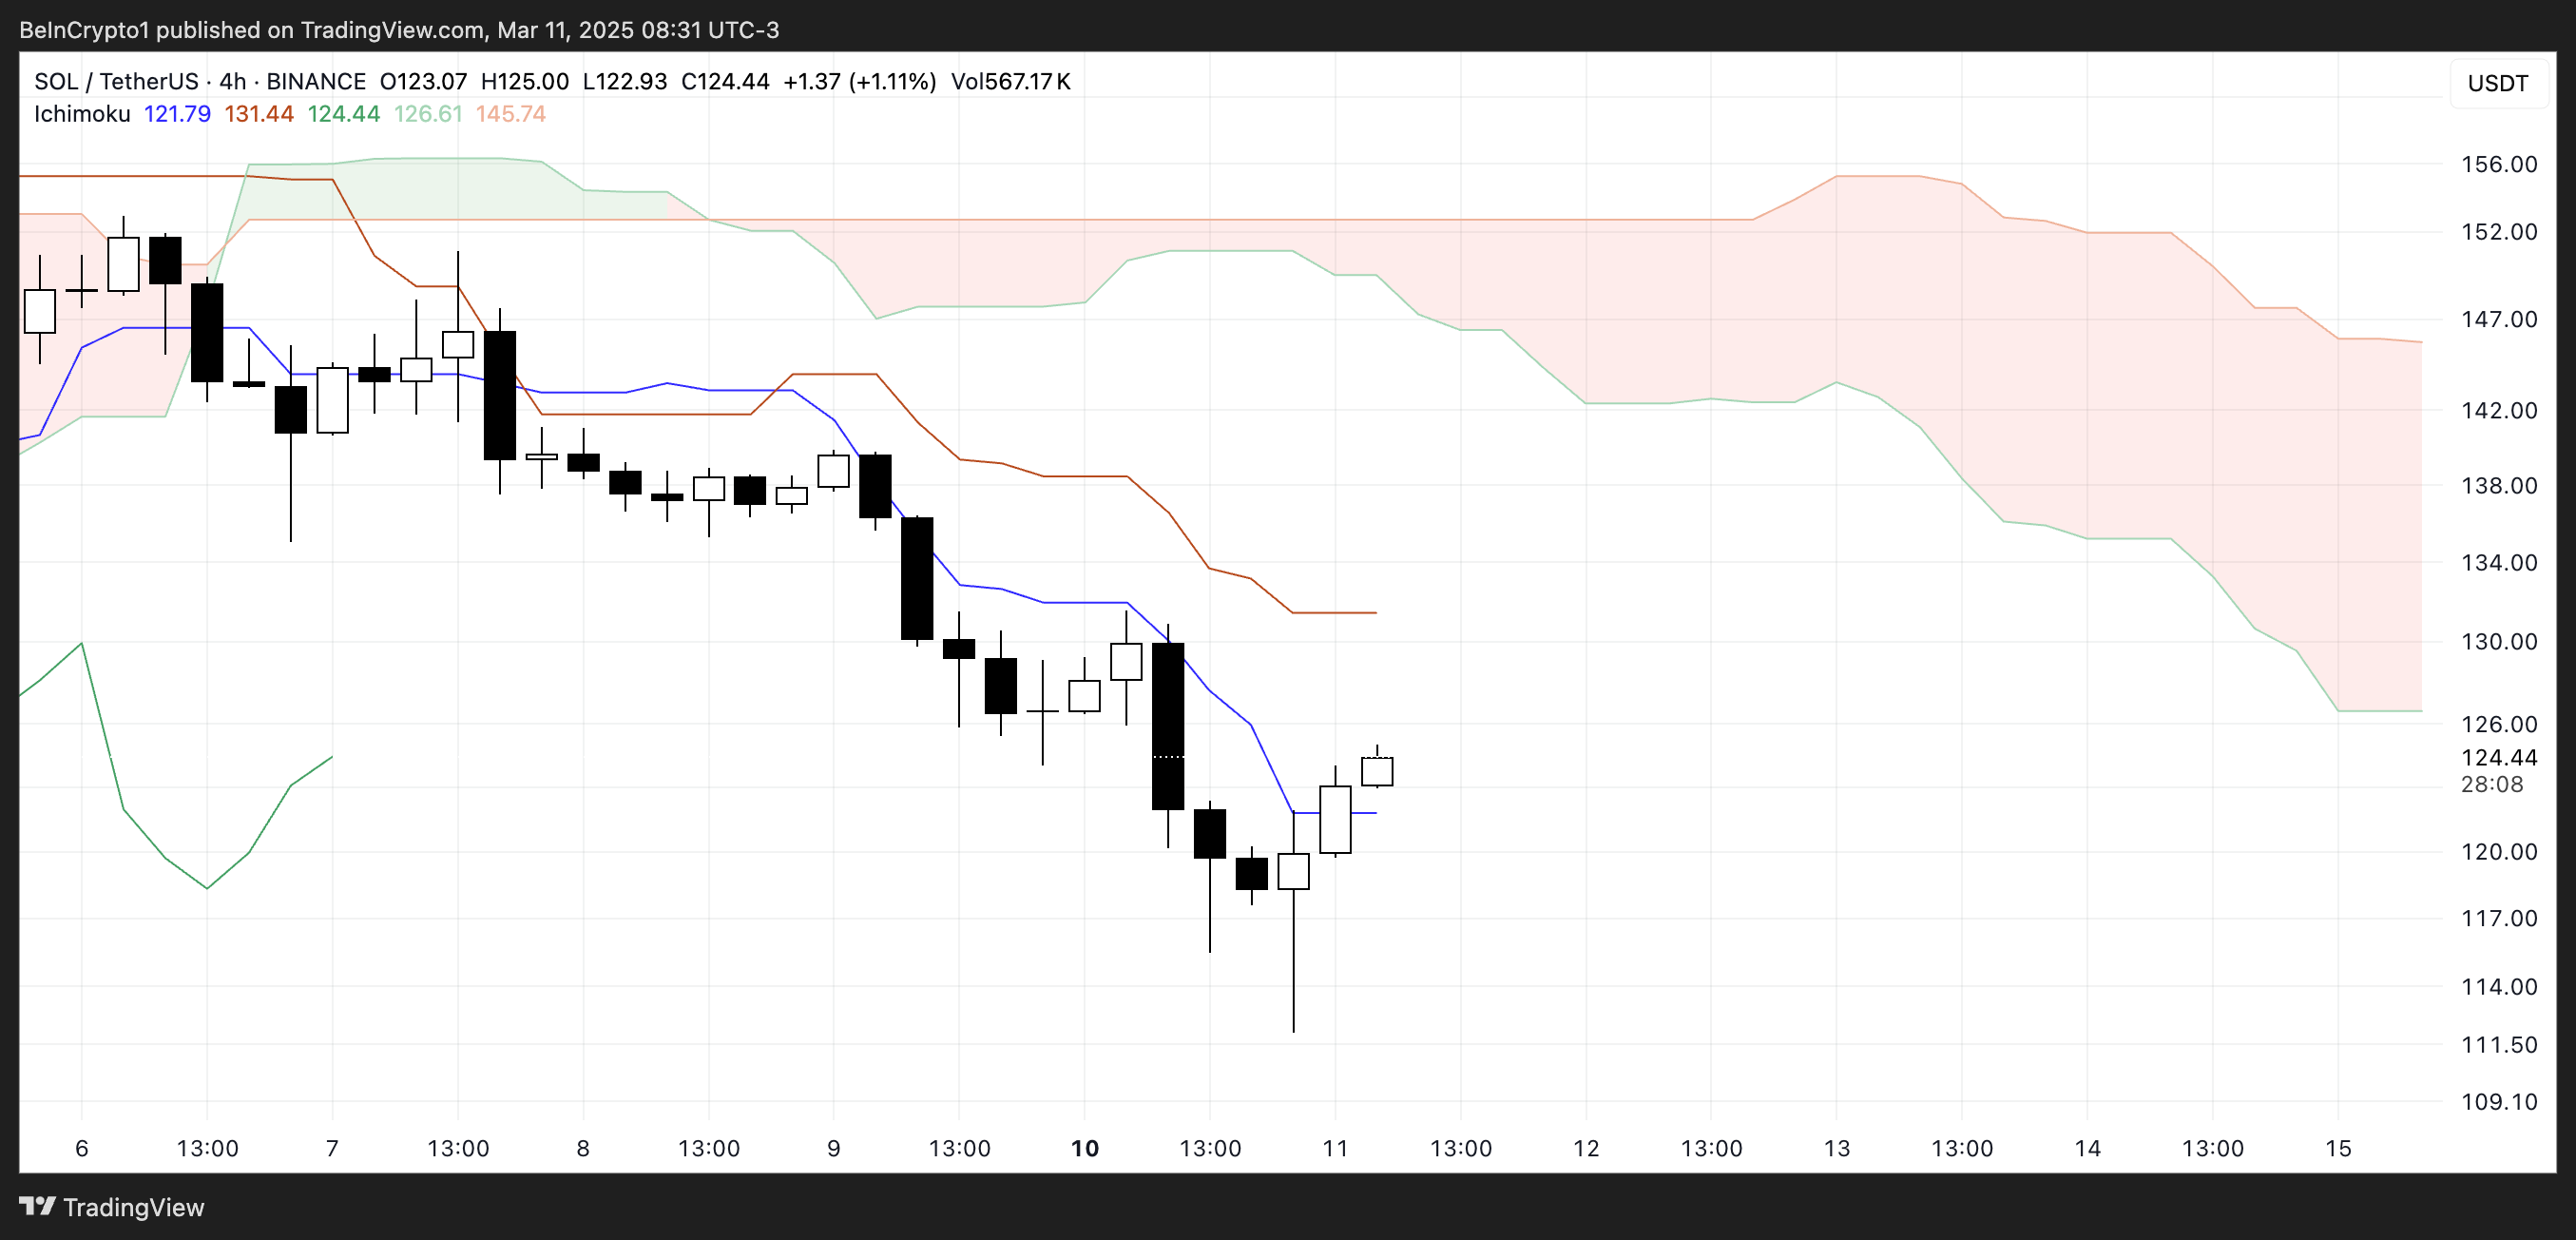
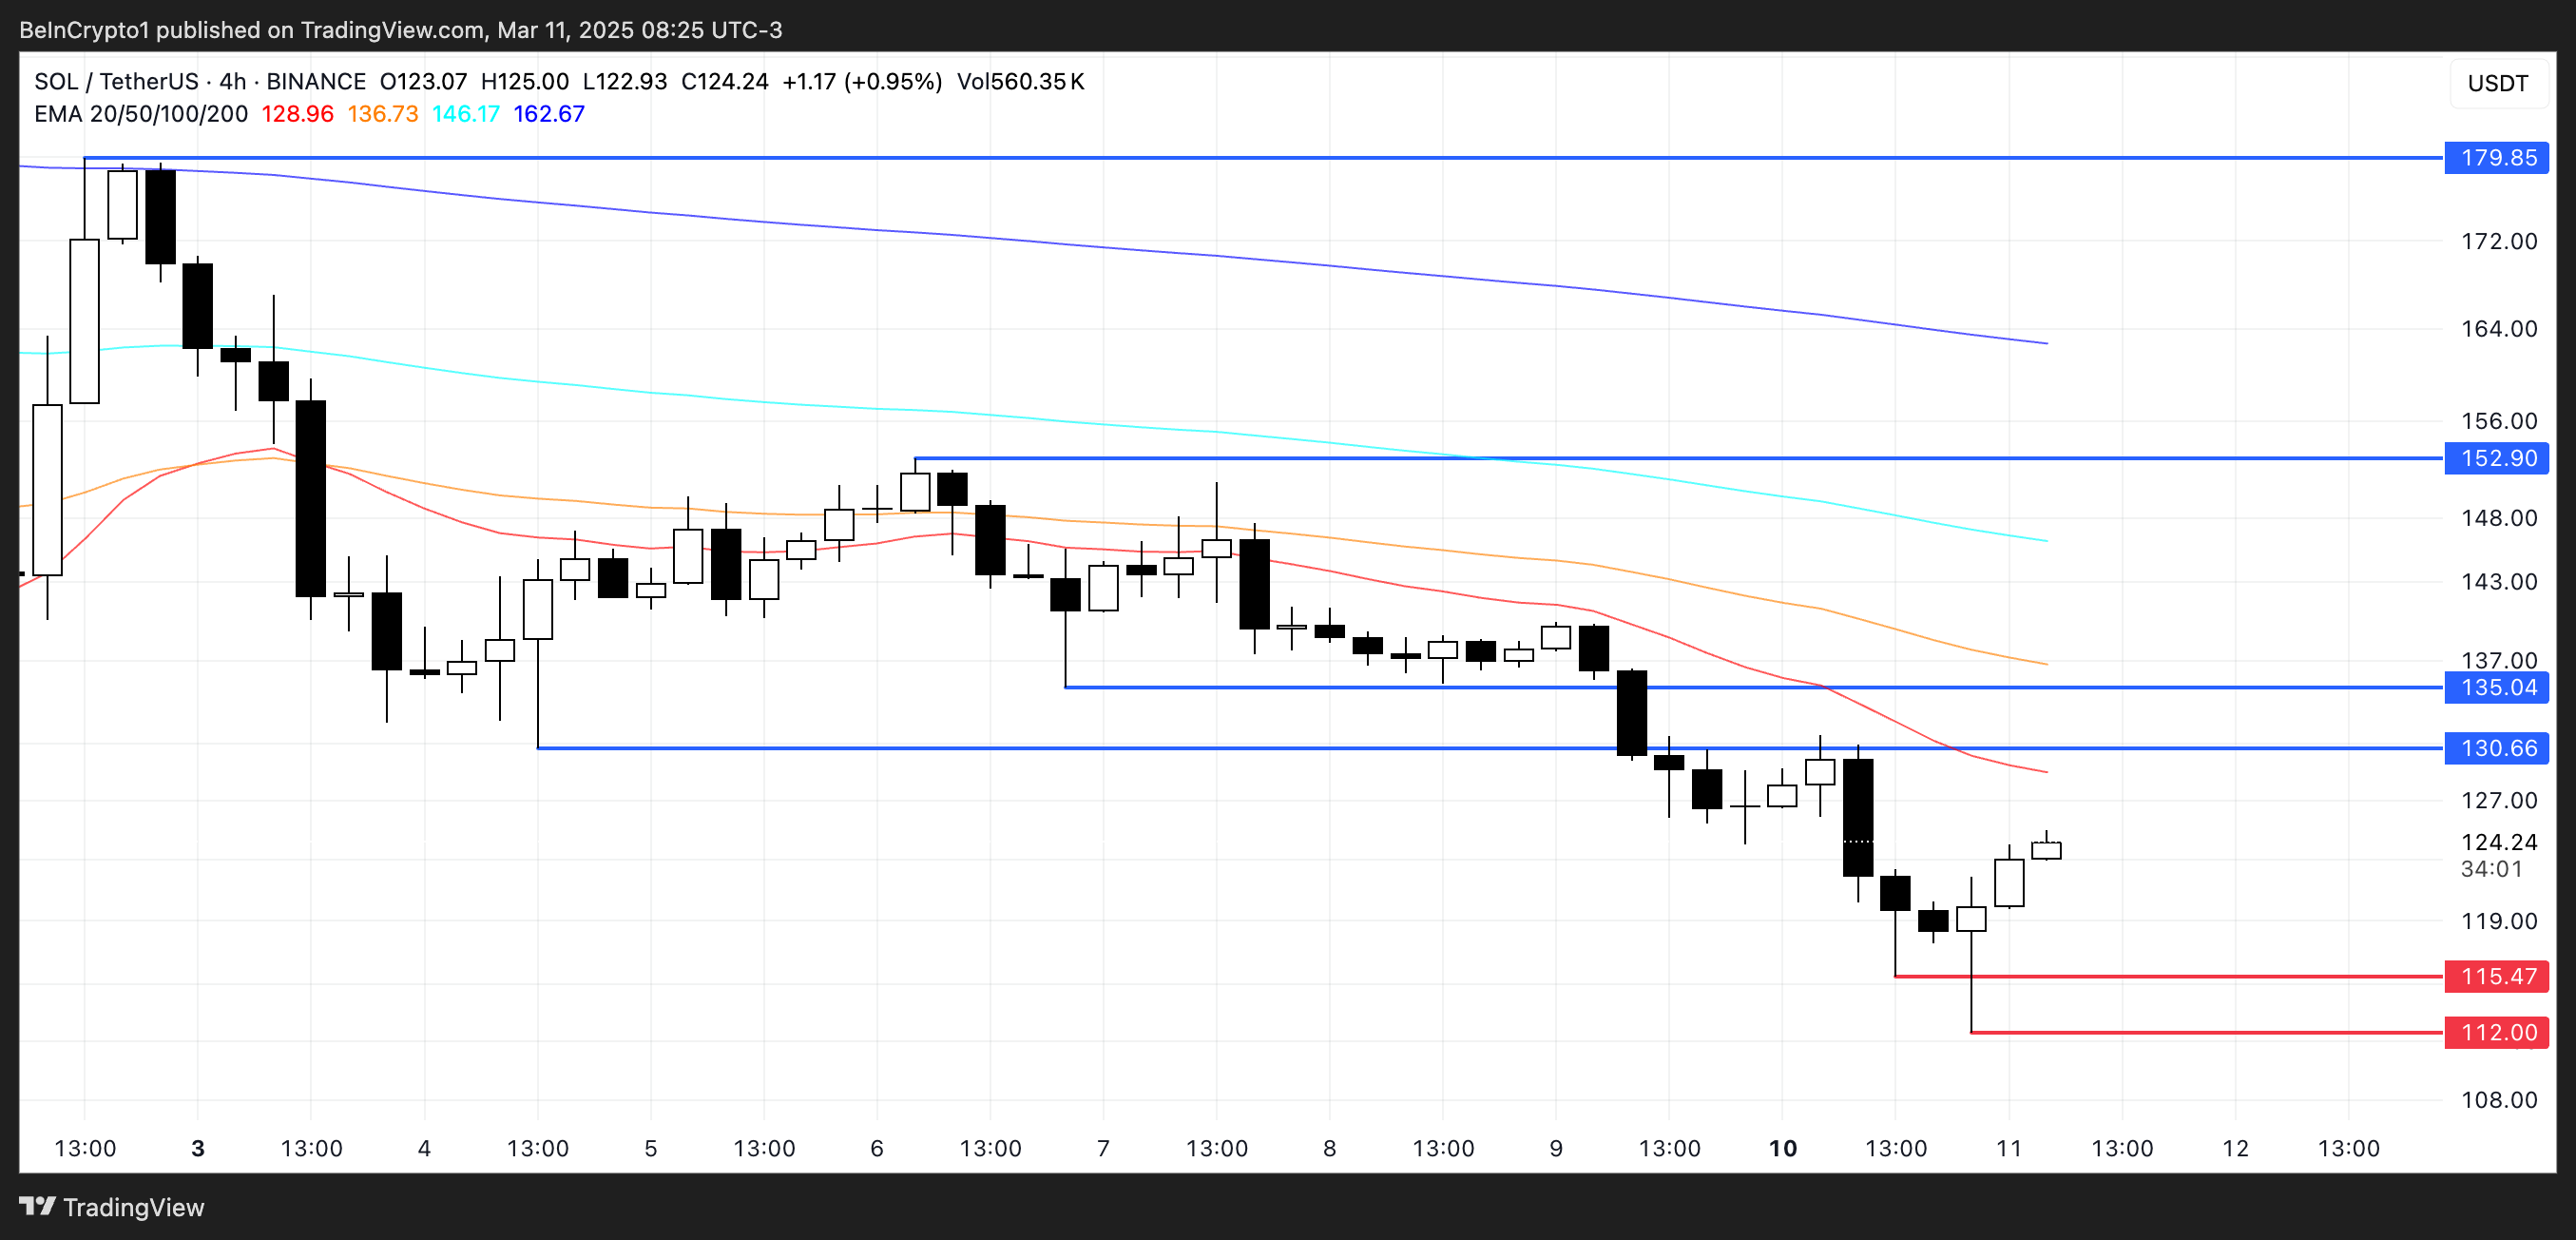
Solana’s price continues to be under intense bearish pressure as it recently dropped below the $114 level. As buyers are struggling to defend a decline, SOL price is now aiming for a drop below immediate Fib channels. As of writing, Solana’s price stands at $127, having surged by 6.56% in the last 24 hours.
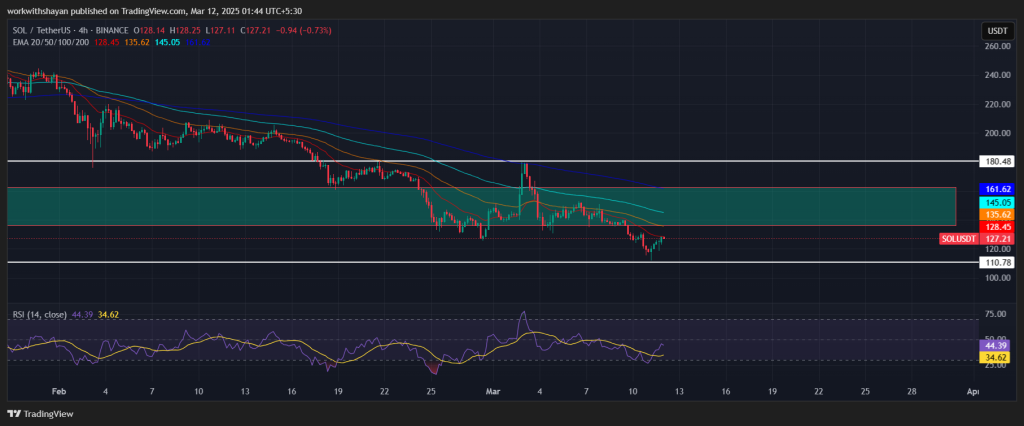
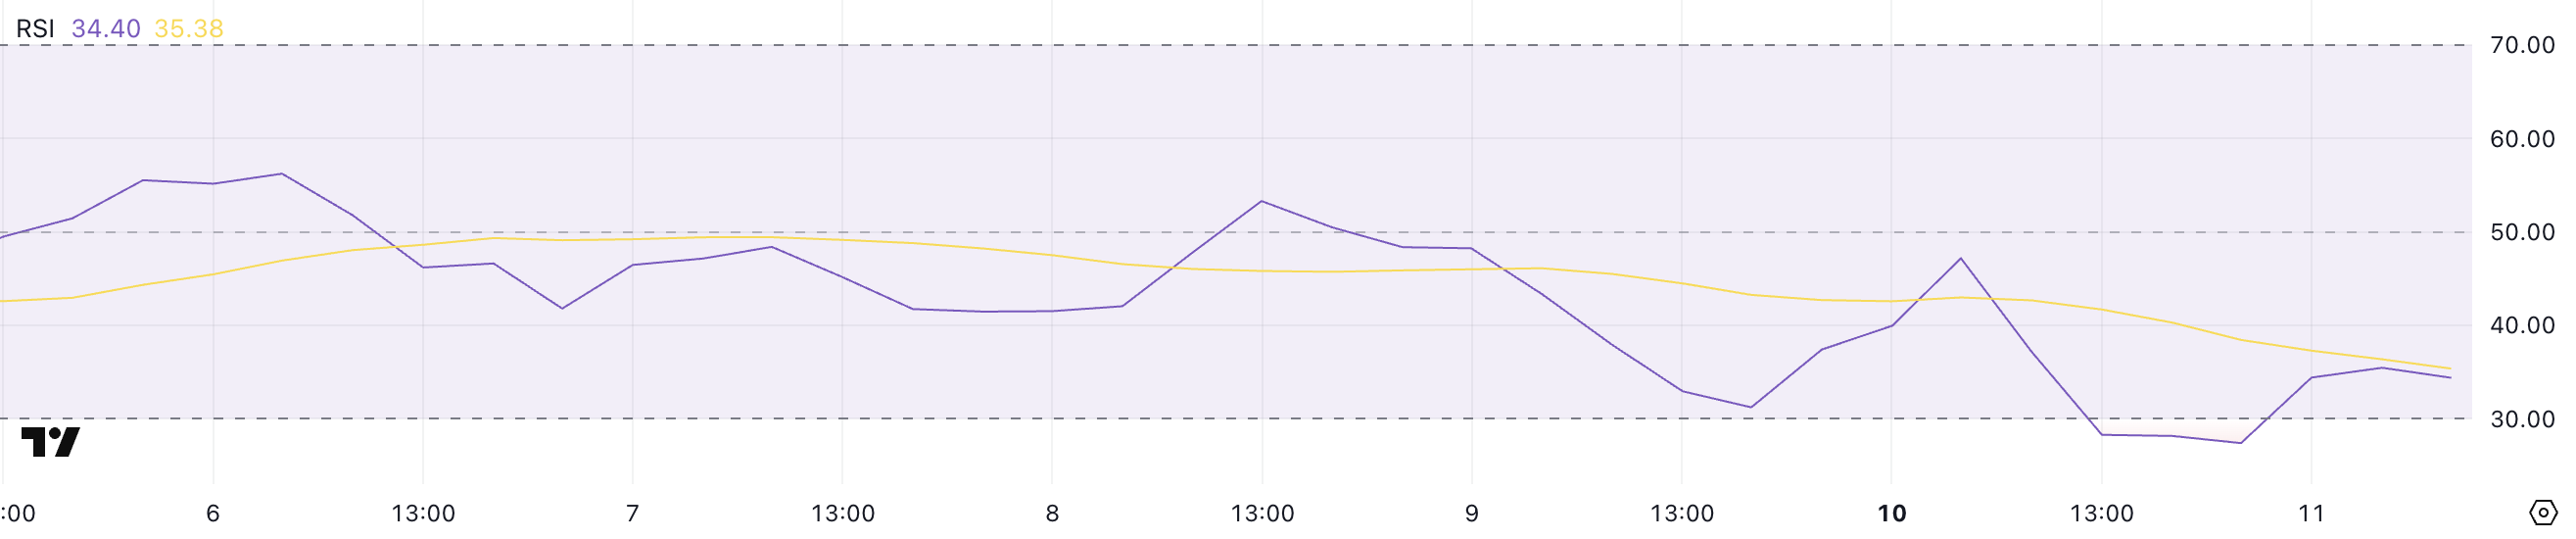
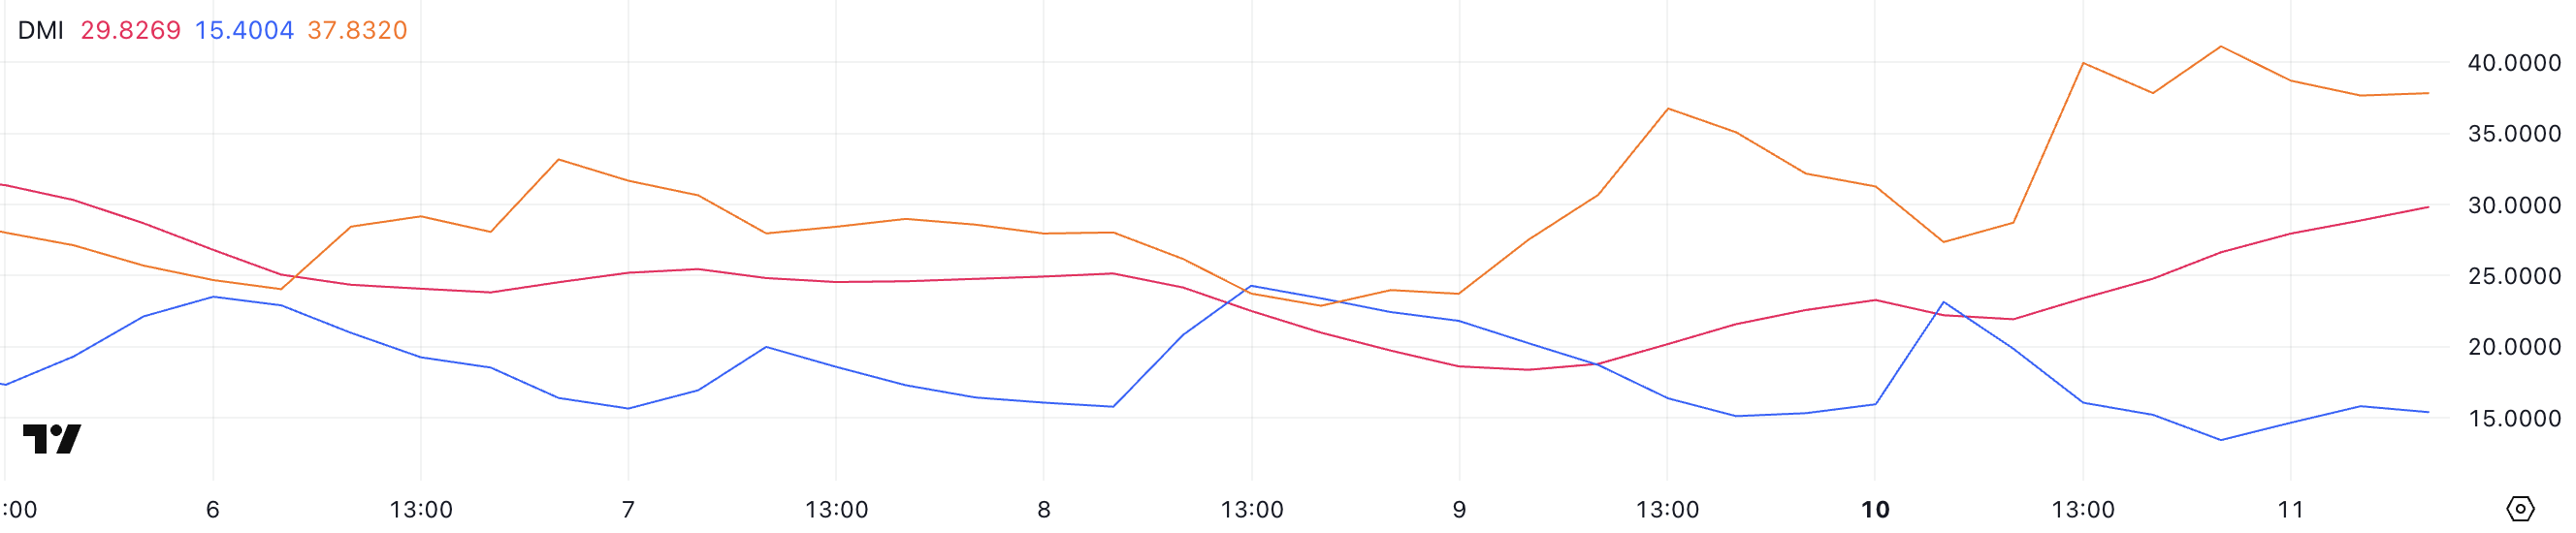
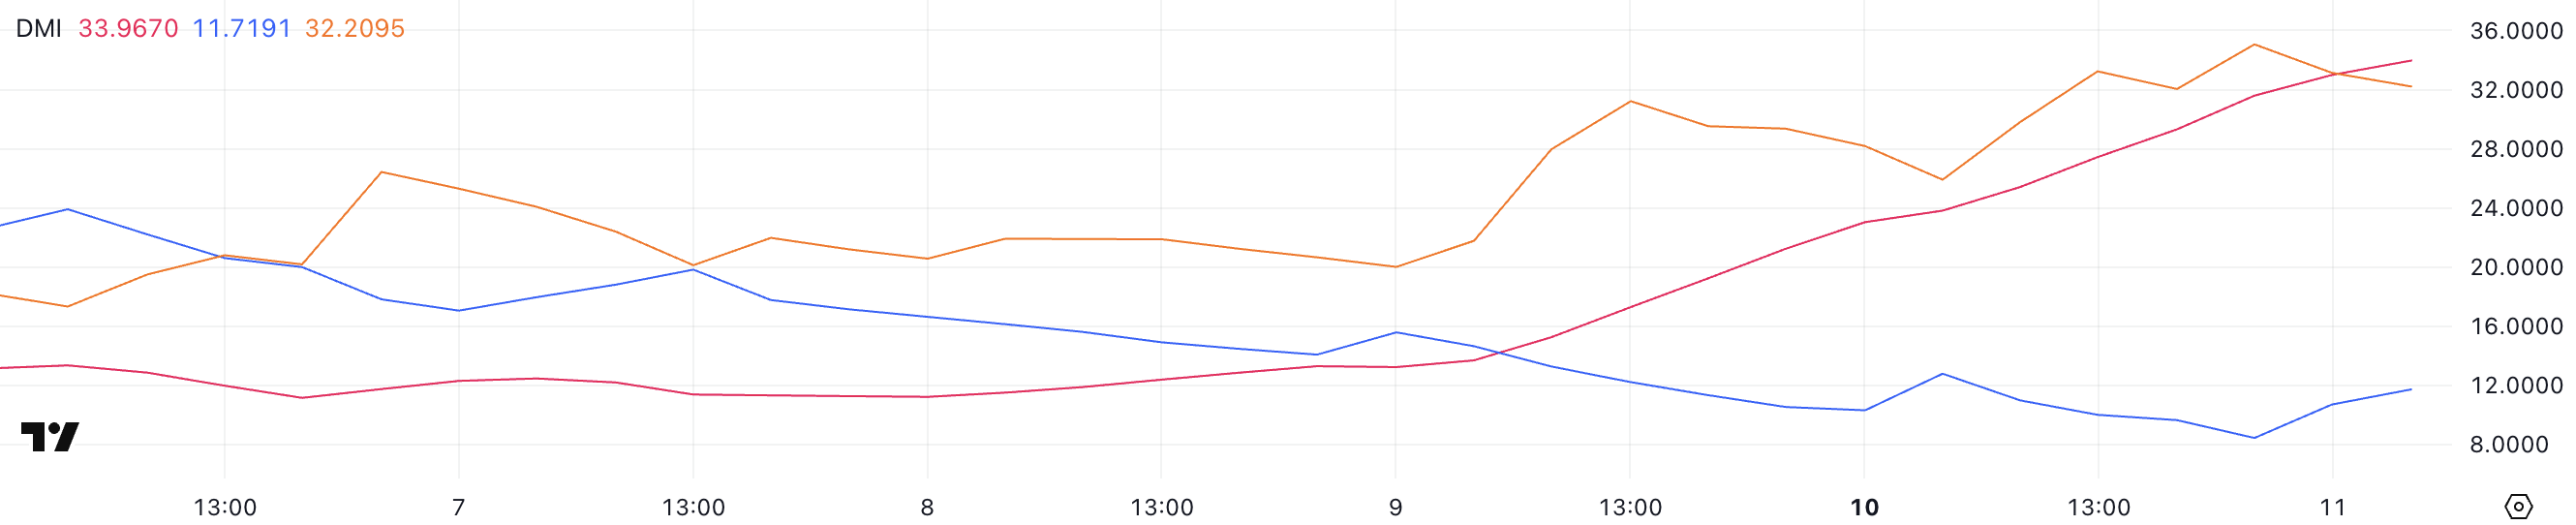
The SOL/USDT trading pair is facing multiple rejections as sellers defend an immediate surge above EMA trend lines. With the Relative Strength Index (RSI) hovering below the midline at level 44, there is a possibility that SOL’s price could drop and retest $110.
If it sustains above this level, it could benefit buyers and potentially push the price for $139. A surge above that level might send the price toward $153. On the other hand, if the SOL price drops below $110, we might see a strong correction below $100.
The post Solana’s On-chain Metrics Continue to Struggle Despite Price Recovery: What’s Next for SOL Price? appeared first on Coinpedia Fintech News
The crypto market is experiencing a significant decline, triggered by global trade tensions. Moreover, President Trump’s Executive Order to set up a Strategic Bitcoin Reserve has surprisingly left crypto traders feeling let down. As a result, the price of Solana has fallen sharply, along with a decrease in important on-chain metrics. Despite a recent recovery …


 ADDING: I’m told by a Capitol Hill source that due to a technicality that requires bills that affect the budget to originate in the House, the Senate will need to vote on the joint resolution one more time.