ZORA Price Battles Intense Selling Pressure After Airdrop

ZORA launched its airdrop today, distributing tokens to early users. The rollout caused confusion, as no official claim site was provided. Users had to check their allocations manually through the smart contract. While the Content Coin narrative boosted coin creation and new users, trading volume dropped sharply from its initial peak.

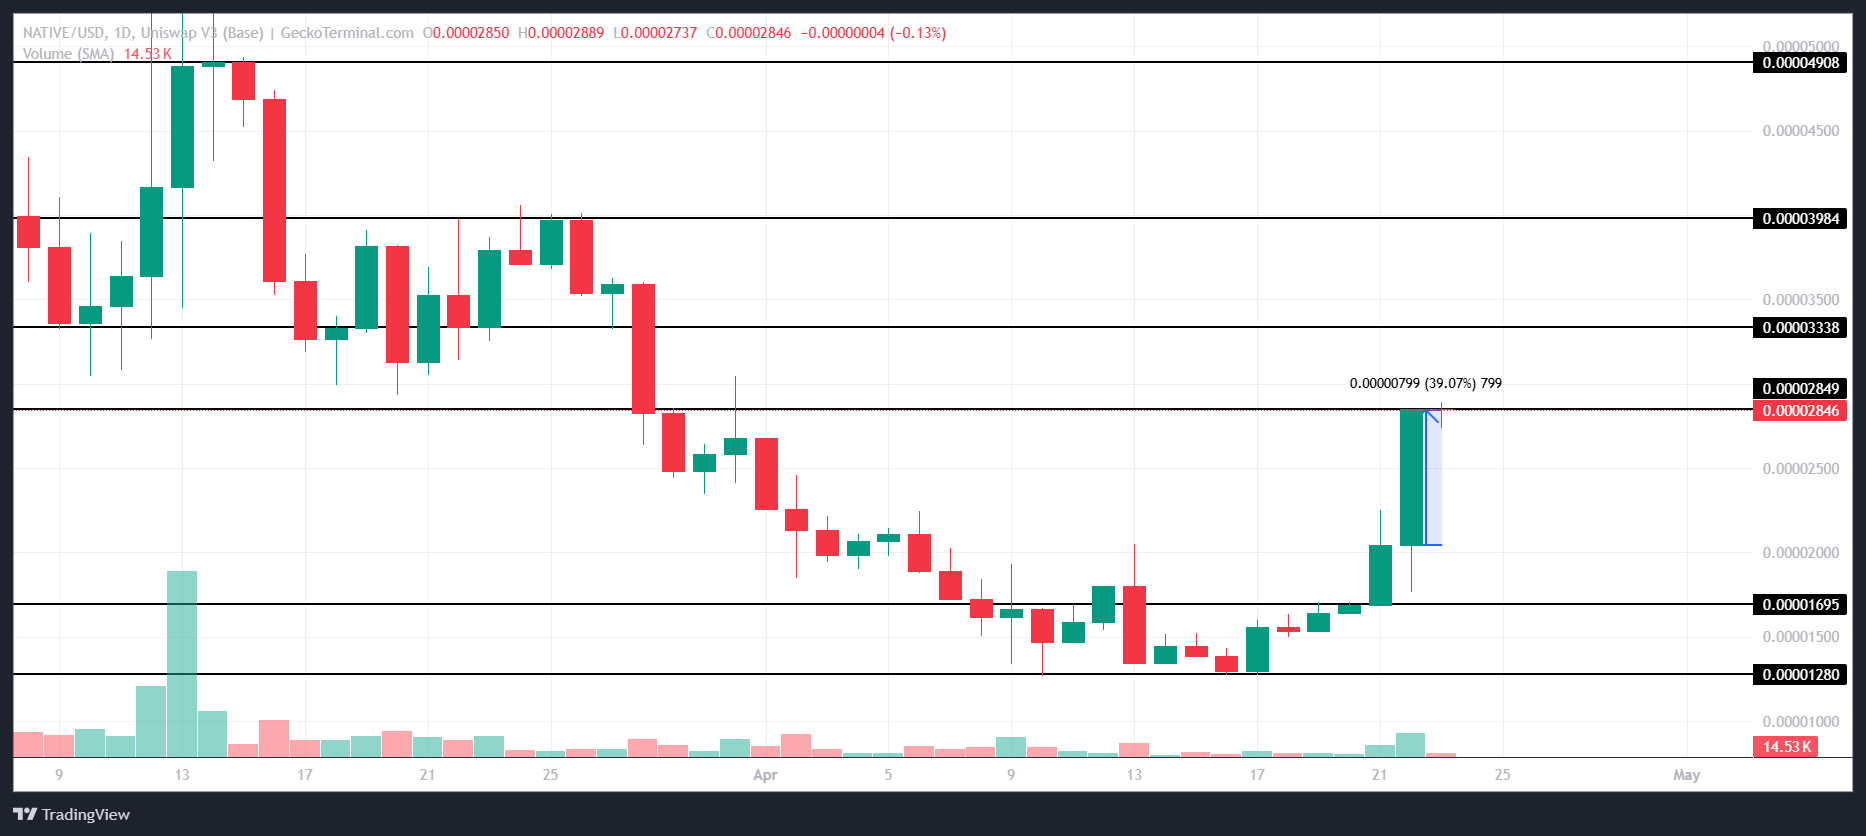
ZORA’s price fell around 50% in the first two hours after the airdrop. It is now trying to recover, but momentum remains uncertain. The market is still reacting to the airdrop and overall token distribution.

Content Coin Narrative Boosts Zora Usage

The Zora airdrop officially launched today, distributing tokens to early users based on two snapshot periods—but it was met with confusion. Base founder, Jesse Pollak, addresses some of these points in an exclusive interview with BeInCrypto.

Many users were unclear on how to check their eligibility, as no official claim site or checker was provided. Instead, allocations had to be verified manually via the smart contract, leading to mixed reactions across the community.

While 10% of the total 10 billion supply was reserved for early adopters, the decision to allocate 65% of tokens to insiders (team, treasury, and contributors) raised questions about the distribution model.

Coins Created and Unique Creators Per Day.
Coins Created and Unique Creators Per Day. Source: Dune.

Since Base chain began promoting the idea of Content Coins, activity on Zora has noticeably increased. The number of newly created coins has remained above 20,000 since April 17, reaching nearly 28,000 yesterday.

Meanwhile, unique creators on the platform grew from 3,683 on April 16 to 6,206 by April 22.

While this growth suggests rising interest, it also reflects a trend still in early development, with questions remaining around long-term sustainability and utility.

Zora Volume Peaked at $31 Million—Now It’s Down Over 70%

Zora’s trading volume in USDC surged sharply with the rise of the Content Coin narrative, hitting $30 million on April 16 and peaking at $31 million on April 17.

This initial spike reflected a strong wave of early interest and speculative momentum around the new use case for content on-chain. a

The increase aligned with Base’s push to promote content coins as a fresh alternative to traditional meme tokens, drawing attention from creators and traders alike.

Zora Daily Volume In USDC.
Zora Daily Volume In USDC. Source: Dune.

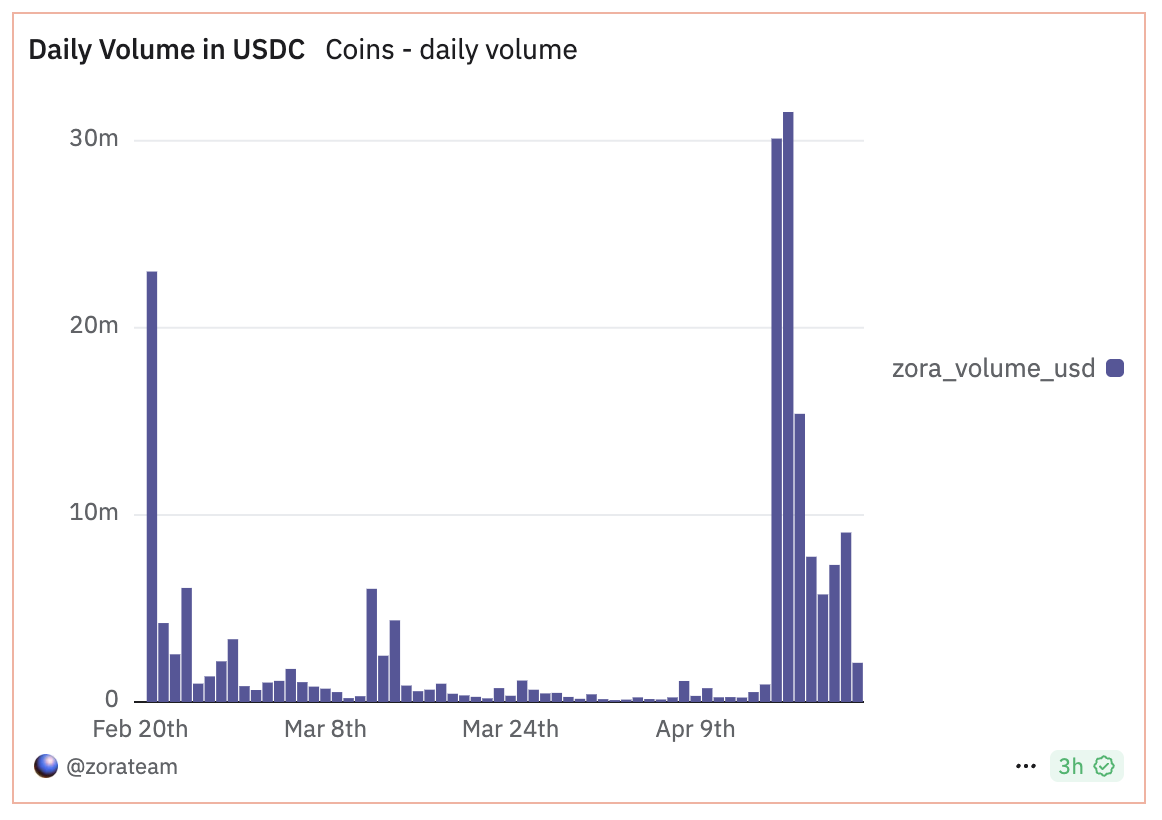
However, despite the number of coins created continuing to climb, Zora’s volume fell significantly to just $9 million by April 22.

This divergence suggests that while more users are experimenting with the platform—launching and minting coins—actual trading activity has not kept pace.

The drop in volume may indicate fading speculative interest, uncertainty around the airdrop, or early profit-taking following the initial hype.

ZORA Price Dives After Airdrop, Now Eyes Recovery

ZORA’s price experienced a sharp selloff immediately following its airdrop, dropping roughly 50% within the first two hours of launch.

Such volatility is not uncommon for newly airdropped tokens, as early recipients often rush to secure profits, adding intense short-term selling pressure.

Since then, ZORA has shown signs of recovery, attempting to stabilize and build upward momentum. If it can break above the $0.023 level, it could move to test resistance at $0.0289, with a potential extension toward $0.034 if buying strength returns.

ZORA Price Analysis.
ZORA Price Analysis. Source: TradingView.

However, the recovery remains uncertain. If ZORA fails to hold current levels and bullish momentum fades, it may retest support at $0.019.

A break below that could lead to further downside, with the next key level around $0.0165.

This price action reflects a typical post-airdrop pattern—initial volatility, followed by a battle between early profit-takers and potential long-term holders looking to establish positions.

The post ZORA Price Battles Intense Selling Pressure After Airdrop appeared first on BeInCrypto.

Hedera (HBAR) Traders Bet on Further Price Gains as Long Positions Surge

The resurgence in broader market activity over the past 24 hours has triggered an uptick in bullish bias towards Hedera (HBAR), with traders increasingly betting on further price gains. 

HBAR’s long/short ratio has climbed to its highest level in the past month, signaling a shift in trader positioning.

Bullish Bets Push HBAR Toward Breakout Territory

HBAR’s long/short ratio currently stands at 1.09, its highest level in the past 30 days. This indicates a sharp rise in the demand for long positions among HBAR’s derivatives traders on Wednesday. 

HBAR Long/Short Ratio.
HBAR Long/Short Ratio. Source: Coinglass

An asset’s long/short ratio measures the proportion of its long positions (bets on price increases) to short positions (bets on price declines) in the market. A ratio below one means there are more short positions than long ones.

Conversely, as in HBAR’s case, a long/short ratio reading above one indicates that traders are predominantly bullish on the altcoin, and are opening bets in favor of an extended price rally. 

Moreover, HBAR’s rising futures open interest confirms the renewed demand for the altcoin. At press time, this is at $205 million, climbing 18% over the past day. HBAR’s value is up almost 10% within the same period. 

HBAR Futures Open Interest.
HBAR Futures Open Interest. Source: Coinglass

Open interest refers to the total number of outstanding futures contracts that have not been settled. When open interest rises alongside price like this, it indicates that new money is entering the market to support the uptrend. This trend signals strong conviction behind the HBAR’s upward movement.

Can HBAR Break Out? Traders Watch $0.199 as Next Key Level

As of this writing, HBAR trades at $0.187, resting above the resistance formed at $0.190. If demand strengthens and HBAR bulls flip this price level into a support floor, the token could extend its uptrend and climb to $0.199.

HBAR Price Analysis.
HBAR Price Analysis. Source: TradingView

On the other hand, if HBAR bears regain market control, this bullish projection will be invalidated. In this scenario, the token could lose its recent gains and fall to $0.153.

The post Hedera (HBAR) Traders Bet on Further Price Gains as Long Positions Surge appeared first on BeInCrypto.

Monad To Integrate ChainLink Oracle Services – What it Means

Monad To Integrate ChainLink Services

Monad, the Dragonfly and Paradigm backed EVM-compatible Layer-1 chain, has announced a major partnership with ChainLink.

Since launching its public testnet on Feb 19, it has shake up the crypto world with the promising 10,000 transactions per second.

Now, in an announcement on April 22, it has revealed integrating oracle network, Chainlik services from Day 1.

This integration is part of Monad’s membership in the Chainlink Scale program, designed to accelerate growth for Layer-1 and Layer-2 networks by providing enhanced access to Chainlink’s Web3 services.

This becomes important as the layer-1 blockchain eyes its mainnet launch soon. Last week, Monad also announced enabling Circle USDC transactions on its mainnet.

What Integrating Chainlink Services Mean for Developers

Monad will integrate Chainlink’s full suite of decentralized oracle services when its mainnet goes live.

This means that developers will be able to access Chainlink Data Feeds, Data Streams, and the Cross-Chain Interoperability Protocol (CCIP).

Chainlink’s Data Feeds will allow Monad developers to retrieve accurate and decentralized price feeds for assets. This will help developers in critical use cases of decentralized finance (DeFi) like lending platforms, automated market makers, and derivatives protocols.

It will also integrate Chainlink’s Data Streams – a pull-based oracle solution. This will offer low-latency, cost-efficient data delivery that mitigates front-running and miner extractable value (MEV) risks.

Meanwhile, CCIP will empower secure, programmable token transfers across blockchains. This will help in laying a foundation for genuinely interoperable decentralized applications.

Chainlink’s oracles have underpinned over $20 trillion in on-chain transaction volume, even during periods of extreme volatility and flash loan exploits.

The move also aligns with a broader industry trend of Layer-1 chains seeking to differentiate themselves through enterprise-grade oracle security and interoperability features.

Thus, using Chainlink’s oracle, any application built on Monad will have immediate access to tamper-proof, real-time market data from day one.

When is Monad Mainnet Launch – Soon?

This announcement comes as the blockchain eyes its mainnet launch soon. Founded with a vision of high throughput and developer-friendly execution, Monad aims to support over 10,000 transactions per second. This implies sub-second block times (0.5s), single-slot finality, and near-zero gas fees thanks to its parallel execution model.

It is backed by a $244 million funding round led by Dragonfly and Paradigm last month. The network has rapidly built out an ecosystem of more than 50 applications, infrastructure providers, and integrations in its testnet phases

With its testnet already supporting wallets like Phantom, OKX, Uniswap Wallet, Backpack, USD Coin (USDC), this integration of Chasinlink can serve as stimulus. These all services are slated to be available on day one of the mainnet launch as Monad positions itself as a developer-first platform.

While the exact mainnet launch date is still to be confirmed, the network has indicated it will go live in the first quarter of 2025.

Further, Monad’s decision to integrate Chainlink services also underscores a growing recognition for oracle infrastructure. Oracles and ross-chain interoperability are becoming essential pillars of a thriving Web3 ecosystem.

The post Monad To Integrate ChainLink Oracle Services – What it Means appeared first on CoinGape.

3 USA Coins to Buy to Turn $1K to $10K as Trump Hints at Reducing China Tariffs

3 USA Coins to Buy to Turn $1K to $10K as Trump Hints at Reducing China Tariffs

The crypto market is gaining today amid reports that President Trump will reduce the tariffs levied against China. The China-US trade war was among the key factors that have fuelled turmoil across financial markets for the most part of this month, and with the increased likelihood that the two countries might arrive at a deal, three USA coins are standing out with the potential to rally 10x and see traders turn $1,000 to $10,000.

Trump Hints at Reducing China Tariffs – Time to Buy USA Coins?

While speaking from the White House yesterday, President Trump stated that the tariffs imposed on China “will come down substantially”, even if they will not entirely be removed, a statement that sparked gains for USA-made crypto coins. Trump noted,

“145% is very high, and it won’t be that high… It will come down substantially, but it won’t be zero. We are going to be very good to China, and have a great relationship with President Xi.”

This statement sparked gains across the crypto market as most altcoins registered double-digit percentage gains within hours, with the total crypto market cap soaring past $3 trillion. Bitcoin price surged past $93,000 while Ethereum also briefly reclaimed $1,800, with traders now eyeing more gains.

Additionally, Reuters also reported that US Treasury Secretary Scott Bessent has stated that there would likely be a de-escalation in trade tensions between China and the US. The statement further sparked optimism among crypto traders that USA coins are set to make a solid recovery.

USA Coins to Buy to Turn $1K to $10K

As the macro headwinds that previously weighed on crypto assets ease, some of the top USA coins that traders should consider buying today are Ripple (XRP), Solana (SOL), and Cardano (ADA). These coins have bullish technical setups and robust fundamentals that could see traders turn an investment of $1,000 to $10,000.

Ripple (XRP)

XRP is the largest USA coin by market cap, making it one of the top choices to consider amid the recent gains to make a 10x return with a $1,000 investment. To begin with, Ripple is surrounded by bullish catalysts, including the potential approval of a spot XRP ETF after the new SEC Chair Paul Atkins was sworn in.

The daily XRP price chart further shows that an all-time high is within reach after this token broke resistance at the 50-day SMA, while the RSI shows that bulls have taken control. As the bullish momentum grows strong, a 10x rally for one of the top American coins might be on the horizon.

3 USA Coins to Buy to Turn $1K to $10K as Trump Hints at Reducing China Tariffs
XRP/USDT: 1-day Chart

Solana (SOL)

Solana is also one of the top USA-made coins that traders should consider buying. The ongoing frenzy around SOL-based meme coins and a surge in Solana network activity highlight the presence of solid fundamentals to support an upswing.

The rising RSI on the daily Solana price chart shows that the bullish momentum is currently at its strongest since late January. Meanwhile, a double bottom chart pattern suggests that this American coin might soon aim for its record high of $295 if it can overcome resistance at $180. This technical setup and fundamentals support a bullish Solana price prediction.

3 USA Coins to Buy to Turn $1K to $10K as Trump Hints at Reducing China Tariffs
SOL/USDT: 1-day Chart

Cardano (ADA)

Cardano price also shows signs of extending gains after surging past $0.70, to its highest level in nearly three weeks, making it one of the top USA coins to buy. Additionally, a recent Coingape article stated that Cardano price could hit $1 as Bitcoin and the rest of the crypto market edge higher.

One of the factors that could support such an uptrend is the surging open interest, as data from Coinglass shows that ADA’s open interest has increased by 14% in the last 24 hours to $765M. The OI is also approaching a monthly high, an indication that traders are opening new positions on this altcoin as they anticipate a strong trend.

3 USA Coins to Buy to Turn $1K to $10K as Trump Hints at Reducing China Tariffs
Cardano Open Interest

Summary of Top USA Coins to Buy

As reports emerge that President Trump could lower the tariffs levied against China, USA coins present a good buy opportunity for a trader looking to book profits during the ongoing uptrend. Some of the top American coins to buy are Ripple (XRP), Solana (SOL), and Cardano (ADA), which have strong fundamentals and a strong technical outlook.

The post 3 USA Coins to Buy to Turn $1K to $10K as Trump Hints at Reducing China Tariffs appeared first on CoinGape.

Shiba Inu Price Analysis: Fate of 72 billion SHIB Depends on This Key Level

Shiba Inu price is recovering and is up by 33% from its lowest point this month. This performance follows that of Bitcoin and most altcoins. CoinGlass data highlights the significance of the key price at $0.00001382 and its potential impact on 72 billion tokens, currently worth about $1 million.

Key Shiba Inu Price to Watch as 72 Billion Face Liquidation Risk

Shiba Inu price has rallied in the past few days. This trend may continue if Bitcoin price continues rising now that it has crossed the important resistance level at $90,000 for the first time in a month. 

The chart below provides the SHIB exchange liquidation map. The high orange bars in this chart show the positions that have substantial leverage or debt. In this chart, the red lines are the cumulative longs, while the green lines are the cumulative shorts.

The long positions peak at about 487.8k at around $0.0000132, while the short positions are at 192k and peak at the present price. Long traders hope to make a profit when the price rise, while short-sellers make money when the price falls. 

Shiba Inu Coin Liquidations
Shiba Inu Coin Liquidations | Source: CoinGlass

The interpretation of this chart is that a drop below the key support at $0.00001382, about 192k long positions will start being liquidated. On the other hand, if this price rises above that level, these short positions worth about 842.1k will liquidate. Short liquidations often leads prices higher. 

SHIB Price Technical Analysis and Price Forecast

Technical analysis offers a good approach to predict where the value of SHIB goes from here. Since the last week of February, the coin has been moving sideways, remaining between the key resistance level at $0.00001515 and the support at $0.00001025. 

Shiba Inu price has formed a W pattern, also known as a double-bottom, which often triggers more upside. More gains are usually triggered when the price surges above the neckline of this pattern, in this case, at $0.00001560. This price coincides with the 23.6% Fibonacci Retracement level.

SHIB has crossed the important resistance level at $0.000013, the 50-day moving average. Therefore, more gains will be confirmed if the coin rises above $0.00001560. Such a move will see it rise to the crucial resistance at $0.00001945, the 61.8% or the 38.2% retracement level. This SHIB price forecast points to a 40% jump from the current level.

Shiba Inu Price Chart

The bullish outlook will be invalidated if the coin drops below the key support at $0.00001120. A move below that level will point to more downside, potentially to below $0.0000100.

The post Shiba Inu Price Analysis: Fate of 72 billion SHIB Depends on This Key Level appeared first on CoinGape.

Here’s Why Pi Network Price Will Remain Capped Because These 3 Exchanges Will Not List Pi Coin

Pi Network price has been left in the dust as Bitcoin and other altcoins. It remains below $1, and has crashed by almost 80% from its all-time high. Its daily volume has also fallen to less than $100M, a sign that its demand is waning. Let’s explore why the Pi Coin price will remain capped until two key exchanges list it.

Pi Network Price to Be Stuck Until Key Exchange Listings

Pi Coin has struggled primarily for two main reasons: a lack of tier-1 exchange listings and its token unlocks. Data shows that the network will release 1.6 billion tokens, worth approximately $1.06 billion, over the next 12 months. These releases will ultimately drive the price downwards, especially if there is no demand to purchase.

No other major CEX has listed Pi Network since its mainnet launch. Its only trading is happening in exchanges like Gate, Bitget, OKX, LBank, and MEXC. While these ones are large players in the crypto industry, most of them are not considered tier-1 exchanges. 

There are three main exchanges that would likely lead to a Pi Network price surge. Binance is the biggest crypto in the industry, and its listing would expose it to over 200 milion users globally. Most Binance users who participated in a poll before the mainnet launch supported its listing. 

Cryptocurrencies usually surge after Binance listing. The most recent example is DeepBook, whose price rocketed after Binance Futures listing.

Upbit is another exchange that would lead to a Pi Coin price surge because of its large market share in South Korea. Just recently, Orca price soared by 170% in a day after it was listed on Upbit. 

The other key exchange ideal for Pi Network price surge is Coinbase, which would expose it to US clients. As such, the token will remain capped until it is listed in these three exchanges. 

Pi Coin Price Technical Analysis and Prediction

The eight-hour chart reveals that the value of Pi has remained in a narrow range this month. It has been stuck between the support and resistance levels at $0.4015 and $0.7660. 

Most importantly, the coin has formed a rising wedge chart pattern. The lower line links the lower lows since April 15, while the upper side connects the highest levels since March 29. This wedge leads to a breakdown when the two lines near their meeting point as is happening today. 

Therefore, the most likely Pi Network price forecast is where it crashes and retests this month’s low at $0.4015, down by 40% from the current level.

Pi Network Price
Pi Network Price

However, there is always a risk for a short squeeze, especially if one of these exchanges lists it. Such a move would trigger a triple-digit surge, possibly to the value of Pi at $3.14.

The post Here’s Why Pi Network Price Will Remain Capped Because These 3 Exchanges Will Not List Pi Coin appeared first on CoinGape.

Ethereum FOMO Trader Bags $3M Coins As ETH Price Rallies 10%

Ethereum FOMO Trader Bags $3M Coins As ETH Price Rallies 10%

Ethereum price has surged nearly 8% in the past 24 hours and has caused notable trading activity among both retail investors and whales. On-chain data from Lookonchain reveals a case of “buy high, sell low, then buy back even higher” behavior from one trader.

Ethereum trader makes a FOMO move

Blockchain analytics platform Lookonchain has identified what they describe as a “peak FOMO trader” whose Ethereum trading history shows classic emotional decision-making in volatile markets. According to their tweet, this trader initially purchased 1,805 ETH for $6.42 million at a price of $3,559 approximately six months ago.

As Ethereum’s price dropped, the trader held their position until about two weeks ago, when they sold their entire holding at a substantial loss of $3.6 million. This is a 56% decrease from their initial investment. The selling decision proved poorly timed, as it came shortly before the current price rally.

Following ETH’s recent price increase, the same trader has now purchased 1,734 ETH worth $3.11 million at a price of $1,792. While this entry point is significantly lower than their original purchase price of $3,559, it is higher than the price at which they recently sold.

This pattern of buying at market highs, selling during downturns, and then repurchasing as prices begin to rise again typifies emotionally-driven trading that often results in poor outcomes. As per the latest data, Ethereum whales accumulated $100 million in ETH recently.

Whales begin accumulating as ETH pumps

Despite the overall price rally, on-chain data reveals different behaviors among Ethereum whales. Lookonchain reports that some large holders are actively accumulating during the price increase. A particular wallet has withdrawn 5,531 ETH (valued at $9.8 million) from Binance within a single hour.

Similarly, another address identified as 0x2088 spent 4.61 million USDC to purchase 2,568 ETH at an average price of $1,794 over a 40-minute period. But not all that the whales have been doing is positive. In another move, Lookonchain found a large holder who was borrowing 15,000 ETH ($24.9 million worth) from lending platform Aave, likely with the aim of selling.

As per their tweet analysis, this wallet also withdrew another amount of 35,754 ETH ($64.13 million worth) from Aave and sold all the last bits within three hours at an average sale price of $1,794. Technical analyst Cas Abbé has emphasized the importance of recent price action in a recent tweet.

According to him, ETH has posted a “much needed breakout” of its long-term trend by closing above the trendline for the day. In the case of the market continuing to move higher, the analyst predicts that ETH could go up to $2,300 to $2,500 in May.

The post Ethereum FOMO Trader Bags $3M Coins As ETH Price Rallies 10% appeared first on CoinGape.

After Rising Above $1800, Here’s What to Expect from the Ethereum (ETH) Price Rally This Month

Ethereum Price Prediction_ Will ETH Surge Above $3,000 by May 2025

The post After Rising Above $1800, Here’s What to Expect from the Ethereum (ETH) Price Rally This Month appeared first on Coinpedia Fintech News

The crypto markets are healing after the trade war losses that wiped out billions from the space. While Bitcoin surged above $93,000, the Ethereum price made a more intense leap of over 10% in the past 24 hours and is trying to secure the newly gained support at $1800. Soon after the second-largest token displayed strength, the whales jumped in and intensified their activity, which created a huge volatility. 

As per some reports, an ETH whale bought nearly 20,000 ETH worth nearly $34.7 million. 

On the other hand, another whale withdrew over 12,000 ETH from Binance, which raised the suspicion of a potential drop. However, the selling pressure does not seem to have mounted, hinting towards the price maintaining a continued upswing for the rest of the week. 

The ETH price rose but failed to rise above the 50-day MA at $1830 as the bears extracted some of the profits. Meanwhile, the conversion and base lines have triggered a bullish crossover; the cloud suggests the token remains under bearish influence. Hence, the price may continue to remain consolidated within a small range while the bulls are trying hard to defend the support at $1770. 

The ETH price is currently trading just below $1800 at $1797, while the gains have dropped below 10%. There is a strong resistance at $1860, and if it is overcome, then the token may try for $2000. Meanwhile, if the price drops to the support area of $1750, it may face a correction below $1700.

The post After Rising Above $1800, Here’s What to Expect from the Ethereum (ETH) Price Rally This Month appeared first on Coinpedia Fintech News
The crypto markets are healing after the trade war losses that wiped out billions from the space. While Bitcoin surged above $93,000, the Ethereum price made a more intense leap of over 10% in the past 24 hours and is trying to secure the newly gained support at $1800. Soon after the second-largest token displayed …

Clanker Meme Coins’ Value Surged By 25% In A Single Day | Meme Coins To Watch Today

The meme coin market is witnessing the emergence of automated token launches with the help of Clanker. These meme coins are attracting the same interest from investors as traditional meme coins, so much so that even major CEXs like Coinbase are set to list one of them.

BeInCrypto has analyzed three clanker-based meme coins for investors to watch as these tokens’ market cap increased by 25% today.

tokenbot (CLANKER)

  • Launch Date – November 2024
  • Total Circulating Supply – 1 Million CLANKER
  • Maximum Supply – 1 Million CLANKER
  • Fully Diluted Valuation (FDV) – $53.59 Million

CLANKER has experienced a significant surge of 18% in the last 24 hours, following a 58% increase over the past five days. Currently trading at $53, the altcoin shows strong momentum and is likely to continue its upward trend as market sentiment remains positive.

The anticipated listing of CLANKER on Coinbase on April 23 is driving excitement. As the first major exchange listing for this meme coin, this event is expected to bring increased visibility and trading volume, potentially attracting more investors. The listing could serve as a key catalyst for further price growth.

CLANKER Price Analysis.
CLANKER Price Analysis. Source: TradingView

With the Coinbase listing expected to generate attention, CLANKER’s price could rise toward the next resistance level of $67. However, if the listing fails to attract the expected hype, the meme coin could see a reversal, dropping to $42 or lower, especially if the $53 resistance is not breached.

BankrCoin (BNKR)

  • Launch Date – December 2024
  • Total Circulating Supply – 99.99 Billion BNKR
  • Maximum Supply – 100 Billion BNKR
  • Fully Diluted Valuation (FDV) – $18.54 Million

BNKR has surged by 36% in the last 24 hours, making it one of the top-performing tokens in the Clanker ecosystem. Trading at $0.0001913, it is holding just above the support level of $0.0001842, showing strong momentum in the short term. The altcoin remains on an upward trajectory.

To maintain its growth, BNKR must breach the resistance at $0.0002085. With continued support from the broader market, the meme coin could push towards $0.0002477, which would mark a new high. This could attract more investors and solidify its position in the Clanker ecosystem.

BNKR Price Analysis.
BNKR Price Analysis. Source: GeckoTerminal

However, if BNKR fails to break the $0.0002085 resistance, it risks falling back through its current support of $0.0001842. This drop could bring the price down to $0.0001207, invalidating the bullish outlook and erasing recent gains for investors.

Small Cap Corner – Native (NATIVE)

  • Launch Date – December 2024
  • Total Circulating Supply – 98.99 Billion NATIVE
  • Maximum Supply – 100 Billion NATIVE
  • Fully Diluted Valuation (FDV) – $2.84 Million

NATIVE price has surged by 39% in the last 24 hours, reaching $0.00002846. The token is just below the resistance level of $0.00002849, showing strong short-term bullish momentum. If this trend continues, NATIVE could aim for higher targets, supported by ongoing market optimism and investor interest.

If the bullish momentum holds, NATIVE could break past the $0.00002849 resistance and climb towards $0.00003338. A successful rise beyond this level could fuel further price growth, providing the meme coin investors with significant returns.

NATIVE Price Analysis.
NATIVE Price Analysis. Source: GeckoTerminal

However, if selling pressure increases and NATIVE fails to breach the $0.00002849 resistance, the price could drop back down to $0.00001695. This would invalidate the bullish outlook and erase recent gains, leaving the token vulnerable to further losses in the market.

The post Clanker Meme Coins’ Value Surged By 25% In A Single Day | Meme Coins To Watch Today appeared first on BeInCrypto.

Solana (SOL) Price Forecast: This Token Will 42x Your $500 While SOL Lags

Rexas Finance

The post Solana (SOL) Price Forecast: This Token Will 42x Your $500 While SOL Lags appeared first on Coinpedia Fintech News

Recently, Solana’s price slipped below the $130 support level, worrying a good share of investors and market observers alike. This drop comes against massive transfers associated with FTX and Alameda Research wallets. Despite improving broader market conditions, such as the cooling inflation trend signaled by the latest U.S. CPI and PPI data, Solana’s potential for a price rebound appears limited. 

However, a strong newcomer is beginning to take the front stage within the constantly shifting industry: Rexas Finance (RXS). Priced at just $0.20 and set to launch at $0.25, RXS is now being hailed as the next breakout altcoin—one that might multiply a $500 investment into over $21,000, a possible 42x gain, all while Solana moves onward in its post-peak trajectory.

Solana’s Slowing Momentum

The price of Solana continues to be under pressure. After a brief recovery to the $131 mark, the Sol price was dramatically reversed due to bearish pressure. Recently, the Solana price has fallen further and is now trading below the $125 support zone, which has now flipped into a key level regarding future price movement. As per some analysts’ predictions, an Elliott Wave pattern may be forming, indicating a potential reversal at $112.

According to TA, if the price of Solana fails to hold support in this proximity, there is a growing likelihood of further downward movement. Solana may still develop, but its course seems more steady than explosive. Rexas Finance fills in here with buzz and a complete ecosystem ready to upset many sectors in decentralized finance.

Rexas Finance (RXS): A $0.20 Giant in the Making

Rexas Finance arrived to rule rather than merely show up to participate. Rexas is linking the traditional and decentralized finance worlds in a way very few companies have accomplished, with an ambitious goal to change how real-world assets (RWAs) interact with blockchain.

It is a toolset, a launchpad, and a whole DeFi ecosystem, not only a token. Retail and institutional users can start tokens and mint assets and bring real-world objects such as real estate, commodities, and intellectual property on-chain from the Rexas Launchpad, Token Builder, and QuickMINT Bot. Most coins promise utility “someday,” but Rexas already proves value long before its formal release.

Rexas stands out not only for its high aspirations but also for its rapid execution. Starting at just $0.03, the presale has jumped more than six times to reach its final stage price of $0.20. More than 458.8 million tokens have already been sold, and $47.7 million has been raised thus far. This is investor conviction on full display. While presales may inspire mistrust, Rexas Finance passed its Certik assessment, the highest standard for smart contract security. Already registered on CoinMarketCap and CoinGecko, it provides openness and accessibility even before its June 19, 2025, release—when it will first show up on exchanges at a listing price of $0.25.

The 42x Math and Realistic Potential

A $500 investment gets 2,500 RXS tokens at $0.20 per token. Given its foundations and present buzz, if Rexas reaches $8.40—a reasonable price—that $500 leaps into $21,000. That is a 42x return without depending just on buzz. And concerning the long run? Echoing how early Ethereum or Solana ascended from cents to hundreds, more significant gains could be in play if RXS reaches its predicted multi-dollar targets by 2026. Still, the improvements are astounding relative to Solana’s already inflated position, even in a cautious $5–$10 range.

Conclusion

Solana is still a mainstay in the crypto scene, but its opportunity for life-changing profits is closing. Rexas Finance is only getting started in the meantime. RXS is primed to be among the most explosive prospects of 2025, with excellent presale traction, actual utility, and a scalable ambition.

Should history repeat itself—and crypto cycles suggest it often does—the real millionaires of this cycle will be those supporting tomorrow’s leaders today rather than those clutching yesterday’s victors. Should Rexas Finance perform on even a quarter of its promise, a meager $500 investment might be remembered as the best choice of the decade.

For more information about Rexas Finance (RXS) visit the links below:

Website: https://rexas.com

Win $1 Million Giveaway: https://bit.ly/Rexas1M

Whitepaper: https://rexas.com/rexas-whitepaper.pdf

Twitter/X: https://x.com/rexasfinance

Telegram: https://t.me/rexasfinance

The post Solana (SOL) Price Forecast: This Token Will 42x Your $500 While SOL Lags appeared first on Coinpedia Fintech News
Recently, Solana’s price slipped below the $130 support level, worrying a good share of investors and market observers alike. This drop comes against massive transfers associated with FTX and Alameda Research wallets. Despite improving broader market conditions, such as the cooling inflation trend signaled by the latest U.S. CPI and PPI data, Solana’s potential for …