Solana’s governance arm, Solana Foundation, has unveiled a new policy for its Delegation Program.
The program, which was first rolled out in 2020, aims to sustain a highly secure, decentralized, and performant validator network of the ecosystem. It helps new validators participate in its network without substantial SOL holdings.
However, given the decline in Solana Foundation’s total network stake, it has made certain changes to remove non-compliant nodes.
What is Solana’s New Validator Policy
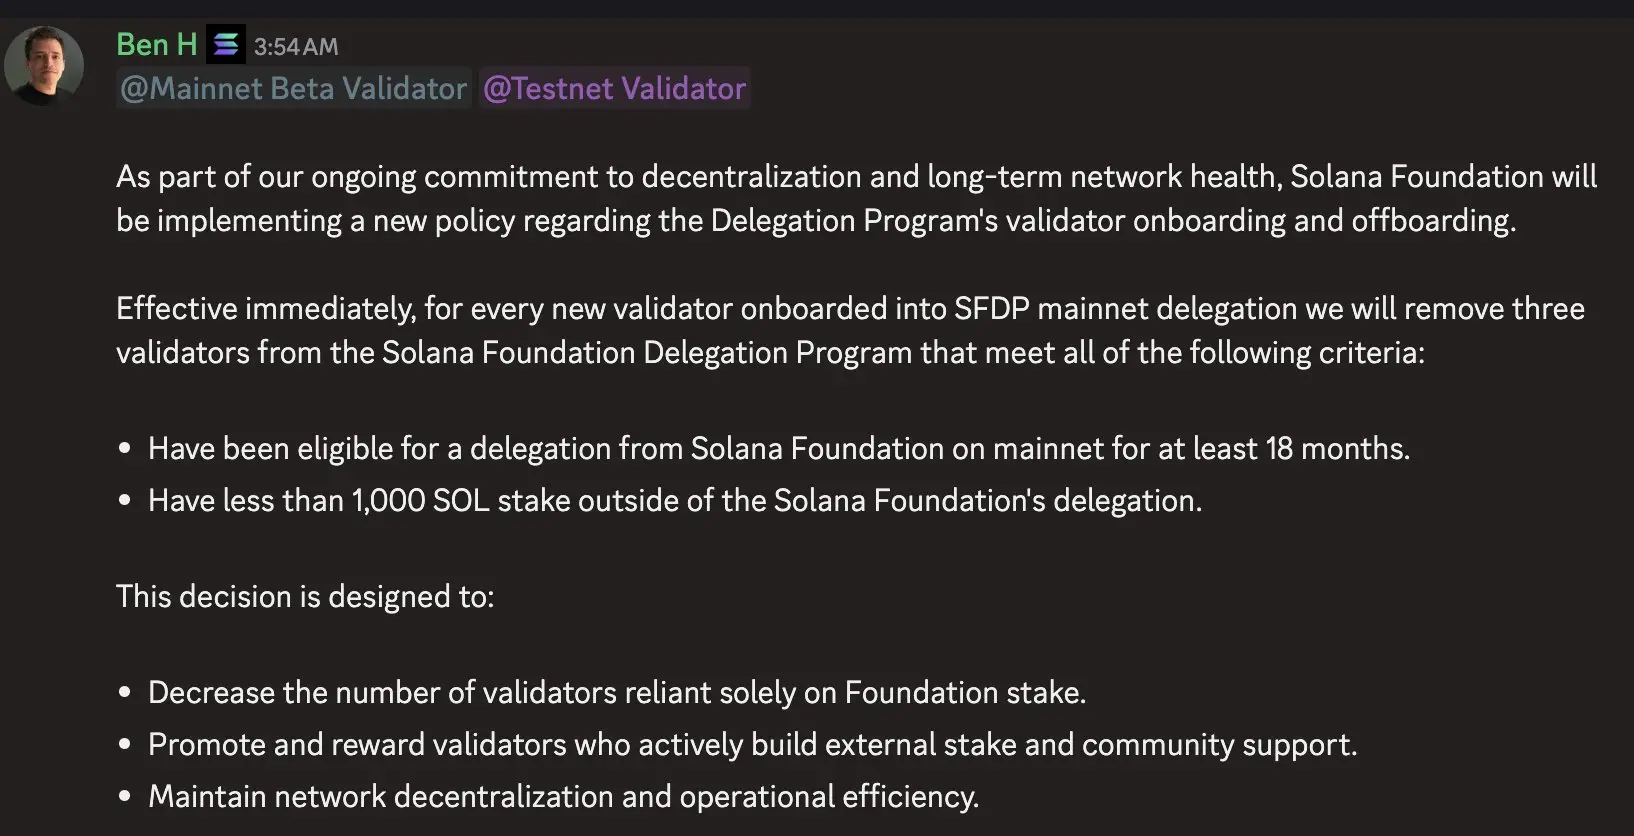
Ben Hawkins, Head of Staking Ecosystem at the Solana Foundation, has announced the criteria to remove certain non-permormant validators uder the newly minted policy.
According to the new policy, for every single new validator that earns a seat via community stake, three long-standing validators will be removed from the Foundation’s delegated list. This action will be implemented if they fail to meet specified performance and self-stake thresholds.
This “three-for-one” swap marks one of the most aggressive steps taken by Solana to date to balance its rapid growth with robust network health.
What is the Criteria for New Validator Entry
At the core of the policy lies a simple yet stringent criterias. This includes two contingent things:
1. any validator that has held Foundation delegation on mainnet for at least 18 months and
2. has accumulated less than 1,000 SOL of self-owned stake outside that delegation slot
On fulfilment of these two criterias, the new validator would become eligible for addition.
By contrast, new entrants must demonstrate both technical reliability and the ability to attract external delegations, effectively aligning economic incentives with network security.
Why is Solana Brining New Validator Policy
The move is explicitly aimed at curbing “validators in name only” that rely wholly on subsidized stake rather than genuine community support.
Ben framed the initiative as a vital recalibration. “We’re committed to fostering a self-sustaining, competitive validator community,” Hawkins said.
“Removing nodes that haven’t proven their commitment to Solana. Both in uptime and personal stake will prompt all operators to invest in their own infrastructure and stake outreach”.
The Foundation has historically supplied approximately 10 percent of total network stake. It has also been involved in underwriting hundreds of validators to bootstrap security and decentralization.
However, as the ecosystem matures, the Foundation’s share has shrunk to roughly 13–16 percent of total stake.
Bullish For SOL?
Industry observers and validator operators have largely welcomed the change as a logical evolution.
Mert Mumtaz, CEO of Helius Labs – one of Solana’s top community validators – described the policy as “bullish for SOL” on social media.
In Mert’s X post, he cites the expectation that it will drive higher quality node operations and more robust community engagement.
As of writing, SOL Price is targeting $150 with the SOL Strategies raising funds for the treasury.
Indeed, by tying the fate of Foundation-delegated stake to tangible performance metrics, the policy creates a live testing ground for validator resilience and community trust.
Underperforming validators incur ongoing operational costs. This includes vote fees, hardware upkeep, monitoring – that the Foundation has traditionally shouldered. This is due to the pruning validators that fail to reinvest in themselves.
The new policy can reallocate its limited delegation resources towards participants who amplify network value and represent genuine network backers.
The daily transaction volumes has been regularly eclipsing 20 million and fee revenue surpassing $1 million. Preserving decentralization without compromising performance has become paramount now.
Thus, the “three-out, one-in” mechanism can serve as a means to institutionalize best practices for validator uptime. It can also ensure security hardening, and community dialogue.
The post Solana Announces New Validator Policy – Here are the Details appeared first on CoinGape.