CME Group to Launch XRP Futures in May; Here’s What to Expect from the XRP Price Rally

The post CME Group to Launch XRP Futures in May; Here’s What to Expect from the XRP Price Rally appeared first on Coinpedia Fintech News
Compared to the other cryptos, XRP has been displaying enormous strength as the bulls have been defending the support. The latest rebound from the support at $1.8 suggested the strong presence of the bulls. As a result, the token is believed to revive a strong upswing in the coming days with a decent rise in the buying volume. Moreover, a couple of bullish events are expected to be a strong catalyst in triggering an XRP bull run.
The race for the spot ETFS has been extensive, as the recent data shows more than 70 ETF applications eyeing approval from the SEC. Among them are a couple of XRP ETFS, which are expected to get approved. Besides, the latest rounds of the Chicago Mercantile Exchange (CME) group are expanding crypto derivatives with the launch of XRP futures this May. Moreover, Ripple’s CEO recently confirmed an agreement with the SEC staff to dismiss the lawsuit, while the $125M fine is reportedly being refunded.
With all these positive developments, the price of XRP is expected to be positively impacted, which has been stuck just above $2. Although the resistance has been falling significantly, the trade setup points towards a breakout, probably before the end of the week.
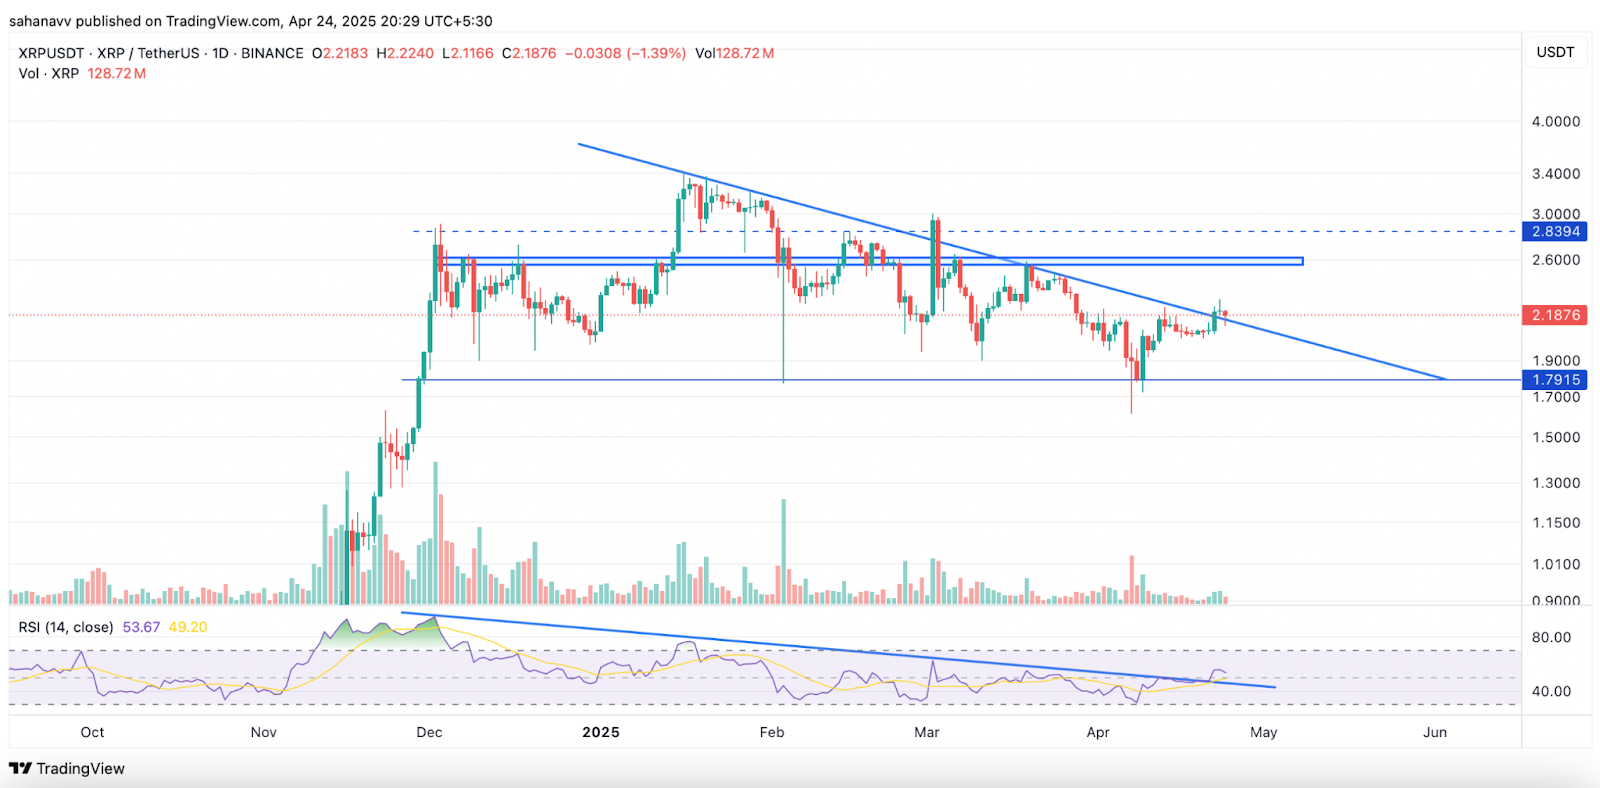
Although the price is stuck within a descending triangle, the bulls are trying hard to breach above the resistance. The previous attempt was supported by a huge bullish candle but unfortunately followed by a major pullback, which prevailed until the bottoms below $1.75 offered a base. However, the latest rise is a consolidated one, with the rally forming constant higher highs and lows, highlighting the growing strength of the bulls.
On the other hand, the RSI has risen above the descending trend line, flashing major bullish signals. Therefore, the XRP price is believed to hold the resistance of the triangle and trigger a rebound to enter the resistance zone between $2.55 and $2.62. However, the bulls are required to pour in excess liquidity to initiate this move, which may further push the price towards $2.8.
The XRP price is back in the game, and this might just be the real beginning of something very big. While most of the eyes are glued to Bitcoin and Ethereum, the XRP price is quietly gaining momentum that may further outpower the top ones. The next big test for the token could be around $2.5, and a breakout from here could send it into a full discovery mode.
The post CME Group to Launch XRP Futures in May; Here’s What to Expect from the XRP Price Rally appeared first on Coinpedia Fintech News
Compared to the other cryptos, XRP has been displaying enormous strength as the bulls have been defending the support. The latest rebound from the support at $1.8 suggested the strong presence of the bulls. As a result, the token is believed to revive a strong upswing in the coming days with a decent rise in …