Cardano Whales Start Buying Again as ADA Price Holds a Tight Range

Cardano (ADA) has climbed over 15% in the past week, continuing to push higher despite a 27% drop in trading volume over the last 24 hours. While momentum indicators and whale activity still lean bullish, signs of consolidation are emerging as ADA trades near key support and resistance levels.

Whether ADA breaks higher or pulls back may depend on how it reacts to the critical $0.668–$0.709 range in the coming days.

Is Cardano’s Rally Losing Steam or Just Catching Its Breath?

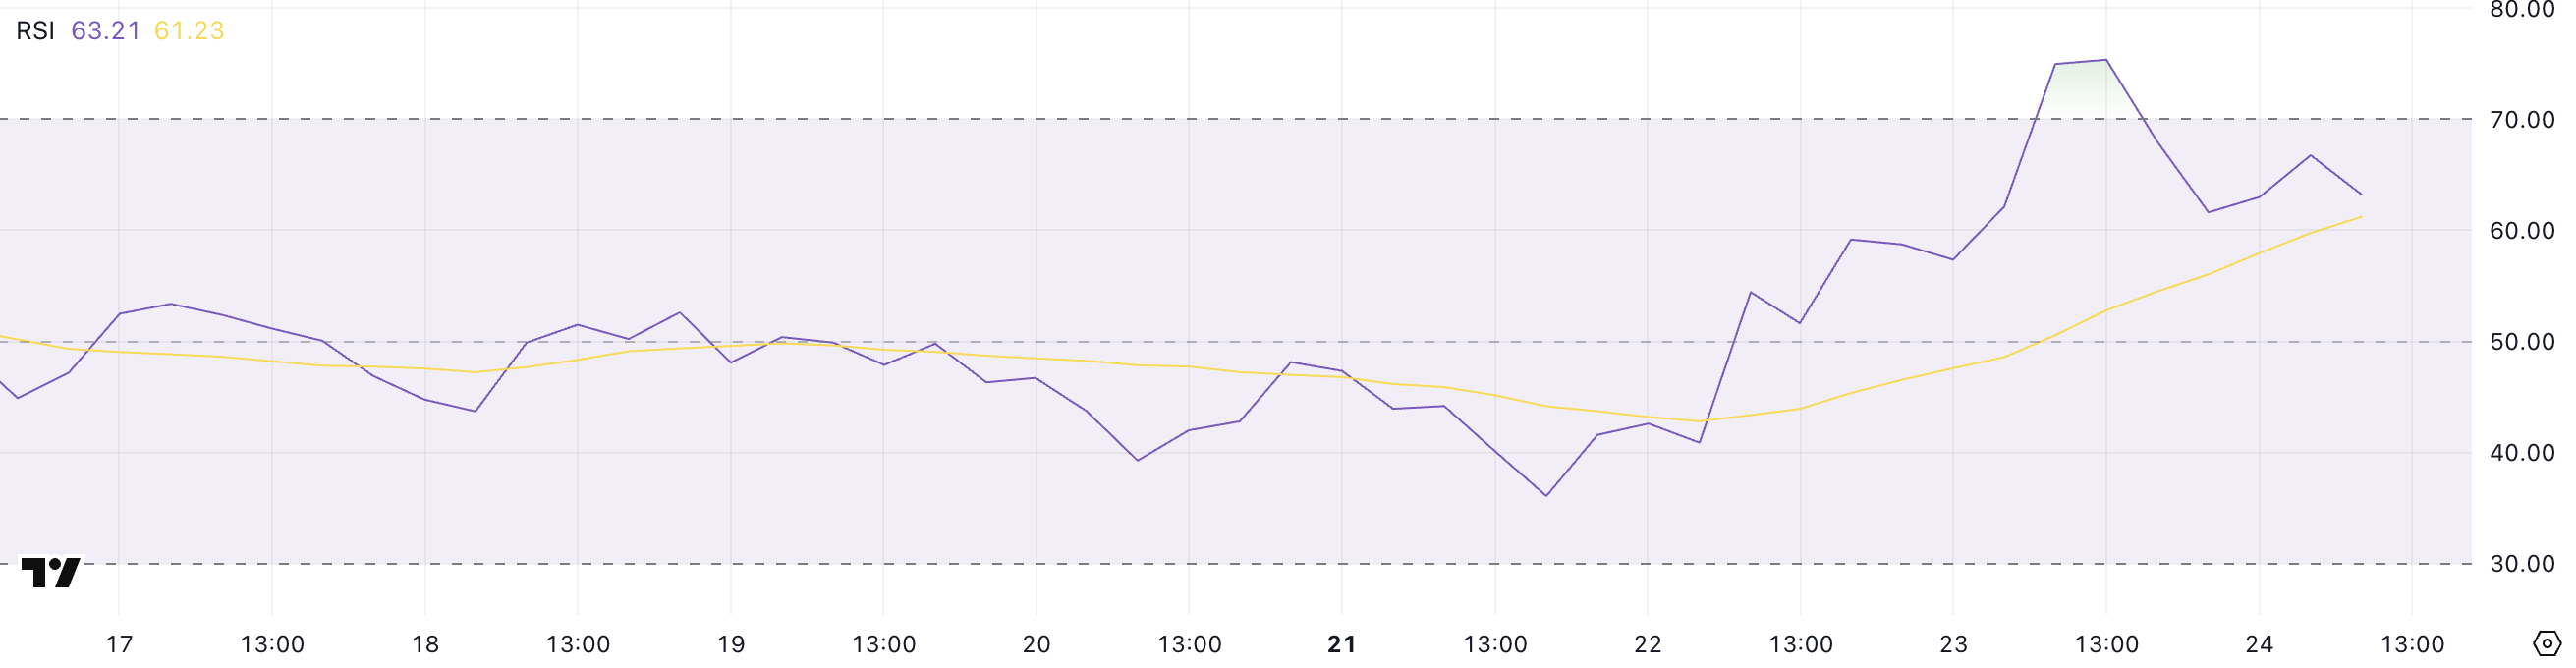
Cardano Average Directional Index (ADX) is currently at 30.17, easing slightly from yesterday’s 32.76 after a sharp surge from 14.90 two days ago.

This rapid climb signals a strengthening trend that has recently stabilized, with Cardano community challenging Charles Hoskinson on roadmap promises.

Despite the minor pullback in ADX, ADA remains firmly in an uptrend, indicating that bullish momentum is still present, though perhaps cooling slightly after an intense acceleration.

ADA ADX.
ADA ADX. Source: TradingView.

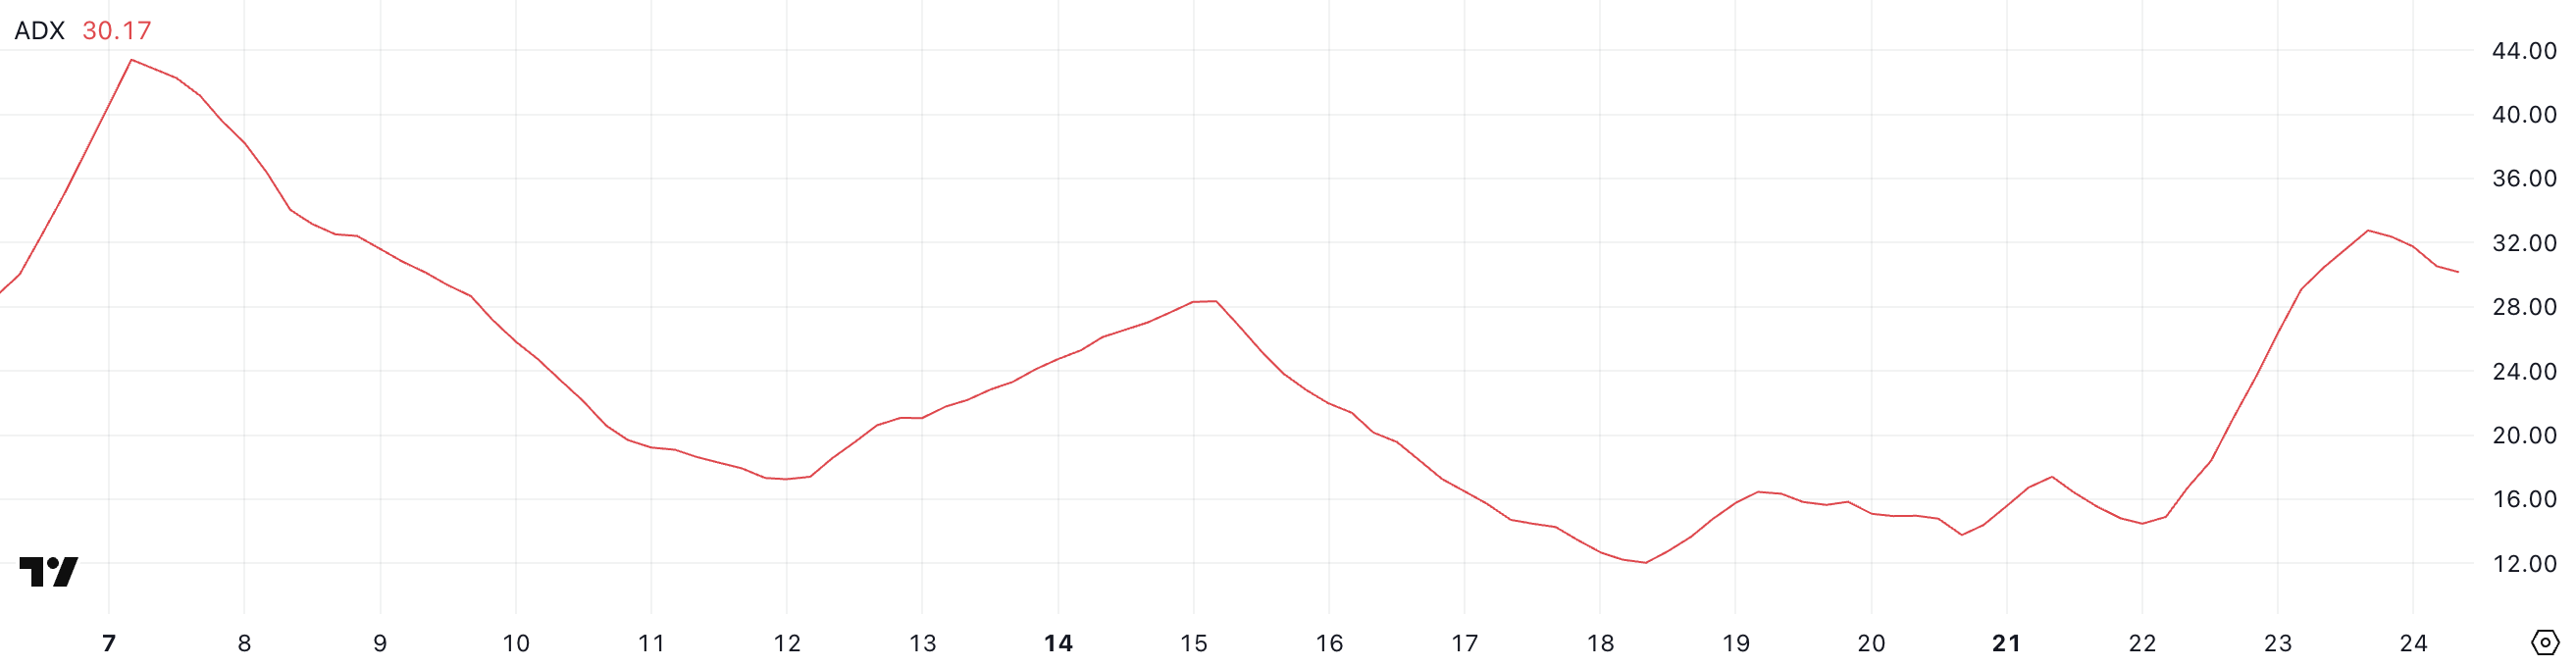
The ADX is a trend strength indicator that ranges from 0 to 100. It does not indicate direction—only the strength of a trend. Readings below 20 suggest a weak or non-existent trend, while values above 25 typically confirm a strong trend.

ADA’s current ADX at 30.17 reflects a healthy uptrend still in play, although the slight dip may suggest the trend’s momentum is stabilizing rather than accelerating.

As long as ADA maintains this level, the uptrend remains intact, but traders should watch for any further decline in ADX that could hint at waning strength.

Cardano Whales Return—Is Accumulation Back On?

The number of Cardano whale addresses—wallets holding between 1 million and 10 million ADA—has slightly increased to 2,408, up from 2,405 on April 22.

This follows a brief decline from 2,421 on April 20, suggesting a small but notable return of larger holders after a short distribution period.

While the change may seem minimal, it marks a potential shift in sentiment among high-stake investors, who often play a key role in driving price trends due to the sheer volume of assets they control.

Addresses Holding Between 1 Million and 10 Million ADA.
Addresses Holding Between 1 Million and 10 Million ADA. Source: Santiment.

Tracking whale activity is crucial because these large holders can significantly influence the market. When whales accumulate, it’s often viewed as a sign of confidence and can act as a leading indicator of upward price movement.

Conversely, when whales begin to offload their holdings, it may signal weakening conviction or an expectation of short-term price drops.

The recent uptick from 2,405 to 2,408 may indicate a renewed interest among whales in accumulating ADA, hinting at a possible rebound or continued strength in price—especially if this trend continues.

ADA’s Uptrend Holds, But Key Support Must Survive

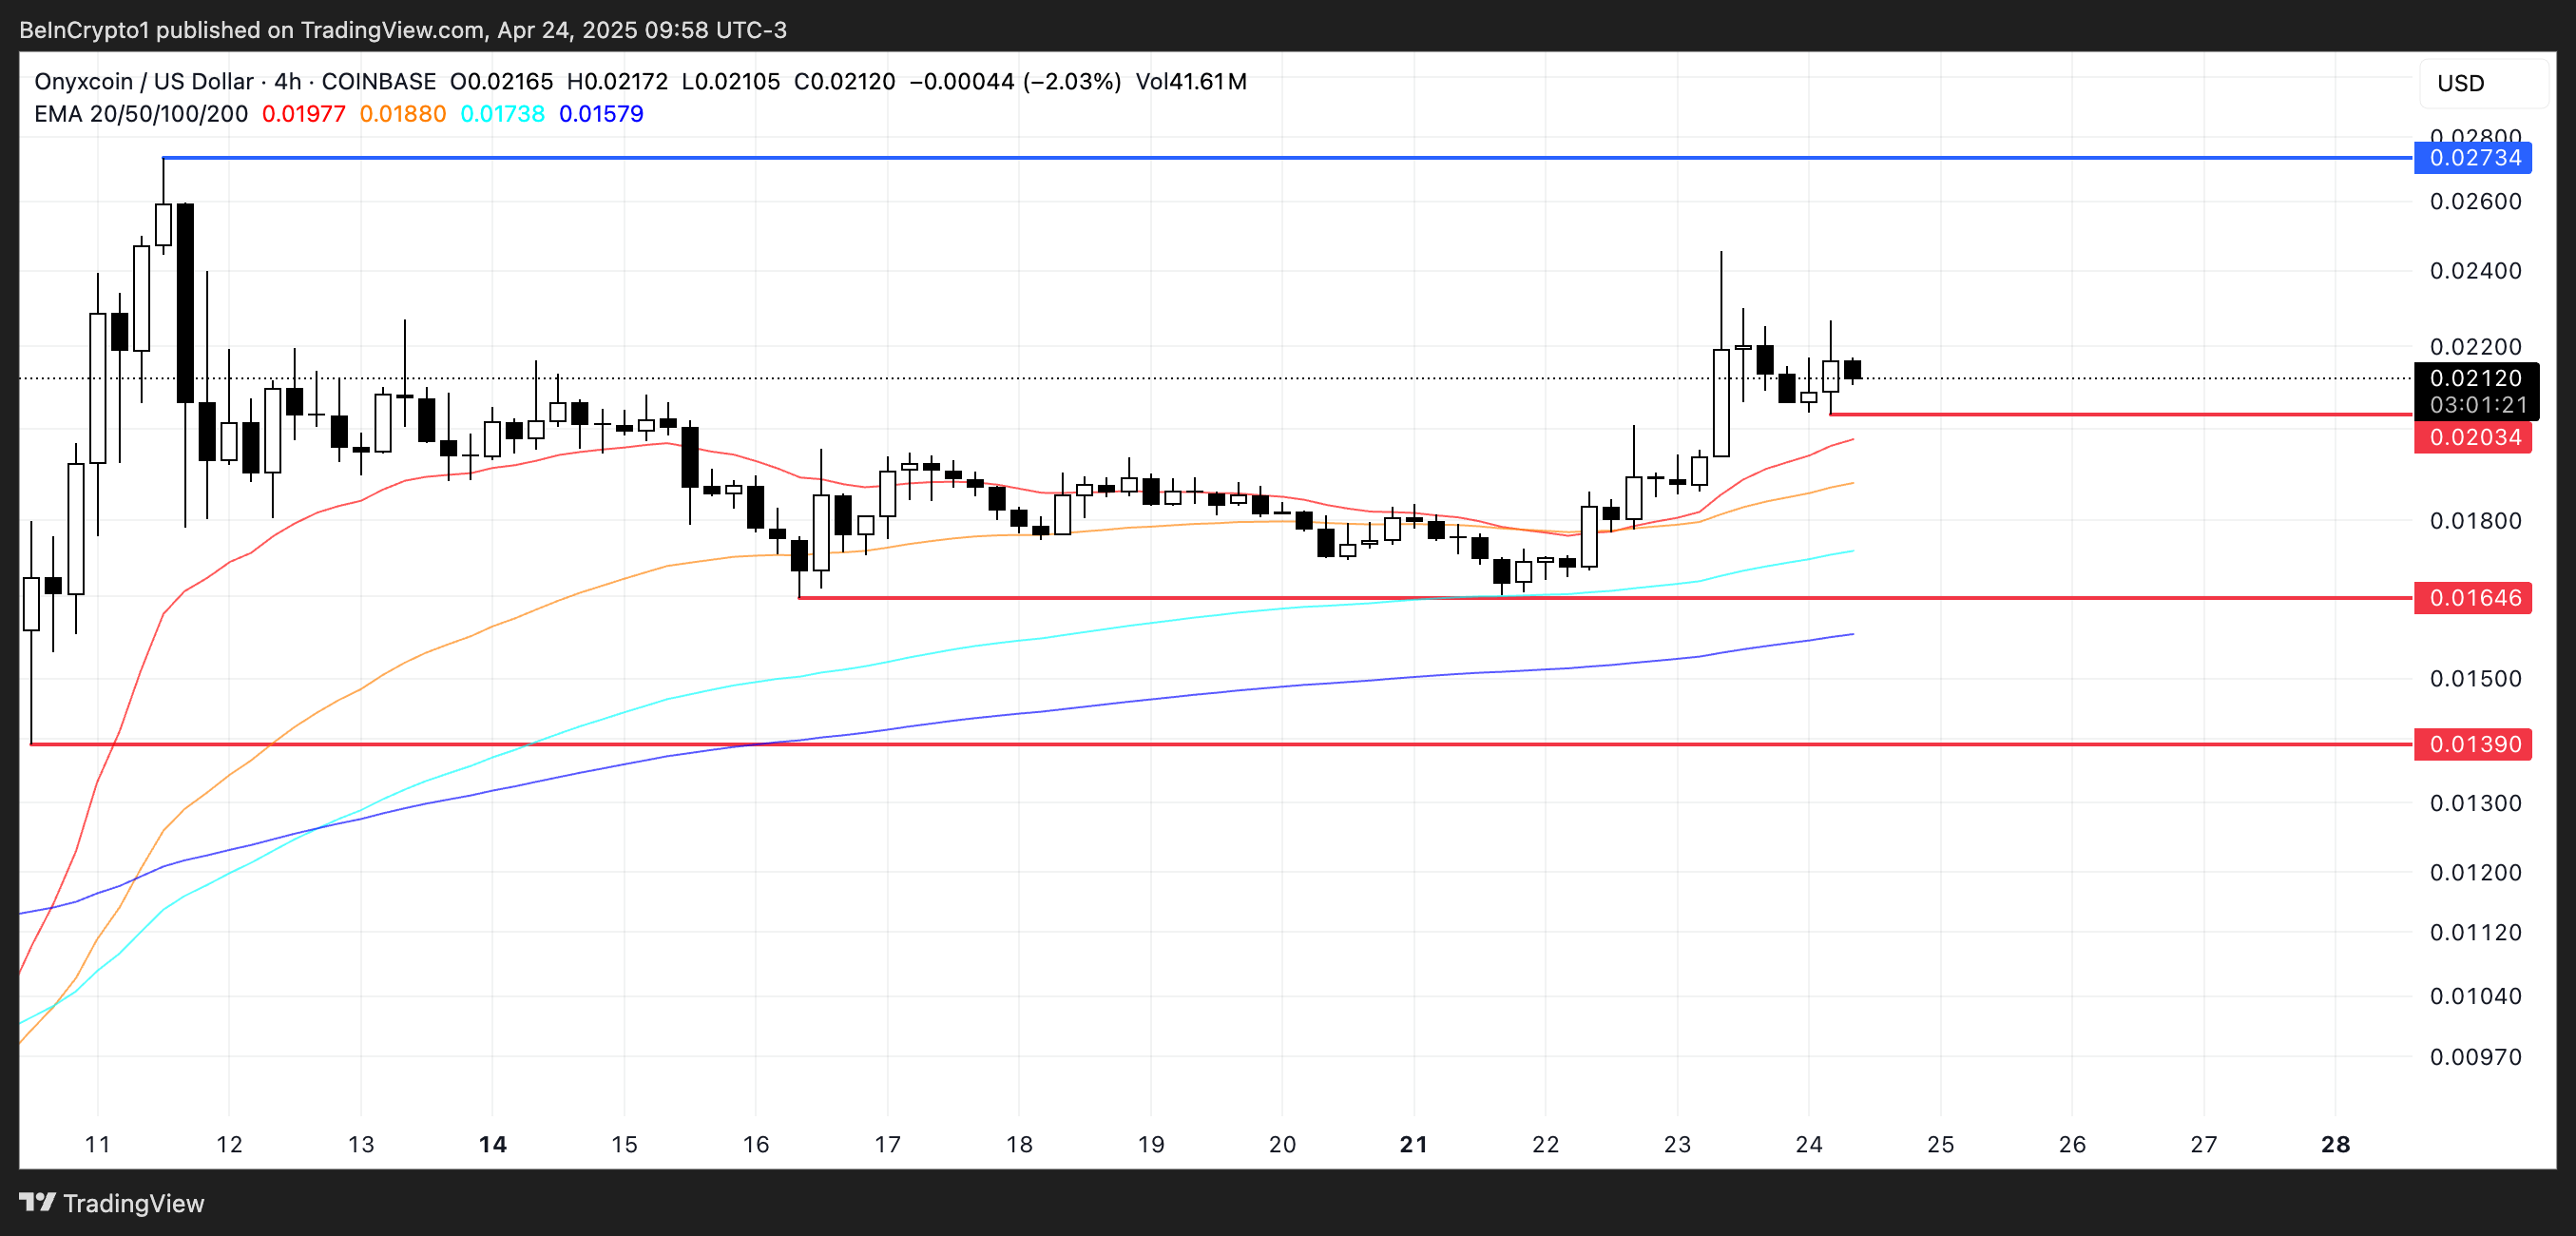
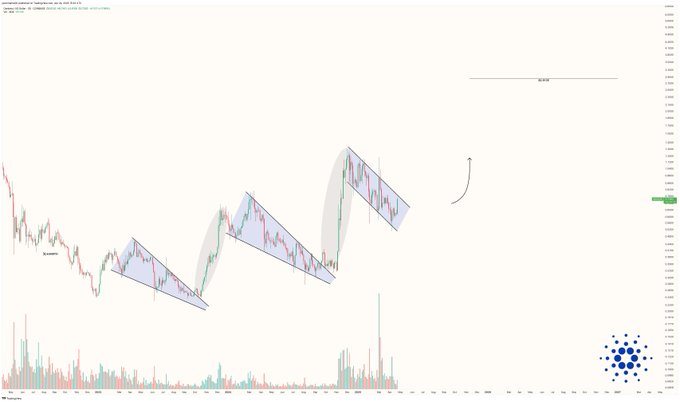
According to its EMA lines, Cardano price remains in an uptrend, with short-term moving averages still above the long-term ones—a classic sign of sustained bullish momentum.

This alignment suggests the broader trend favors the bulls despite recent price consolidation.

ADA Price Analysis.
ADA Price Analysis. Source: TradingView.

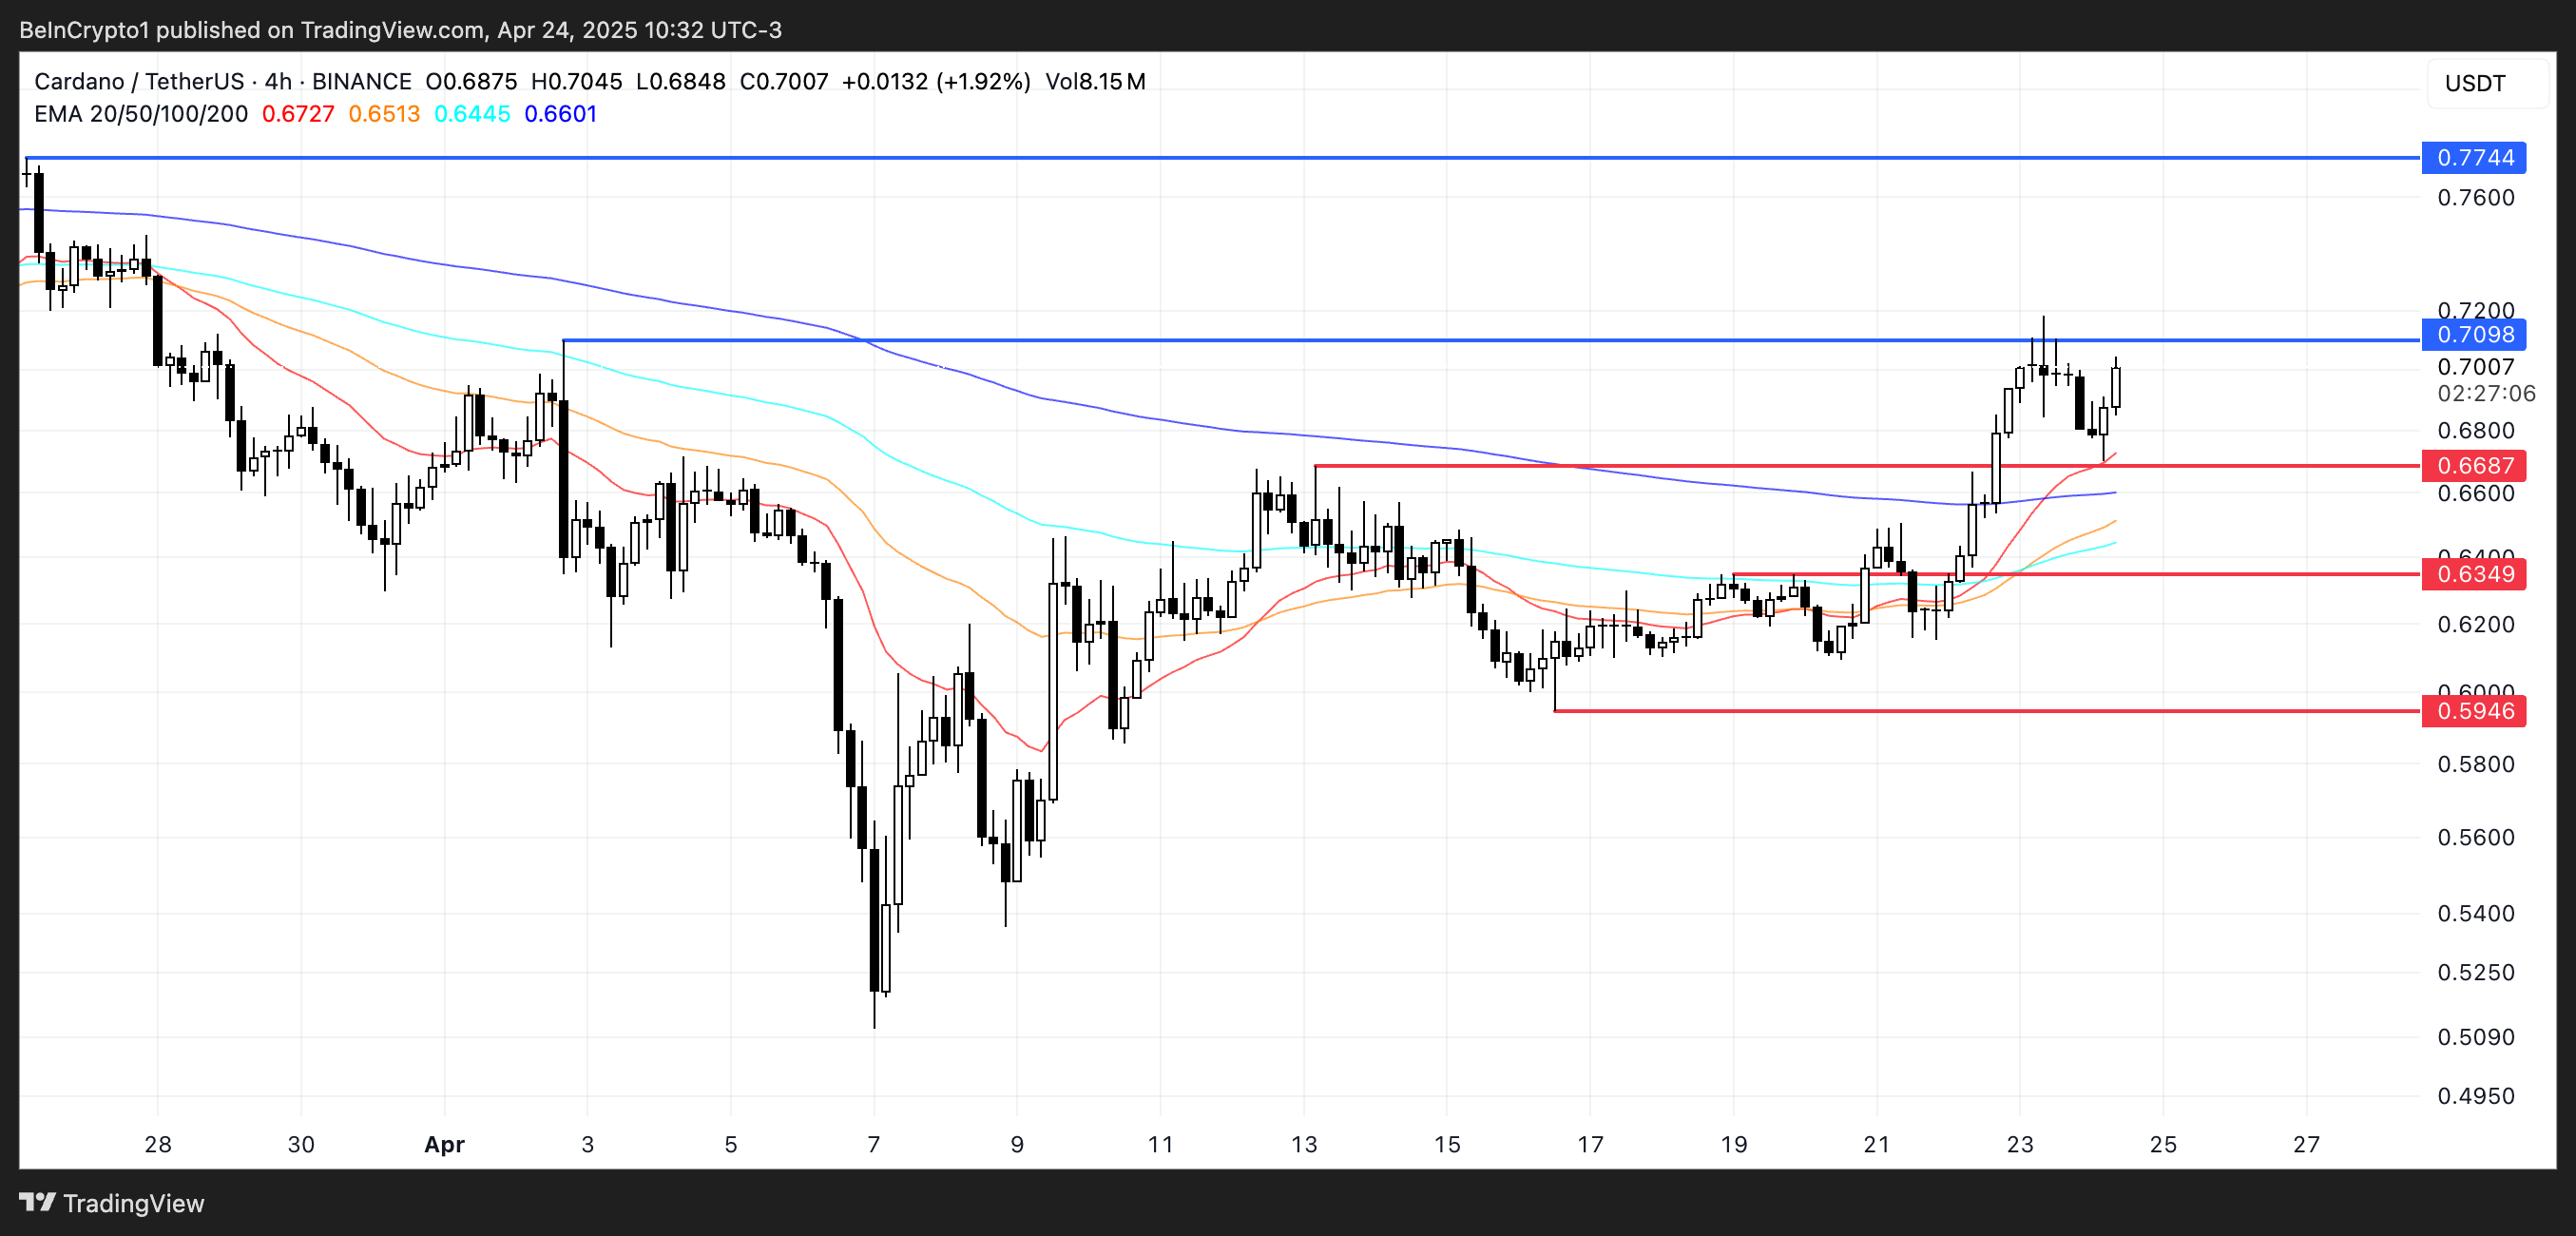
However, ADA is trading within a tight range, facing resistance at $0.709 and supported at $0.668, setting the stage for a potential breakout or breakdown.

If the $0.668 support is tested and fails, ADA could decline toward the next support level at $0.634, and a deeper slide might push it down to $0.59, marking a more significant correction.

Conversely, a clean break above $0.709 resistance would likely trigger renewed bullish momentum, with the next upside target around $0.77.

The post Cardano Whales Start Buying Again as ADA Price Holds a Tight Range appeared first on BeInCrypto.

Onyxcoin (XCN) Faces Crucial Test After April’s Explosive Rally

Onyxcoin (XCN) has been one of April’s standout performers, soaring 132% month-to-date and nearly 10% in the past week. Trading volume has surged as well, climbing over 82% in the past day to reach $208.47 million, reflecting heightened interest and activity.

As the rally matures, key momentum and trend indicators start to shift. RSI has dipped, BBTrend has turned negative, and XCN is now testing a crucial support zone. With price action at a pivotal level, the next move could define whether this breakout continues or fades into a deeper pullback.

Onyxcoin RSI Dips—Is the Rally Losing Steam?

Onyxcoin is showing signs of cooling off after a sharp rally, with its Relative Strength Index (RSI) dropping to 63.21 from a peak of 75 just a day earlier, after its continued momentum that turned it into one of the best-performing altcoins of April.

The token saw an aggressive momentum shift over the past few sessions, with its RSI climbing from 36 on April 21 to 75 by April 23—reflecting a fast-paced surge in buying pressure.

While the move initially indicated overbought conditions, today’s dip to 63.21 suggests that momentum is easing, although it remains in bullish territory.

XCN RSI.
XCN RSI. Source: TradingView.

The RSI is a popular momentum oscillator that ranges from 0 to 100, often used to assess whether an asset is overbought or oversold.

Readings above 70 typically indicate overbought conditions, signaling that a pullback could be imminent, while levels below 30 suggest oversold territory and a potential buying opportunity. With XCN’s RSI now at 63.21, it implies the recent rally has lost some steam but still holds a bullish bias.

This could mean a brief consolidation or minor pullback is likely before any renewed push higher, especially if buyers step back above key support levels.

Onyxcoin BBTrend Turns Bearish Again—Trouble Ahead?

Onyxcoin BBTrend has sharply reversed, currently sitting at -5.53 after briefly touching a high of 3 yesterday. This marks a notable shift, considering the indicator had remained in negative territory between April 17 and April 23.

The sudden drop back into a strongly negative reading suggests the bullish momentum that fueled the recent rally may have been short-lived, and sellers could be regaining control in the short term.

XCN BBTrend.
XCN BBTrend. Source: TradingView.

The BBTrend (Bollinger Band Trend) is a volatility-based momentum indicator that helps identify the strength and direction of price trends. Readings above +1 suggest a strong uptrend, while readings below -1 indicate a strong downtrend.

A move back to -5.53 signals that bearish pressure has returned and is intensifying.

This could mean that XCN’s recent price rebound may face increasing headwinds, with a possible return to support levels unless renewed buying interest reverses the trend again.

XCN Bulls Need to Hold the Line—Or Risk 35% Drop

Onyxcoin price is hovering just above a key support level of $0.020, a critical zone that could determine its next major move.

The EMA lines remain bullish, with short-term averages above long-term ones, suggesting the broader trend still leans upward.

If this support holds firm, XCN could rebound and target the resistance at $0.027. A break above that level could open the path toward $0.030—a price not seen since February 2.

XCN Price Analysis.
XCN Price Analysis. Source: TradingView.

However, if the $0.020 support fails, the technical outlook could quickly shift bearish.

A drop below this level may push the price toward the next support at $0.016.

Should selling pressure intensify beyond that, XCN could decline to $0.0139, marking a possible 35% correction from current levels.

The post Onyxcoin (XCN) Faces Crucial Test After April’s Explosive Rally appeared first on BeInCrypto.

Fake Vatican Notice Fuels $6.4 Million Surge in Polymarket’s Next Pope Bets

Polymarket’s prediction market for the next Pope crossed $6.4 million in total bets today after a viral hoax falsely claimed the Catholic Church intended to excommunicate gamblers.

The fake announcement, circulated on X by an account with over 240,000 followers, mimicked an official Church statement.

Polymarket Bets on the Next Pope

The viral fake post condemned platforms like Polymarket for turning the sacred papal election into a “speculative exercise” and urged the faithful to treat the Conclave as a spiritual, not financial, matter.

However, the post was quickly debunked. It lacked the Church’s formal tone and formatting, did not capitalize key terms like “Conclave” or “Papal Election,” and unusually named Polymarket directly—something highly improbable from the Vatican.

Although the rumor was fabricated, it inadvertently revealed rare internal data from Polymarket. A screenshot embedded in the hoax suggested that total wagers on the papal successor stood at $2.5 million as of April 21. That figure has since more than doubled.

Polymarket opened the “Next Pope” market in February, well before Pope Francis’ death earlier this week, as speculation around succession grew.

“The Holy See deplores the reduction of the solemn conclave to a mere speculative exercise on platforms such as Polymarket and urges the faithful to uphold the dignity of the papal election as a matter of prayerful discernment rather than profit,” claimed a fake notice published by Yoxic, an X user with over 240,000 followers.

Since the Conclave convened, trading volume has surged. In just three days, bets on the outcome have climbed by nearly 160%

The Catholic Church has largely remained indifferent to the crypto sector, aside from isolated instances like a US archdiocese accepting Bitcoin donations. There’s no indication that Church leaders are paying attention to Polymarket, especially during a pivotal moment like the election of a new Pope.

Still, the sudden spike in trading highlights the intersection of global religion and decentralized speculation. As of today, the “Next Pope” market is one of the most active on Polymarket.

Who Will Be the Next Pope Polymarket
Who Will Be the Next Pope? Source: Polymarket

Polymarket’s surge in betting volume reflects a broader trend: crypto-native platforms are becoming arenas for real-time speculation on major political, cultural, and now religious developments.

While the Catholic Church is unlikely to weigh in on Web3 anytime soon, the spike in interest reveals how digital markets increasingly reflect—and amplify—the intensity of public discourse.

The post Fake Vatican Notice Fuels $6.4 Million Surge in Polymarket’s Next Pope Bets appeared first on BeInCrypto.

Michael Saylor Predicts BlackRock’s IBIT Will Be Biggest ETF In 10 Years

Michael Saylor Predicts BlackRock's IBIT Will Be Biggest ETF In 10 Years

Michael Saylor, the Executive Chairman of Strategy Inc., made a strong statement about the future of the BlackRock iShares Bitcoin ETF (IBIT) at an investor event in New York City. Speaking at the Bitcoin conference hosted by Bitwise, he predicted that IBIT would become the biggest exchange-traded fund in the world over the next decade.

Michael Saylor on BlackRock Bitcoin ETF

In a recent post on X, American Journalist Eleanor Terrett reported that Michael Saylor confidently stated IBIT would become the world’s largest ETF within the next ten years. His prediction was considered valid, considering his firm has a deep involvement in the Bitcoin market.

Strategy currently owns 538,200 Bitcoin units. Between April 14 and April 20, the company purchased 6,556 BTC at an average price of $84,785, spending around $555.80 million. This brings the total value of Strategy’s Bitcoin holdings to $36.47 billion, bought at an average price of $67,766 per unit.

It is essential to say that Saylor’s recent comments about BlackRock’s IBIT are not just empty talk. If anything, his firm has consistently increased its Bitcoin holdings, showing he believes in the digital currency for the long term. 

His support for IBIT shows that same belief, especially as more institutions continue to enter the Bitcoin ETF space.

BlackRock Bitcoin ETF IBIT: Current Milestones

It is worth noting that BlackRock’s iShares Bitcoin Trust has already seen dramatic growth since its approval last year. In an earlier update, CoinGape reported that by December 2024, it had surpassed $50 billion in assets under management and had grown further to $52.33 billion by January 2025 when Bitcoin ETFs turned 1.

This growth made IBIT the largest Bitcoin ETF, ahead of Invesco QQQ Trust Series and Fidelity’s Wise Origin Bitcoin Fund, which hold $18.3 billion and $19.681 billion, respectively.

In the broader market, spot Bitcoin ETFs now manage over 1 million units valued at over $95 billion. IBIT controls nearly 48.7% of the U.S. spot Bitcoin ETF market. 

The speed of this growth is striking. While gold ETFs took two decades to reach $128 billion, Bitcoin ETFs have crossed $95 billion in just one year.

Bitcoin Growth and Market Outlook

CoinMarketCap data shows that Bitcoin traded at $92,889.25, down 0.97% in the past 24 hours. The largest cryptocurrency recently outpaced Silver and Amazon, becoming the sixth most valuable asset globally.

Based on market perception, this rising demand is driven by concerns around inflation and broader global uncertainty. Investors are now looking to Bitcoin as a hedge and long-term value store.

Bitcoin is approaching $95,000, a key psychological level. An earlier BTC price analysis hints that the coin is on track for $98,000. However, macro volatility or high inflation may prompt profit-taking. Support is at $91,000 and $88,500. Some analysts believe BTC could retest the $100,000 breakout level if conditions align.

The post Michael Saylor Predicts BlackRock’s IBIT Will Be Biggest ETF In 10 Years appeared first on CoinGape.

Helium Network Announces Strategic Partnership With AT&T: What Next for $HNT Price?

Helium Price Up 22% This Week! Is $6.50 Next or Another Crash?

The post Helium Network Announces Strategic Partnership With AT&T: What Next for $HNT Price? appeared first on Coinpedia Fintech News

  • The AT&T subscribers can connect to Helium’s community-built Wi-Fi network.
  • The Helium network has grown to over 800k daily users, thus increasing the utility of HNT tokens.
  • The HNT price is on the cusp of at least a 100 percent rally following a successful bullish rebound.

Helium (HNT) network, a decentralized physical infrastructure network (DePIN), announced a strategic partnership with AT&T Inc. (NYSE: T), a veteran telecommunication company with a significant presence in the North American market. The two entities intend to enhance WiFi coverage across the United States,

Furthermore, AT&T subscribers can now connect to Helium’s community-built WiFi network, which consists of more than 93.5k community-operated WiFi hotspots. In the past, several mobile carriers – led by Telefónica’s Movistar and other Mobile Network Operators (MNOs) and Mobile Virtual Network Operators (MVNOs) – have joined the Helium network to enhance their WiFi coverage.

“Working with AT&T is a massive step forward in our mission to bring affordable and accessible connectivity to the masses. Teaming up with such a global leader in the industry allows us to rapidly accelerate the adoption of Helium and provide real-world value to both AT&T and their subscribers,” Amir Haleem, Co-founder of Helium and CEO of Helium Mobile, noted.

HNT Price Ready for Liftoff

Following the collaboration announcement, HNT’s price gained nearly 6 percent to trade at about $3.79 on Thursday, during the mid-North American trading session. As a result, the small-cap altcoin, with a fully diluted valuation of about $844 billion and a 24-hour average trading volume of about $20 million, has gained over 44 percent in the past two weeks.

In the daily timeframe, HNT price has already retested the recent macro bullish breakout, and on the cusp of rallying towards a crucial resistance level around $9.7 in the coming weeks. Moreover, the daily MACD has already crossed above the signal line for the first time in 2025, signaling the buyers are gaining momentum.

The post Helium Network Announces Strategic Partnership With AT&T: What Next for $HNT Price? appeared first on Coinpedia Fintech News
The AT&T subscribers can connect to Helium’s community-built Wi-Fi network. The Helium network has grown to over 800k daily users, thus increasing the utility of HNT tokens. The HNT price is on the cusp of at least a 100 percent rally following a successful bullish rebound. Helium (HNT) network, a decentralized physical infrastructure network (DePIN), …

Analyst Predicts Cardano Price 260% Rally To $2.70, Here’s When

Analyst Predicts Cardano Price 260% Rally To $2.70, Here's When

Crypto analyst Javon Marks has identified a potential breakout for the Cardano price and forecasts a substantial price increase. The analyst suggests that ADA price could rise by over 260%, with price targets ranging from $2.70 to $2.91.

Cardano Price Eyes 260% Rally To $2.70

Cardano’s price has shown a steady recovery in recent days, with a notable 2.97% increase in the last 24 hours. Meanwhile, according to crypto analyst Javon Marks, Cardano’s chart shows an ascending triangle pattern, often viewed as a bullish continuation signal. This pattern occurs when the price makes higher lows while the resistance level remains relatively flat. 

The consistently higher lows suggest growing buying pressure, indicating buyers are willing to accumulate ADA at higher prices. The breakout probability increases as the ADA price nears the triangle’s upper resistance line.

Image

According to Javon Marks, substantial upward momentum could be seen once ADA breaks through the upper resistance level. A similar breakout in the past resulted in a nearly 300% price increase. If this historical pattern holds, ADA could reach its target price range of $2.70 to $2.91, representing a 261% gain. The consistent testing of the resistance level indicates that the breakout might be imminent, making it a favorable entry point for investors.

Long-Term Holders Show Confidence in Cardano Price

Another factor contributing to the bullish outlook for ADA is the increase in long-term holders (Hodlers). Data from IntoTheBlock shows a steady rise in the number of ADA held for over one year, with the Hodlers’ balance increasing by 1.81%. This data points to a growing investor confidence in Cardano’s long-term potential. 

Additionally, the number of medium-term holders (Cruisers) holding for 1-12 months has risen by 7.65%. These increases suggest that more investors are holding onto their ADA rather than engaging in short-term speculative trading.

Cardano Ownership By Time Held (Source: IntotheBlock)

Long-term holders tend to accumulate assets during bullish market phases. The rise in Hodlers’ balance, which has seen an increase in holding time of 77.53% in the last 7 days, suggests that ADA’s investors believe in the project’s future and are willing to lock in their positions. This trend aligns with the broader market sentiment that Cardano is on track for a potential breakout, supported by long-term investor commitment. Furthermore, the balance of medium-term holders has also risen, signaling that more people are shifting their ADA into longer-term positions.

Is a Golden Cross Looming for ADA Price?

In addition to the chart pattern and increasing long-term holders, several technical indicators support a positive price outlook for Cardano. One such indicator is the 50-day Simple Moving Average (SMA) nearing a crossing above the 200-day SMA. This crossing, called Golden Cross, often signals the start of a strong upward movement, as it suggests that the short-term trend is gaining strength. Moreover, the open interest for Cardano’s derivatives is currently at $879.32 million, reflecting a 13.78% increase. This uptick in open interest further supports Cardano’s bullish outlook.

ADAUSD 4hr price chart (Source: TradingView)

Moreover, the Relative Strength Index (RSI) is currently near 70.79 in the overbought zone. While this typically signals an overbought condition, the price can continue rising even with high RSI levels during a strong uptrend. The RSI’s upward trajectory indicates that ADA still has momentum, supporting Marks’ forecast of a potential breakout.

The Chaikin Money Flow (CMF) is another positive indicator currently at +0.11. This suggests that more money flows into Cardano, reflecting increased buying pressure and continued demand for ADA. As the CMF remains positive, the bullish sentiment surrounding Cardano will likely persist.

The post Analyst Predicts Cardano Price 260% Rally To $2.70, Here’s When appeared first on CoinGape.

Expert Reveals Pi Network’s Progress Ahead Consensus 2025

Expert Reveals Pi Network's Progress Ahead Consensus 2025

Crypto expert Dr. Altcoin recently highlighted the progress made by the Pi Core Team (PCT) to stabilize the Pi Network ecosystem ahead of the Consensus 2025 conference. The expert had previously asserted that this conference was pivotal for the ecosystem, even as the Pi coin price looks to reclaim the $1 level.

Pi Network’s Progress Ahead Of Consensus 2025 Conference

In an X post, Dr. Altcoin stated that the Pi Network team is making progress within the Pi ecosystem as the Consensus 2025 summit in Toronto approaches. He revealed that the team recently approved the decentralized application Fruity Pi with a purple check mark.

The expert added that the Pi Core team (PCT) is also expected to accelerate the deployment and approval of other dApps in the Pi ecosystem, alongside pending Know Your Business (KYB) approvals. In line with this, he asserted that slowly but surely, the ecosystem is getting there.

The expert also recently revealed the Pi Network team’s purchase of Pi coins from centralized exchanges to help stabilize the token’s price. He claimed that the team created a sub-wallet that has already purchased 48.5 million Pi worth $31 million. These purchases are to help prevent the coin from declining amid the recent token unlocks.

Interestingly, the expert also predicted that the Pi coin price could reach triple digits within the next five years. He urged market participants to buy the coin while it is still cheap rather than panicking.

As to what the Pi Core team could do better, the expert believes that they could use the Consensus 2025 conference as an opportunity to showcase the Pi ecosystem. He claims that this conference will be pivotal for the Pi Network.

HTX Hints Again At A Potential Pi Listing

In another X post, Dr. Altcoin drew the community’s attention to the HTX exchange again, hinting at a potential Pi Network listing. The exchange made an X post that included Pi’s logo, suggesting it could soon list the altcoin.

As CoinGape reported, HTX previously unveiled a cryptic hint on Pi coin listing on the exchange. Community members also suggested that the exchange could list the Pi coin through a verified onboarding process.

This listing would undoubtedly be bullish for the token’s price, even as other top crypto exchanges, such as Binance and Bybit, remain silent on listing the altcoin.

The post Expert Reveals Pi Network’s Progress Ahead Consensus 2025 appeared first on CoinGape.

What’s Next for the Chainlink (LINK) Price-Will it Reclaim $20 Before the End of the Month?

The post What’s Next for the Chainlink (LINK) Price-Will it Reclaim $20 Before the End of the Month? appeared first on Coinpedia Fintech News

The recent rise in the bullish momentum has elevated the markets above the bearish captivity to some extent. The Bitcoin price surged close to $94,000 but despite the drop below $93,000, the bulls are trying hard to keep the rally above the range. This stability within the top crypto has kept up the optimism among the market participants. As a result, the altcoins like Chainlink (LINK) demonstrate a huge potential of a 45% rise. 

The LINK price surged over 14% this week, hitting close to $15, displaying a notable rally this week. This positive momentum brought the token close to its recent 30-day high of $15.99. One of the main reasons for being bullish on Chainlink is the rising investor confidence, as over $120 million worth of LINK was withdrawn from the CEX. Despite the bullish sentiment, some technical signals and analyst forecasts point to volatility ahead, with a potential for a short-term dip if selling pressure escalates. 

The technicals have collectively been flashing a continuation of a bullish trend, with the Supertrend turning bullish, flashing a buy signal. On the other hand, the CMF struck levels above 0.16, hinting towards the growing strength within the markets. Additionally, the MACD showed a bullish crossover, with the levels entering the bullish range for the first time since February. Therefore, the LINK price appears to be poised to reclaim $15 anytime from now, which may transform into a strong base and secure levels at $15.5. This could validate a fresh bullish trend, elevating the levels back above $20. 

Chainlink’s robust week can be attributed to network growth, major institutional partnerships such as with Fidelity, SWIFT, and Aave, and increasing adoption of its real-world asset tokenization solutions. However, price movement is still closely tied to the broader crypto market and Bitcoin’s performance. Overall, the LINK price is enjoying bullish momentum but faces technical headwinds that could result in near-term volatility. 

The post What’s Next for the Chainlink (LINK) Price-Will it Reclaim $20 Before the End of the Month? appeared first on Coinpedia Fintech News
The recent rise in the bullish momentum has elevated the markets above the bearish captivity to some extent. The Bitcoin price surged close to $94,000 but despite the drop below $93,000, the bulls are trying hard to keep the rally above the range. This stability within the top crypto has kept up the optimism among …

Ethereum Price Prediction 2025: ETH Price May Trigger a 10x Rally, if This Trade Setup Plays Out Well

Ethereum Price Prediction 2025_ Standard Chartered’s Shocking Forecast—Is ETH in Trouble

The post Ethereum Price Prediction 2025: ETH Price May Trigger a 10x Rally, if This Trade Setup Plays Out Well appeared first on Coinpedia Fintech News

The crypto markets are experiencing a powerful bullish wave, highlighted by Bitcoin’s breakout and a broad shift in the sentiments. April 2025 has proven exceptionally turbulent for Ethereum, as the month began by exhibiting attempts at recovery, having recently posted a 30-day high of $2,078. However, this momentum was short-lived as the market entered a pronounced bearish phase, driven by the macroeconomic caution and shift in the market sentiments. 

Throughout the month, the ETH price experienced a steep decline, reaching a 30-day low of $1386. The traders rushed to derisk portfolios, leading to heavy selling pressure, which contributed to the slide. Besides, the whale activity added to market jitters but the technicals remaining around the average range point towards a weak bullish momentum and a limited enthusiasm for a quick recovery. 

Despite a decent recovery, the ETH price continues to trade under bearish influence. The bears are currently trying hard to restrict the rally below $1800 as the bullish momentum stumbles after rising above $1780. The conversion & base lines have undergone a bullish crossover, but the Ichimoku cloud is yet to turn bullish, which hints towards a potential pullback that could hinder the progress of the rally for a while. However, if the sentiments flip in favor of the bulls, the price could secure the resistance at $1800 and later head above $2000, which may initiate a fresh bullish rally. 

How High Can Ethereum (ETH) Price Go in 2025?

The Ethereum price in the long term is flashing massive bullish signals as the token appears to have rebounded from the bottom. The current trade setup seems to be identical to that of the previous bull runs and hence, based on this, it can be speculated that the ETH price may undergo a massive upswing and achieve a 5-digit figure soon.

 A popular analyst, CryptoRover, shared the historical chart of Ethereum and pointed towards the similarities between the current price action and the previous one’s. The analyst said that the ETH price is repeating history, which could result in a 3000% upswing, as happened back in 2021. If a similar rise occurs, then the Ethereum price may not only achieve a 5-digit figure but also go way above this range to form a new ATH.

The post Ethereum Price Prediction 2025: ETH Price May Trigger a 10x Rally, if This Trade Setup Plays Out Well appeared first on Coinpedia Fintech News
The crypto markets are experiencing a powerful bullish wave, highlighted by Bitcoin’s breakout and a broad shift in the sentiments. April 2025 has proven exceptionally turbulent for Ethereum, as the month began by exhibiting attempts at recovery, having recently posted a 30-day high of $2,078. However, this momentum was short-lived as the market entered a …

Solana Nears 400 Billion Transactions as SOL Reclaims $150

Solana (SOL) is gaining significant momentum again, both on-chain and in price action. The network is nearing a major milestone of 400 billion total transactions. In the last seven days, SOL has surged over 12% and reclaimed the $150 level for the first time since early March.

From its cycle low of $9.98 in January 2023, Solana has soared over 1400%, backed by growing adoption across its ecosystem. With bullish technical signals, thriving apps like PumpFun and Jito, and talk of a potential run toward $500 in 2025, Solana is once again cementing its place as a top performer in the market.

Solana Network Nears 400 Billion Transactions

Solana is nearing a major milestone. It is less than 2 billion transactions from hitting the 400 billion mark.

This comes as SOL’s price gains fresh momentum, rising over 12% in the past week and breaking above $150 for the first time since March 2, with its DEX trading volume reaching almost $16 billion in the last seven days, more than any other chain.

Solana Transactions Data.
Solana Transactions Data. Source: Solscan.

Since bottoming at $9.98 on January 1, 2023, Solana has skyrocketed by an incredible 1412%, becoming one of the top performers of the current cycle.

But it’s not just price action—this cycle has also brought an explosion of real adoption to the Solana ecosystem. Apps like PumpFun, launched just last year, have quickly become among the most profitable in crypto.

Meanwhile, core protocols like Raydium, Meteora, and Jito continue to generate millions in monthly fees, highlighting the network’s growing utility and economic strength.

Solana RSI Dips but Bullish Momentum Holds

Solana’s Relative Strength Index (RSI) is currently at 64.51, cooling off from a recent high of 77 just a day ago. Interestingly, it has rebounded from an intraday dip to 58.64, signaling a potential shift in short-term momentum.

This fluctuation suggests that while the recent rally may have briefly overheated, buyers are still active, keeping the momentum in bullish territory.

SOL RSI.
SOL RSI. Source: TradingView.

The RSI is a momentum oscillator ranging from 0 to 100, used to evaluate whether an asset is overbought or oversold. Readings above 70 typically suggest overbought conditions, often preceding a pullback, while values below 30 indicate oversold levels and potential buying opportunities.

With SOL’s RSI now sitting at 64.51, it points to continued bullish sentiment without being overstretched.

This level allows for further upside if momentum builds again, but traders will be watching closely to see if the RSI can climb back toward the overbought zone—or if selling pressure starts to mount.

Will Solana Reach $500 in 2025?

The Solana price is trading within a tight range. It faces resistance at $152 and holds support at $147.60.

Its EMA lines remain bullish, with short-term averages above long-term ones, signaling that the broader uptrend is still intact.

If the $152 resistance is broken, SOL could climb toward $160, and with sustained momentum, even target $180.

SOL Price Analysis.
SOL Price Analysis. Source: TradingView.

Looking further ahead, if Solana regains the momentum it had at the end of 2023 and throughout early 2024, it could retest its all-time high of $256 and potentially push toward $300 in the first half of 2025.

Should the overall crypto market recover in the second half and Solana continue leading in DEX volume and developer activity, the $500 mark becomes a realistic long-term target.

However, on the bearish side, a loss of the $147.60 support could open the door for a correction toward $124 or even $112 if the downtrend accelerates.

The post Solana Nears 400 Billion Transactions as SOL Reclaims $150 appeared first on BeInCrypto.