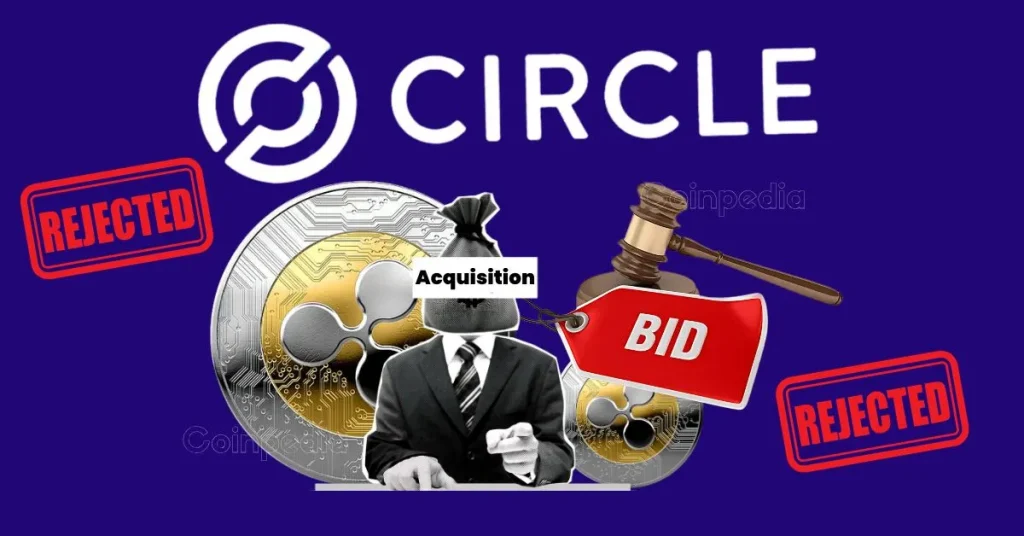
Ripple is back in the headlines, reportedly raising its acquisition offer for Circle, the issuer of USDC. Initial reports suggested Ripple offered between $4 billion and $5 billion, but the offer was rejected by Circle. Now, new sources claim Ripple has increased the bid to $20 billion — though no official confirmation has been made.
Pro-XRP lawyer John Deaton weighed in on the situation. He said that Circle filed its S-1 registration with the SEC on April 1, 2025, planning to go public on the New York Stock Exchange (NYSE) under the ticker “CRCL.” JPMorgan Chase and Citigroup are listed as the lead underwriters, with the IPO expected to launch this summer.
Circle filed its S-1 with the SEC on April 1, 2025, planning to list on the NYSE under the ticker “CRCL,” with JPMorgan Chase and Citigroup as lead underwriters. The IPO is expected this summer. Circle is aiming for a valuation between $4 billion and $5 billion for its IPO.… https://t.co/G8WijZzg9g
Circle is reportedly targeting a valuation between $4 billion and $5 billion, which aligns with Ripple’s initial offer. However, this is still significantly lower than the $9 billion valuation Circle had aimed for during a failed SPAC merger back in 2022.
Deaton suggests Circle rejected the $5B offer because it expects its post-IPO value to be higher, possibly close to or above that $9B mark. He also highlighted the regulatory shift in favor of crypto, with pro-crypto policies and the possible passing of the STABLE GENIUS Act, as signs that a $10B+ deal wouldn’t be unrealistic.
Adding another layer of speculation, Deaton questioned Ripple’s relationship with Coinbase, which already owns a minority stake in Circle. This raises the possibility of a bidding war between major crypto players.
As of now, both Ripple and Circle have not confirmed any details of ongoing acquisition talks.
The post Coinbase’s Stake in Circle Could Block Ripple’s Alleged $20 Billion Offer appeared first on Coinpedia Fintech News
Ripple is back in the headlines, reportedly raising its acquisition offer for Circle, the issuer of USDC. Initial reports suggested Ripple offered between $4 billion and $5 billion, but the offer was rejected by Circle. Now, new sources claim Ripple has increased the bid to $20 billion — though no official confirmation has been made. …
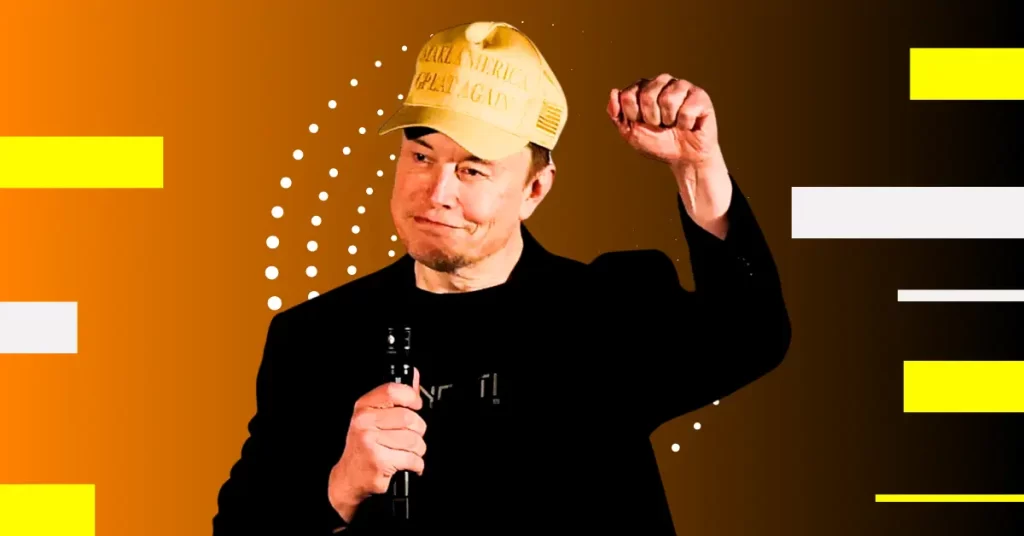
Elon Musk is once again making waves, this time with bold plans to transform X (formerly Twitter) into a comprehensive “Everything App.” At the core of this vision is a financial ecosystem powered by X Money—an upcoming payment platform that may soon support cryptocurrency transactions.
X Money: Merging Social Media, AI, and Payments
X Money aims to turn the X platform into more than just a social network. With features combining messaging, Grok AI integration, and digital transactions, it’s shaping up to be a one-stop app for communication and finance. Expected to launch in mid-2025, the platform could position X as a serious competitor to leading fintech apps, offering users a seamless experience for both social and financial interactions.
Crypto Integration on the Horizon
Anthony Scaramucci, founder of SkyBridge Capital, recently emphasized that Musk is likely to embed cryptocurrency payments into X’s payment system. Given Musk’s longstanding interest in decentralized finance—demonstrated through initiatives at Tesla and SpaceX—this move isn’t surprising.
By allowing crypto payments, X could appeal to a broader, tech-savvy audience already engaged with digital assets like Bitcoin and Dogecoin. The move aligns with Musk’s vision of diversifying payment options and fostering financial innovation.
Navigating Regulatory Roadblocks
However, introducing crypto transactions isn’t without challenges. Regulatory compliance will be a major hurdle, especially as global financial watchdogs keep a close eye on digital asset usage. To roll out a secure and legally sound crypto service, Musk’s team will have to navigate complex legal frameworks across multiple jurisdictions.
Musk’s ambition to build a super app similar to China’s WeChat is bold—but it won’t be easy. The Western market is already saturated with dominant players in both fintech and social media, making it a tough space to disrupt.
Still, the idea of integrating social networking, AI, and cryptocurrency into one platform is a compelling one. If Musk can overcome the regulatory and competitive challenges, X could redefine how users interact online—financially and socially.
As the world watches, the big question remains: Can Elon Musk turn X into the West’s first true Super App?
Never Miss a Beat in the Crypto World!
Stay ahead with breaking news, expert analysis, and real-time updates on the latest trends in Bitcoin, altcoins, DeFi, NFTs, and more.
The post Elon Musk to Likely Integrate Crypto Payments Into X, Says Anthony Scaramucci appeared first on Coinpedia Fintech News
Elon Musk is once again making waves, this time with bold plans to transform X (formerly Twitter) into a comprehensive “Everything App.” At the core of this vision is a financial ecosystem powered by X Money—an upcoming payment platform that may soon support cryptocurrency transactions. X Money: Merging Social Media, AI, and Payments X Money …
While Ripple captures headlines with its billion-dollar XRP movement and rumored acquisition of Circle, Ruvi AI is cementing its position as a rising star in blockchain innovation. Combining blockchain and artificial intelligence, Ruvi AI offers cutting-edge solutions that provide real-world utility and exceptional investment opportunities.
About Ruvi AI
Ruvi AI is a dynamic platform that integrates blockchain technology with artificial intelligence to deliver practical, scalable solutions for industries. From logistics optimization to fraud prevention, Ruvi AI is transforming industries and redefining investment opportunities with its innovative approach.
A Record-Breaking Presale
Ruvi AI’s presale is generating immense excitement in the blockchain community. Within days of its launch, the project has sold over 10 million tokens, raising more than $100,000. These results are a testament to the strong market confidence in Ruvi AI’s innovative platform and its potential to lead in the evolving blockchain-AI intersection.
The presale is still live, and early investors are rushing to purchase tokens at $0.01, knowing that prices will increase by 50% in the second phase. Industry analysts are optimistic about Ruvi AI’s trajectory, predicting its value could reach $1 shortly after listing, paving the way for phenomenal returns on investment.
VIP Tier 2 Benefits Deliver Value
Ruvi AI’s innovative VIP Tiers offer exclusive rewards for participants. Investors in VIP Tier 2 qualify by purchasing 50,000 RUVI tokens, which are further enhanced by a 40% bonus. This bonus increases the token count to 70,000 RUVI, presenting an unmatched value proposition.
At the projected listing price of $0.07, this returns $4,900, already a remarkable gain on the initial investment. Should the token achieve the expected $1 valuation, the return grows exponentially to $70,000, a highly enticing prospect for savvy investors.
Leaderboard Rewards Incentivize Top Supporters
Ruvi AI is also running an exciting Leaderboard rewards program to acknowledge its most dedicated investors. The top 10 participants receive 500,000 RUVI tokens, valued at $35,000 at the $0.07 listing price. With analysts predicting a rapid rise to $1, this reward could be worth a remarkable $500,000.
Similarly, the top 50 investors secure 250,000 RUVI tokens, translating to $17,500 at listing and $250,000 if the $1 target is reached. Rewards continue across other leaderboard positions, with participants in the top 1,000 receiving 20,000 RUVI tokens, ensuring inclusivity and significant incentives for all levels of contribution.
Expert Perspectives on Ruvi AI
Industry voices have praised Ruvi AI’s potential to revolutionize blockchain applications. A leading analyst commented, “While Ripple’s strategic plays are redefining stablecoin and cross-border payments markets, Ruvi AI is addressing immediate, tangible challenges. By pairing blockchain with AI, Ruvi AI is well-positioned for explosive growth in the near and long term.”
Ruvi AI’s impactful beta product is already solving logistical and fraud detection challenges, underscoring its practicality and scalability. This focus on actionable innovation sets Ruvi AI apart in a competitive blockchain landscape.
Timing Is Everything
Ripple’s audacious plans, including its proposed Circle acquisition and its leadership in cross-border payments, have reignited interest in blockchain-driven innovation. Amid this heightened market activity, Ruvi AI stands out with exceptional presale progress and a strong value proposition for early investors. With token prices set to surge in the next presale phase, time is running out to join this groundbreaking movement at entry-level prices.
The post Ripple’s (XRP) Strategic Moves Dominate Headlines While Ruvi AI (RUVI) Prepares for Altcoin Season with 4,900% Prediction appeared first on Coinpedia Fintech News
While Ripple captures headlines with its billion-dollar XRP movement and rumored acquisition of Circle, Ruvi AI is cementing its position as a rising star in blockchain innovation. Combining blockchain and artificial intelligence, Ruvi AI offers cutting-edge solutions that provide real-world utility and exceptional investment opportunities. About Ruvi AI Ruvi AI is a dynamic platform that …
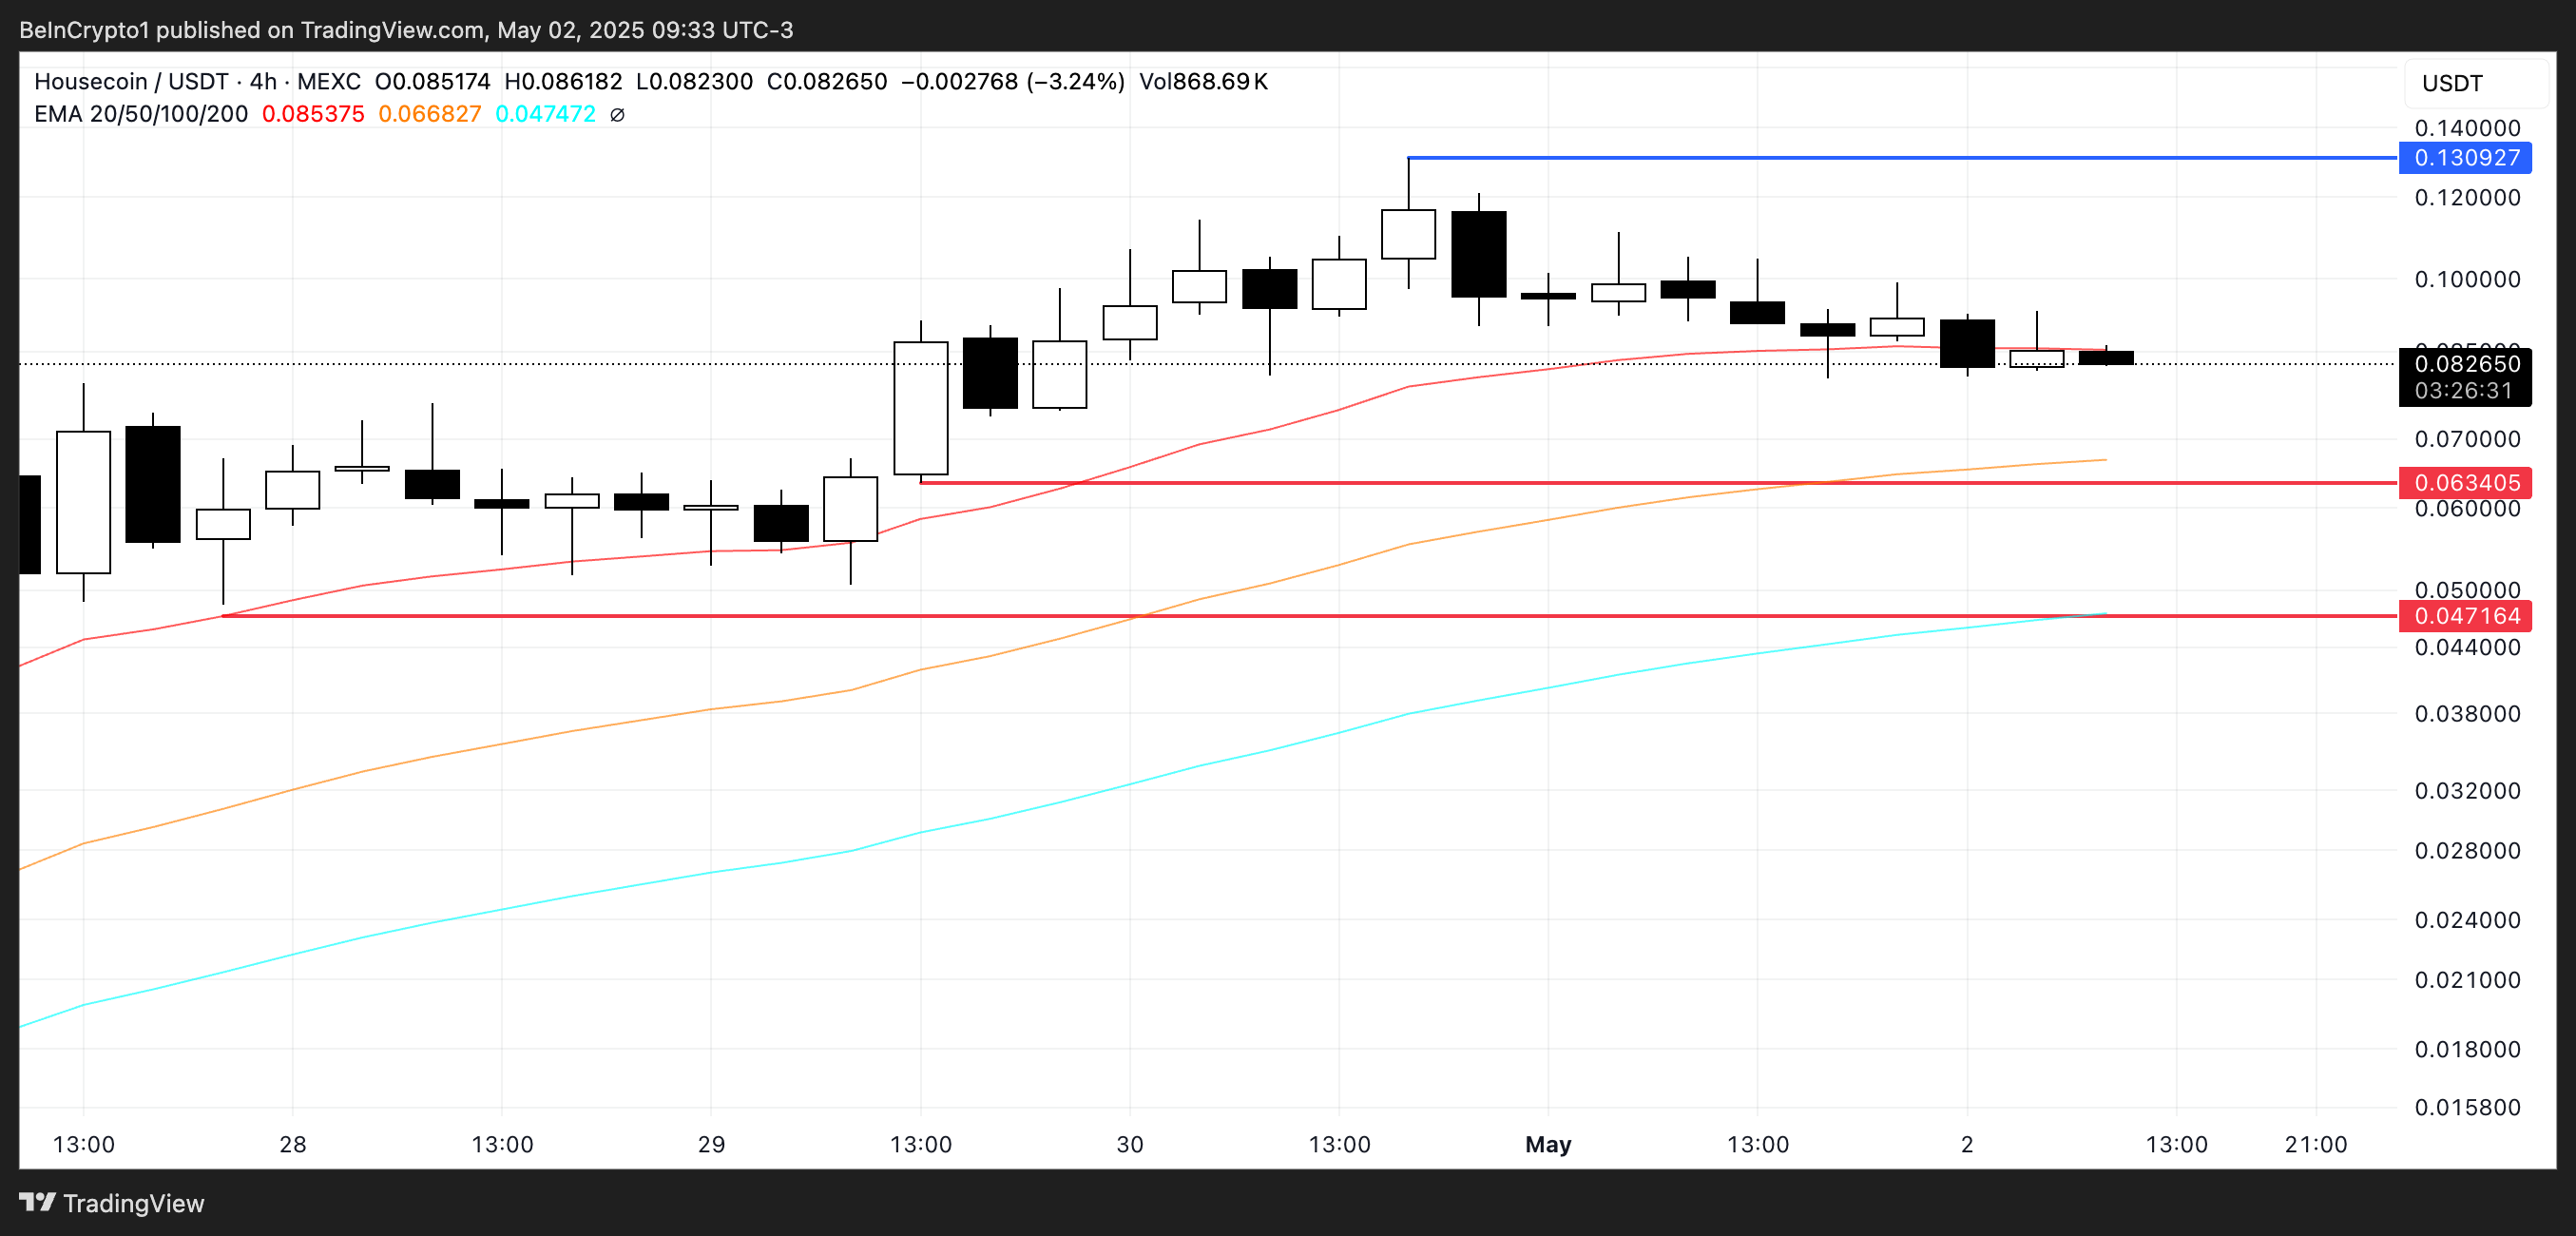
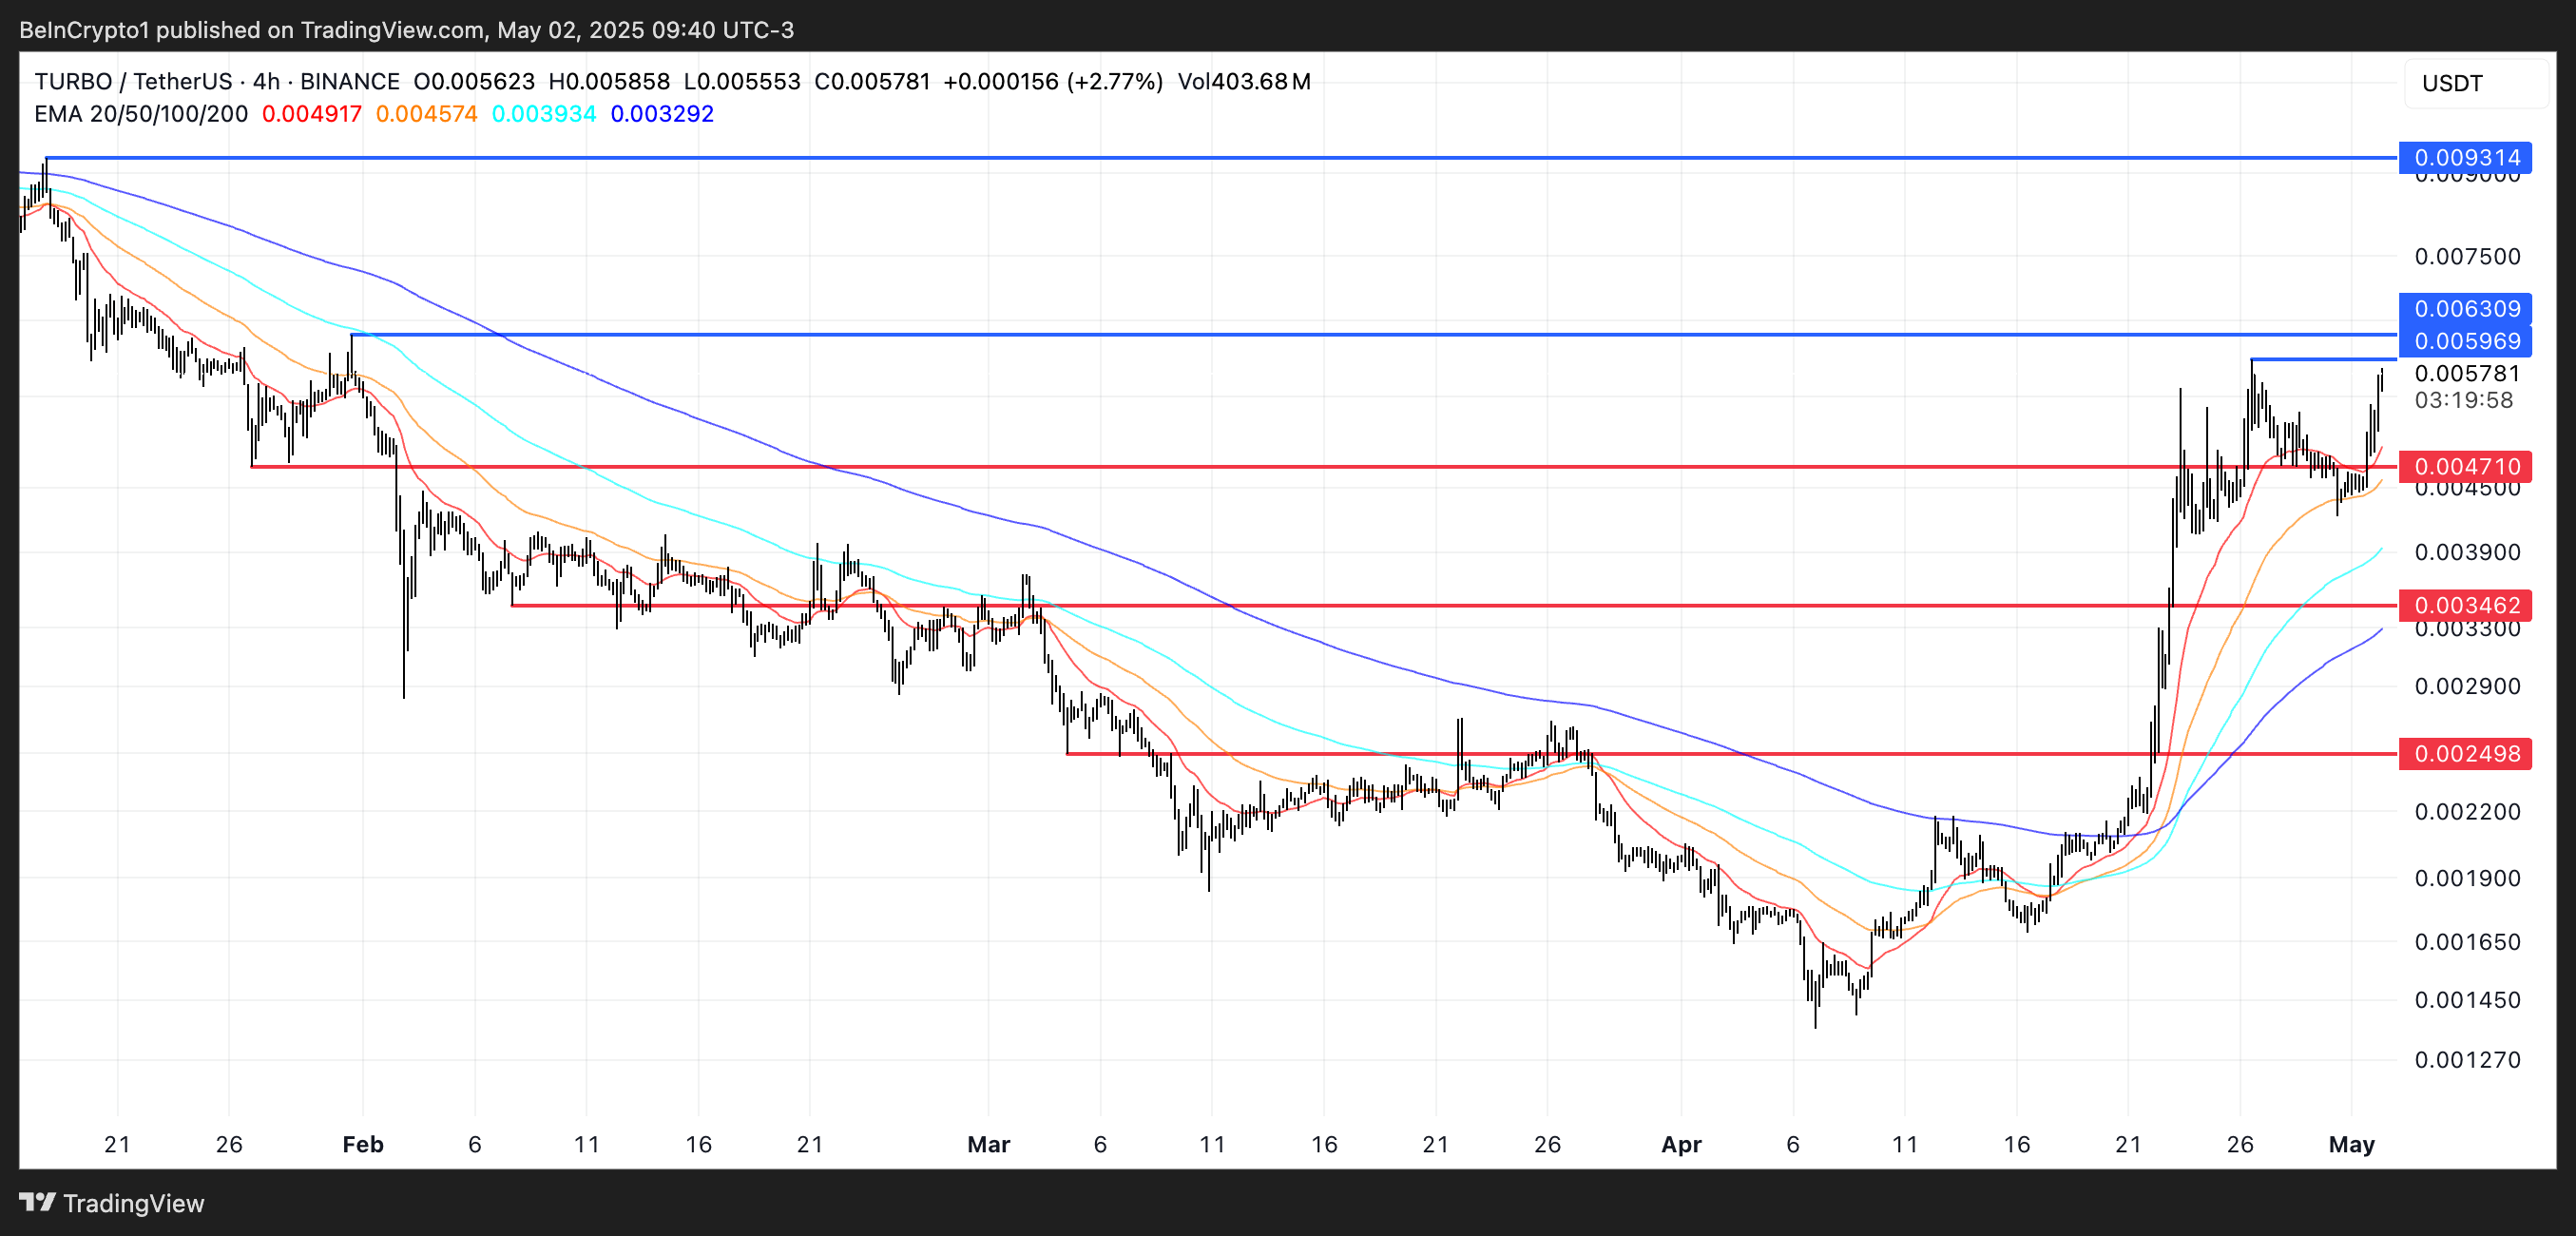
Meme coins to watch today include LUNA, HOUSE, and TURBO. All three are showing strong price action and rising volume. LUNA is up 92% in the past seven days as part of the surging Virtuals Protocol ecosystem.
HOUSE gained nearly 26% despite a short-term pullback and continues to draw attention from Solana meme coin traders. Meanwhile, TURBO spiked 25% in 24 hours, with volume exploding over 200%, signaling growing momentum.
Luna by Virtuals (LUNA)
Launch Date – October 2024
Total Circulating Supply – 1 Billion LUNA
Maximum Supply – 1 Billion LUNA
Fully Diluted Valuation (FDV) – $25.9 million
The Virtuals Protocol ecosystem has been trending, with VIRTUAL up 93% in the past seven days. LUNA followed with a 76% gain, now the fourth-largest token in the ecosystem by market cap, just behind VIRTUAL, AIXBT, and VADER.
If momentum holds, LUNA could test resistance at $0.032. A breakout may push it toward $0.041, opening the door for further upside.
Despite a 15% dip in the last 24 hours, Housecoin is still up nearly 26% on the week. If the pullback continues, key support lies at $0.063—losing that could send it to $0.047.
If buyers return, HOUSE could retest $0.13 and possibly reach $0.15, setting a new all-time high and reigniting the hype.
TURBO
Launch Date – May 2023
Total Circulating Supply – 69 Billion TURBO
Maximum Supply – 69 Billion TURBO
Fully Diluted Valuation (FDV) – $397.69 Million
TURBO has jumped nearly 30% in the past week, with a 25% gain in just 24 hours. Its 24-hour volume surged over 200%, hitting $282 million—about 70% of its market cap—making it one of the most interesting meme coins to watch today.
The metrics used to measure outcomes can be misleading when evaluating blockchain performance. As more blockchain networks emerge, the public needs clear, efficiency-focused metrics, rather than exaggerated claims, to differentiate between them.
In a conversation with BeInCrypto, Taraxa Co-Founder Steven Pu explained that it’s becoming increasingly difficult to compare blockchain performance accurately because many reported metrics rely on overly optimistic assumptions rather than evidence-based results. To combat this wave of misrepresentation, Pu proposes a new metric, which he calls TPS/$.
Why Does the Industry Lack Reliable Benchmarks?
The need for clear differentiation is growing with the increasing number of Layer-1 blockchain networks. As various developers promote the speed and efficiency of their blockchains, relying on metrics that distinguish their performance becomes indispensable.
However, the industry still lacks reliable benchmarks for real-world efficiency, instead relying on sporadic sentimental waves of hype-driven popularity. According to Pu, misleading performance figures currently saturate the market, obscuring true capabilities.
“It’s easy for opportunists to take advantage by driving up over-simplified and exaggerated narratives to profit themselves. Every single conceivable technical concept and metric has at one time or another been used to hype up many projects that don’t really deserve them: TPS, finality latency, modularity, network node count, execution speed, parallelization, bandwidth utilization, EVM-compatibility, EVM-incompatibility, etc.,” Pu told BeInCrypto.
Pu focused on how some projects exploit TPS metrics, using them as marketing tactics to make blockchain performance sound more appealing than it might be under real-world conditions.
Examining the Misleading Nature of TPS
Transactions per second, more commonly known as TPS, is a metric that refers to the average or sustained number of transactions that a blockchain network can process and finalize per second under normal operating conditions.
However, it often misleadingly hypes projects, offering a skewed view of overall performance.
“Decentralized networks are complex systems that need to be considered as a whole, and in the context of their use cases. But the market has this horrible habit of over-simplifying and over-selling one specific metric or aspect of a project, while ignoring the whole. Perhaps a highly centralized, high-TPS network does have its uses in the right scenarios with specific trust models, but the market really has no appetite for such nuanced descriptions,” Pu explained.
Pu indicates that blockchain projects with extreme claims on single metrics like TPS may have compromised decentralization, security, and accuracy.
“Take TPS, for example. This one metric masks numerous other aspects of the network, for example, how was the TPS achieved? What was sacrificed in the process? If I have 1 node, running a WASM JIT VM, call that a network, that gets you a few hundred thousand TPS right off the bat. I then make 1000 copies of that machine and call it sharding, now you start to get into the hundreds of millions of ‘TPS’. Add in unrealistic assumptions such as non-conflict, and you assume you can parallelize all transactions, then you can get “TPS” into the billions. It’s not that TPS is a bad metric, you just can’t look at any metric in isolation because there’s so much hidden information behind the numbers,” he added.
The Taraxa Co-founder revealed the extent of these inflated metrics in a recent report.
The Significant Discrepancy Between Theoretical and Real-World TPS
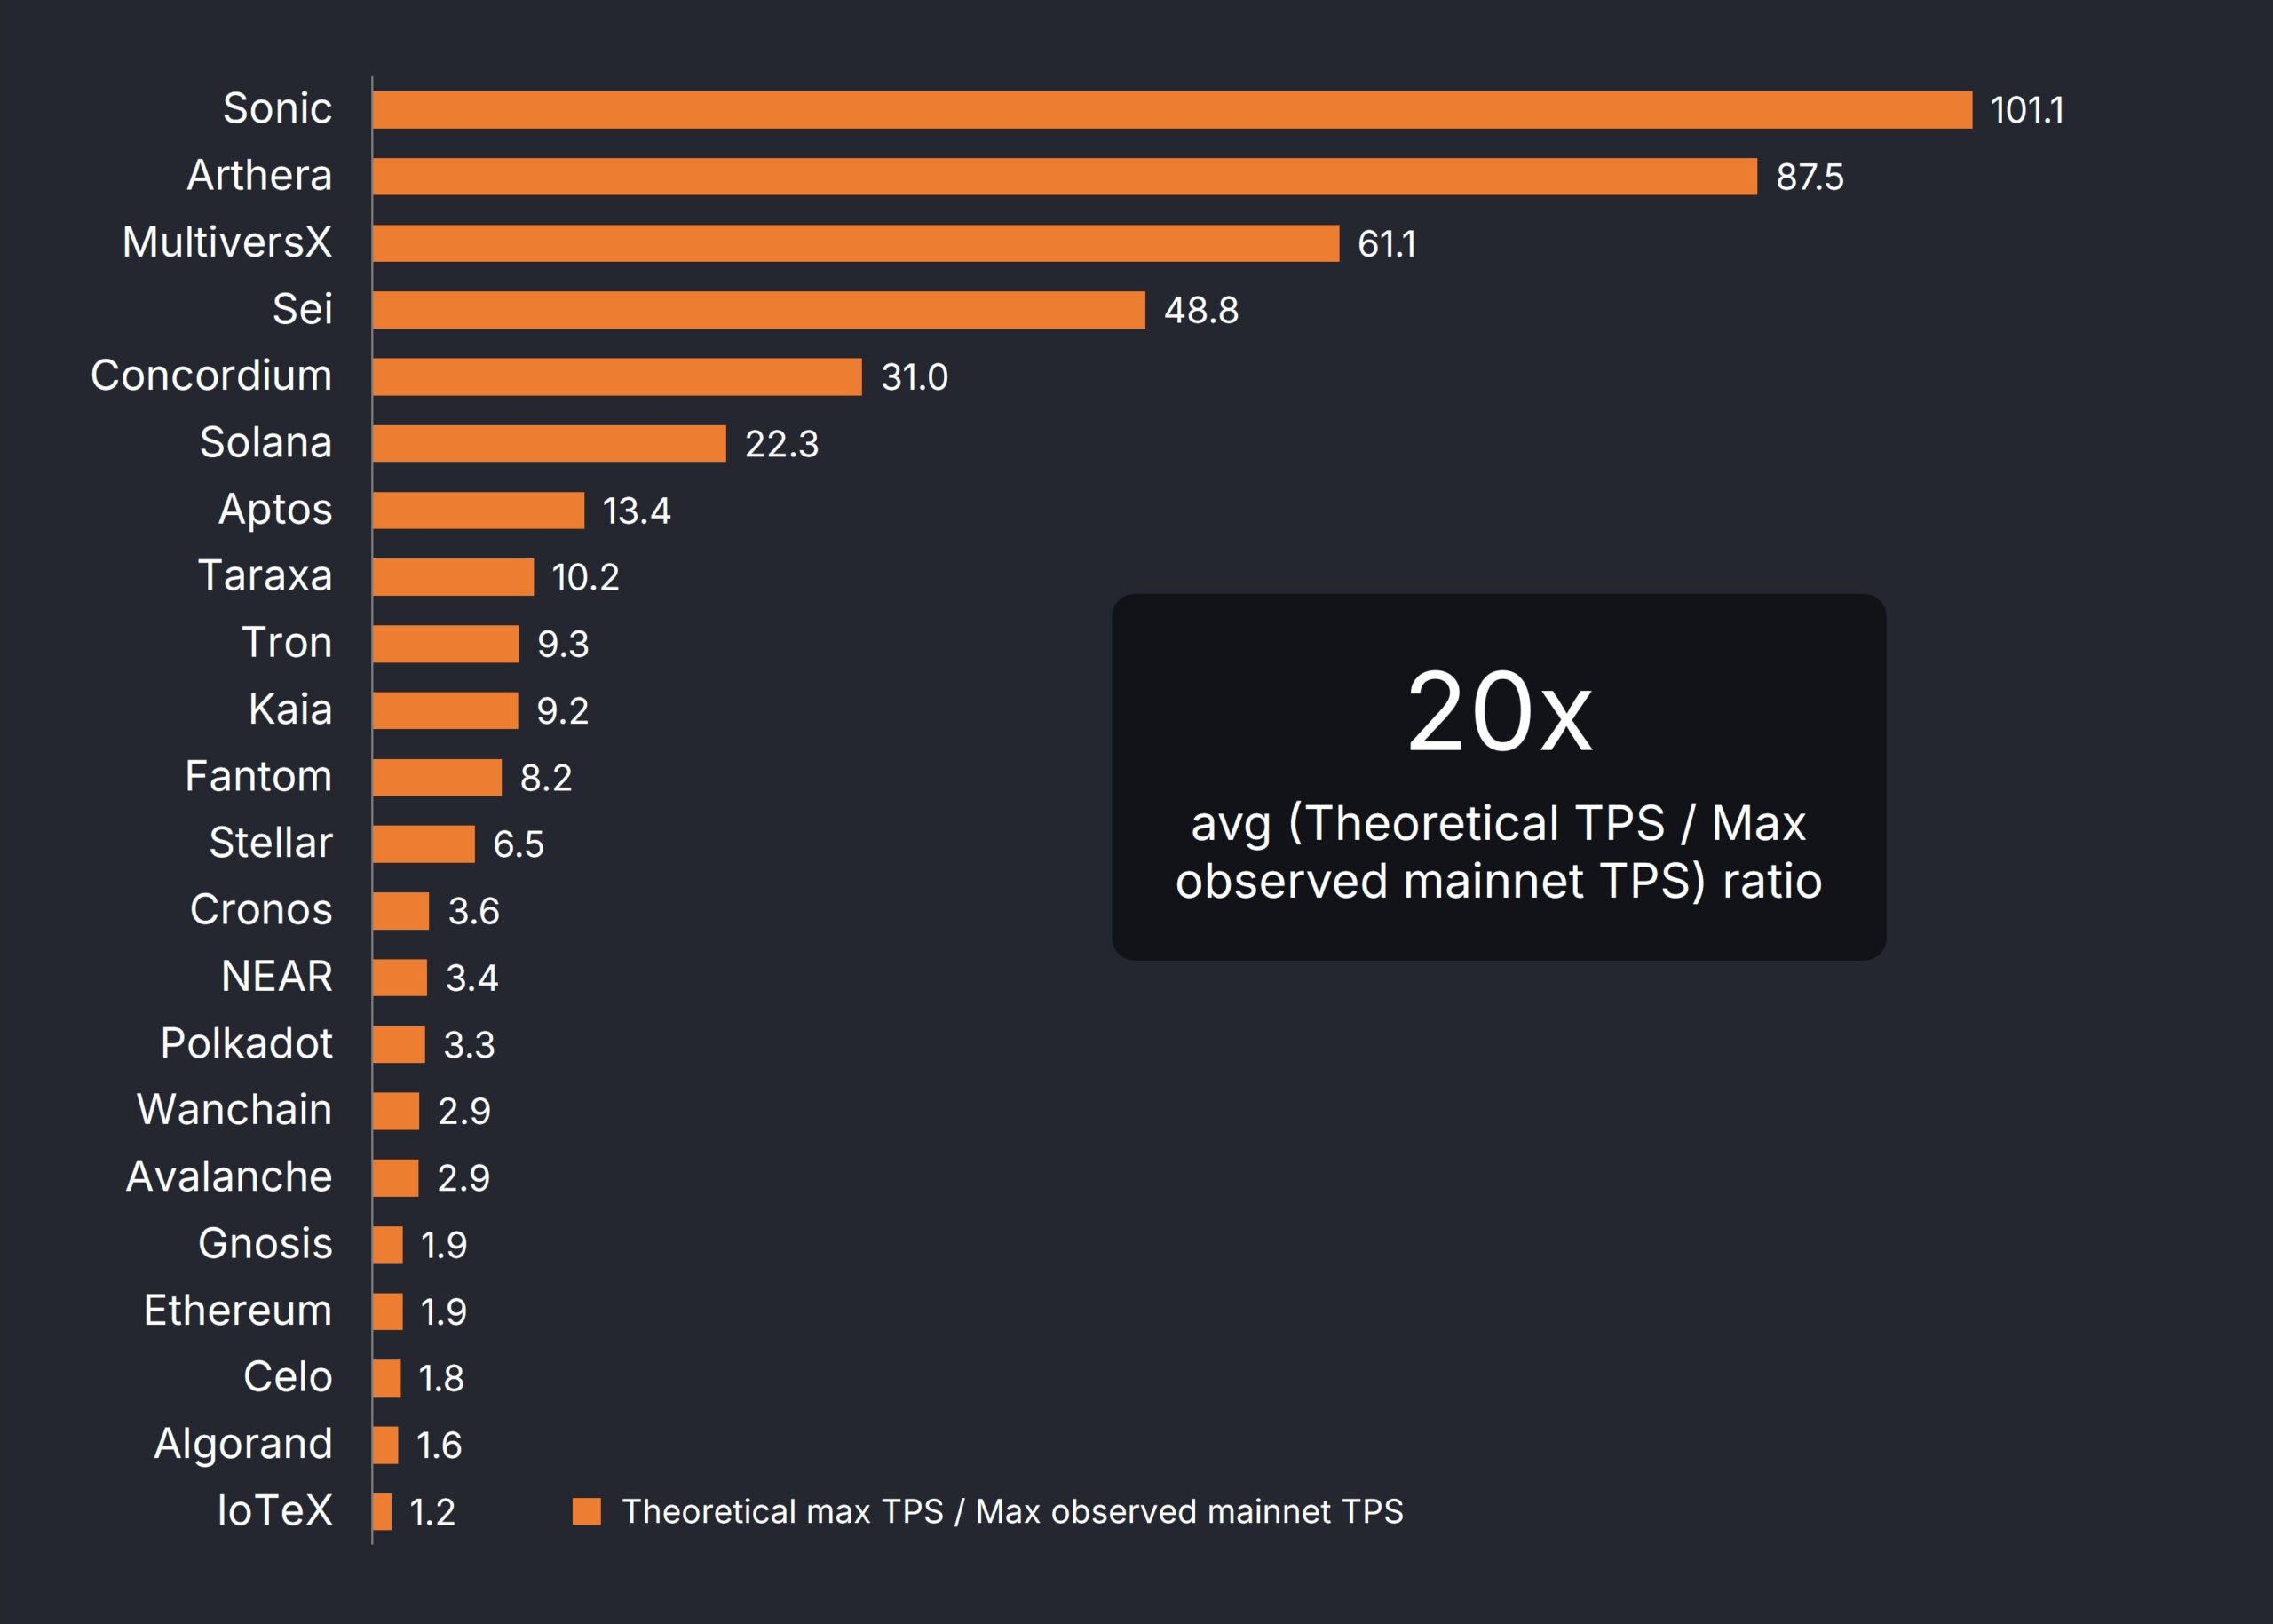
Pu sought to prove his point by determining the difference between the maximum historical TPS realized on a blockchain’s mainnet and the maximum theoretical TPS.
Of the 22 permissionless and single-shard networks observed, Pu found that, on average, there was a 20-fold gap between theory and reality. In other words, the theoretical metric was 20 times higher than the maximum observed mainnet TPS.
Taraxa Co-founder finds 20x difference between the Theoretical TPS and the Max Observed Mainnet TPS. Source: Taraxa.
“Metric overestimations (such as in the case of TPS) are a response to the highly speculative and narrative-driven crypto market. Everyone wants to position their project and technologies in the best possible light, so they come up with theoretical estimates, or conduct tests with wildly unrealistic assumptions, to arrive at inflated metrics. It’s dishonest advertising. Nothing more, nothing less,” Pu told BeInCrypto.
Looking to counter these exaggerated metrics, Pu developed his own performance measure.
Introducing TPS/$: A More Balanced Metric?
Pu and his team developed the following: TPS realized on mainnet / monthly $ cost of a single validator node, or TPS/$ for short, to fulfill the need for better performance metrics.
This metric assesses performance based on verifiable TPS achieved on a network’s live mainnet while also considering hardware efficiency.
The significant 20-fold gap between theoretical and actual throughput convinced Pu to exclude metrics based solely on assumptions or lab conditions. He also aimed to illustrate how some blockchain projects inflate performance metrics by relying on costly infrastructure.
“Published network performance claims are often inflated by extremely expensive hardware. This is especially true for networks with highly centralized consensus mechanisms, where the throughput bottleneck shifts away from networking latency and into single-machine hardware performance. Requiring extremely expensive hardware for validators not only betrays a centralized consensus algorithm and inefficient engineering, it also prevents the vast majority of the world from potentially participating in consensus by pricing them out,” Pu explained.
Pu’s team located each network’s minimum validator hardware requirements to determine the cost per validator node. They later estimated their monthly cost, paying particular attention to their relative sizing when used to compute the TPS per dollar ratios.
“So the TPS/$ metric tries to correct two of the perhaps most egregious categories of misinformation, by forcing the TPS performance to be on mainnet, and revealing the inherent tradeoffs of extremely expensive hardware,” Pu added.
Pu stressed considering two simple, identifiable characteristics: whether a network is permissionless and single-sharded.
Permissioned vs. Permissionless Networks: Which Fosters Decentralization?
A blockchain’s degree of security can be unveiled by whether it operates under a permissioned or permissionless network.
Permissioned blockchains refer to closed networks where access and participation are restricted to a predefined group of users, requiring permission from a central authority or trusted group to join. In permissionless blockchains, anyone is allowed to participate.
According to Pu, the former model is at odds with the philosophy of decentralization.
“A permissioned network, where network validation membership is controlled by a single entity, or if there is just a single entity (every Layer-2s), is another excellent metric. This tells you whether or not the network is indeed decentralized. A hallmark of decentralization is its ability to bridge trust gaps. Take decentralization away, then the network is nothing more than a cloud service,” Pu told BeInCrypto.
Attention to these metrics will prove vital over time, as networks with centralized authorities tend to be more vulnerable to certain weaknesses.
“In the long term, what we really need is a battery of standardized attack vectors for L1 infrastructure that can help to reveal weaknesses and tradeoffs for any given architectural design. Much of the problems in today’s mainstream L1 are that they make unreasonable sacrifices in security and decentralization. These characteristics are invisible and extremely hard to observe, until a disaster strikes. My hope is that as the industry matures, such a battery of tests will begin to organically emerge into an industry-wide standard,” Pu added.
Meanwhile, understanding whether a network employs state-sharding versus maintaining a single, sharded state reveals how unified its data management is.
State-Sharding vs. Single-State: Understanding Data Unity
In blockchain performance, latency refers to the time delay between submitting a transaction to the network, confirming it, and including it in a block on the blockchain. It measures how long it takes for a transaction to be processed and become a permanent part of the distributed ledger.
Identifying whether a network employs state-sharding or a single-sharded state can reveal much about its latency efficiency.
State-sharded networks divide the blockchain’s data into multiple independent parts called shards. Each shard operates somewhat independently and doesn’t have direct, real-time access to the complete state of the entire network.
By contrast, a non-state-sharded network has a single, shared state across the entire network. All nodes can access and process the same complete data set in this case.
Pu noted that state-sharded networks aim to increase storage and transaction capacity. However, they often face longer finality latencies due to a need to process transactions across multiple independent shards.
He added that many projects adopting a sharding approach inflate throughput by simply replicating their network rather than building a truly integrated and scalable architecture.
“A state-sharded network that doesn’t share state, is simply making unconnected copies of a network. If I take a L1 network and just make 1000 copies of it running independently, it’s clearly dishonest to claim that I can add up all the throughput across the copies together and represent it as a single network. There are architectures that actually synchronize the states as well as shuffle the validators across shards, but more often than not, projects making outlandish claims on throughput are just making independent copies,” Pu said.
Based on his research into the efficiency of blockchain metrics, Pu highlighted the need for fundamental shifts in how projects are evaluated, funded, and ultimately succeed.
What Fundamental Shifts Does Blockchain Evaluation Need?
Pu’s insights present a notable alternative in a Layer-1 blockchain space where misleading performance metrics increasingly compete for attention. Reliable and effective benchmarks are essential to counter these false representations.
“You only know what you can measure, and right now in crypto, the numbers look more like hype-narratives than objective measurements. Having standardized, transparent measurements allows simple comparisons across product options so developers and users understand what it is they’re using, and what tradeoffs they’re making. This is a hallmark of any mature industry, and we still have a long way to go in crypto,” Pu concluded.
Adopting standardized and transparent benchmarks will foster informed decision-making and drive genuine progress beyond merely promotional claims as the industry matures.
Bitcoin’s decisive break above the psychological $95,000 barrier has reignited bullish momentum across the crypto market. As market sentiment becomes increasingly positive, crypto whales are buying several differentiating altcoins this week.
Among the top picks are Avalanche (AVAX), Ethereum (ETH), and meme-coin Pepe (PEPE), all of which have seen significant whale inflows this week.
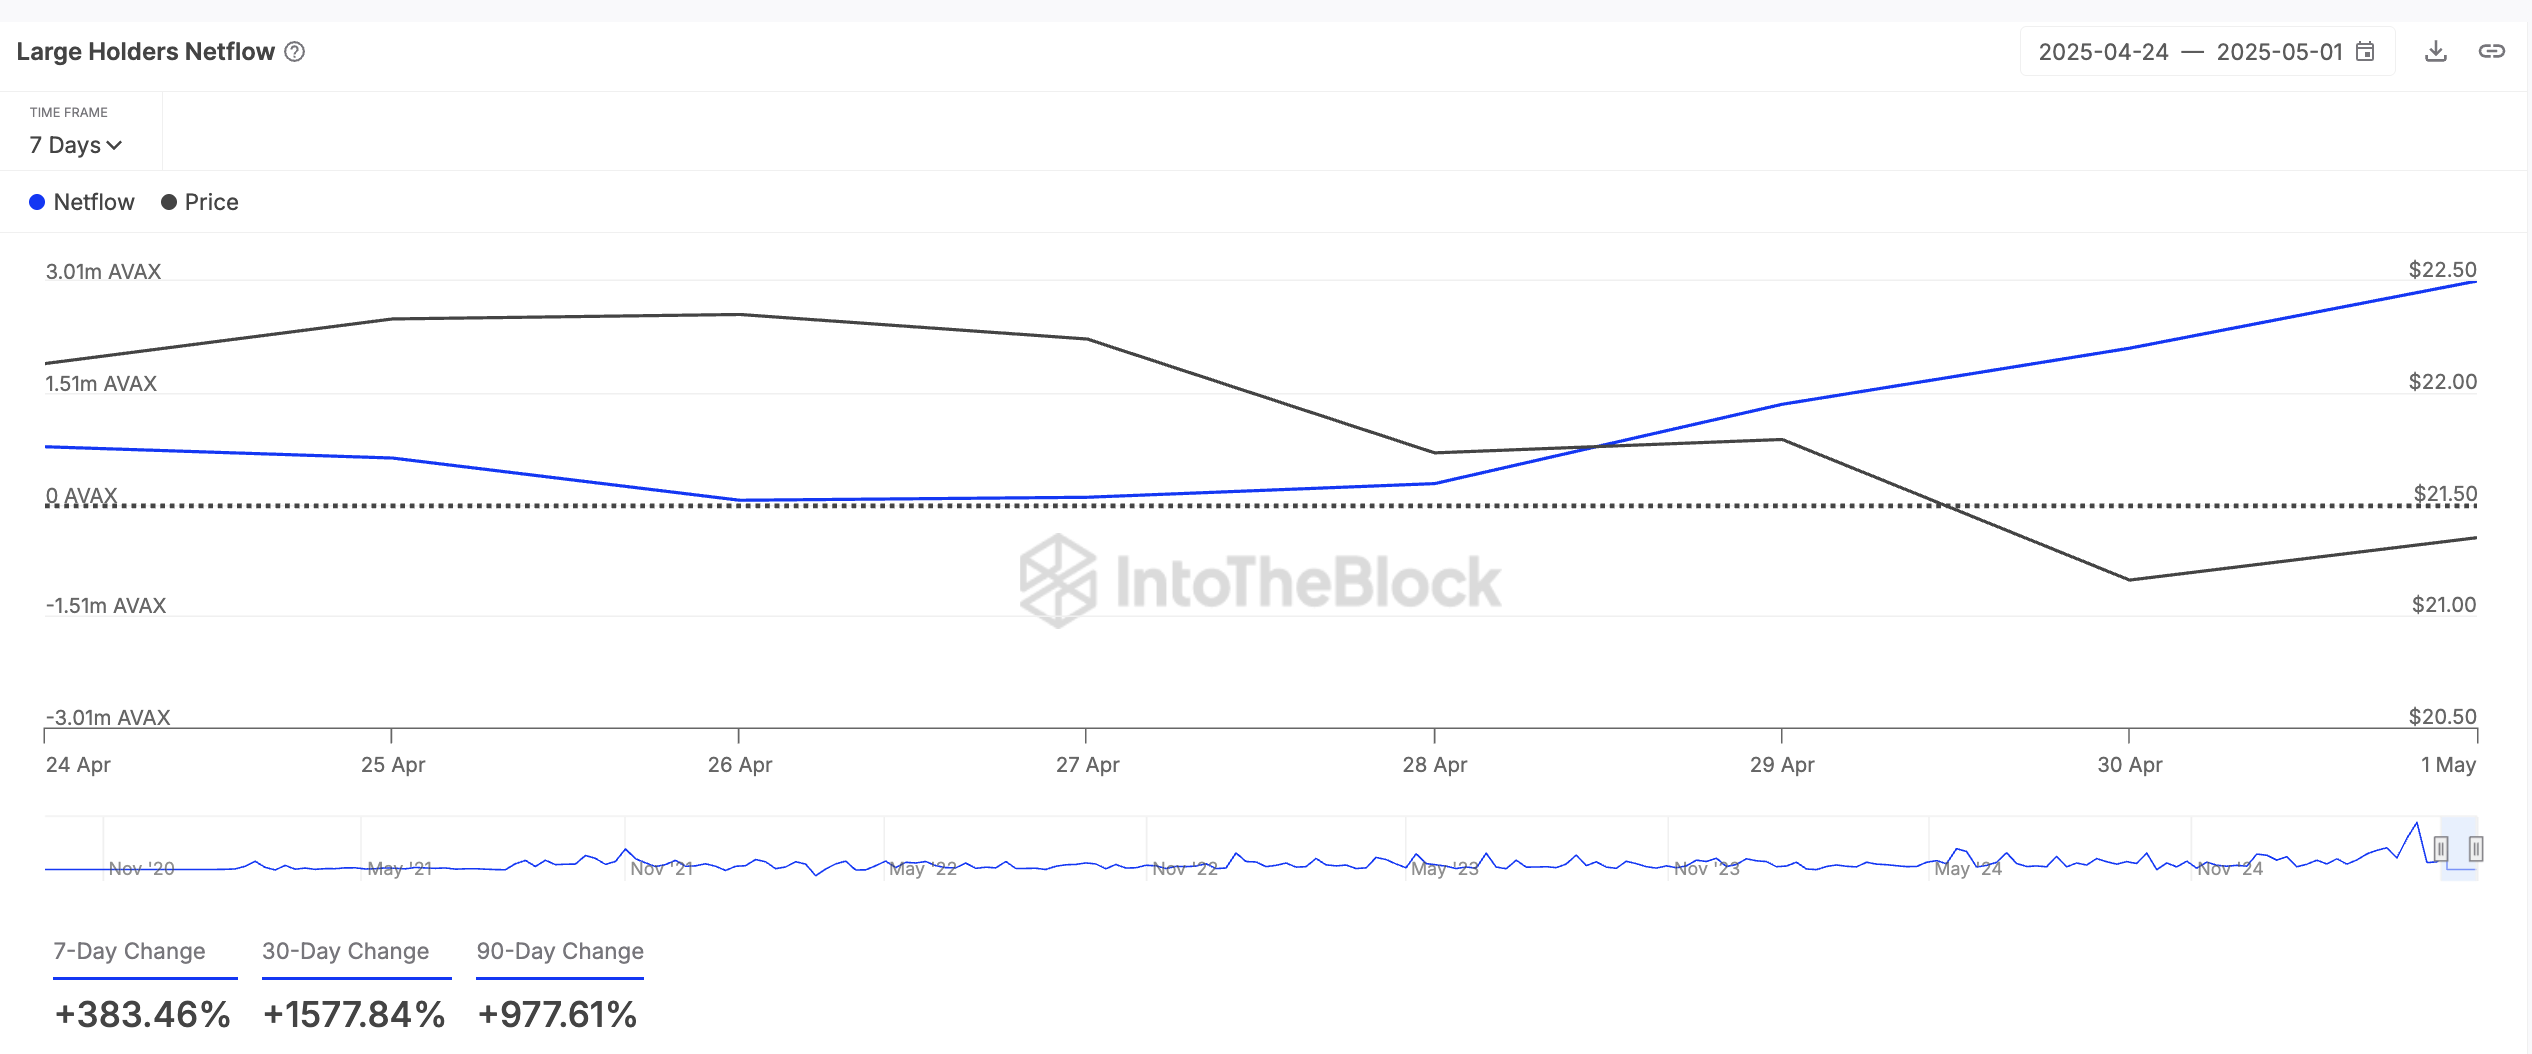
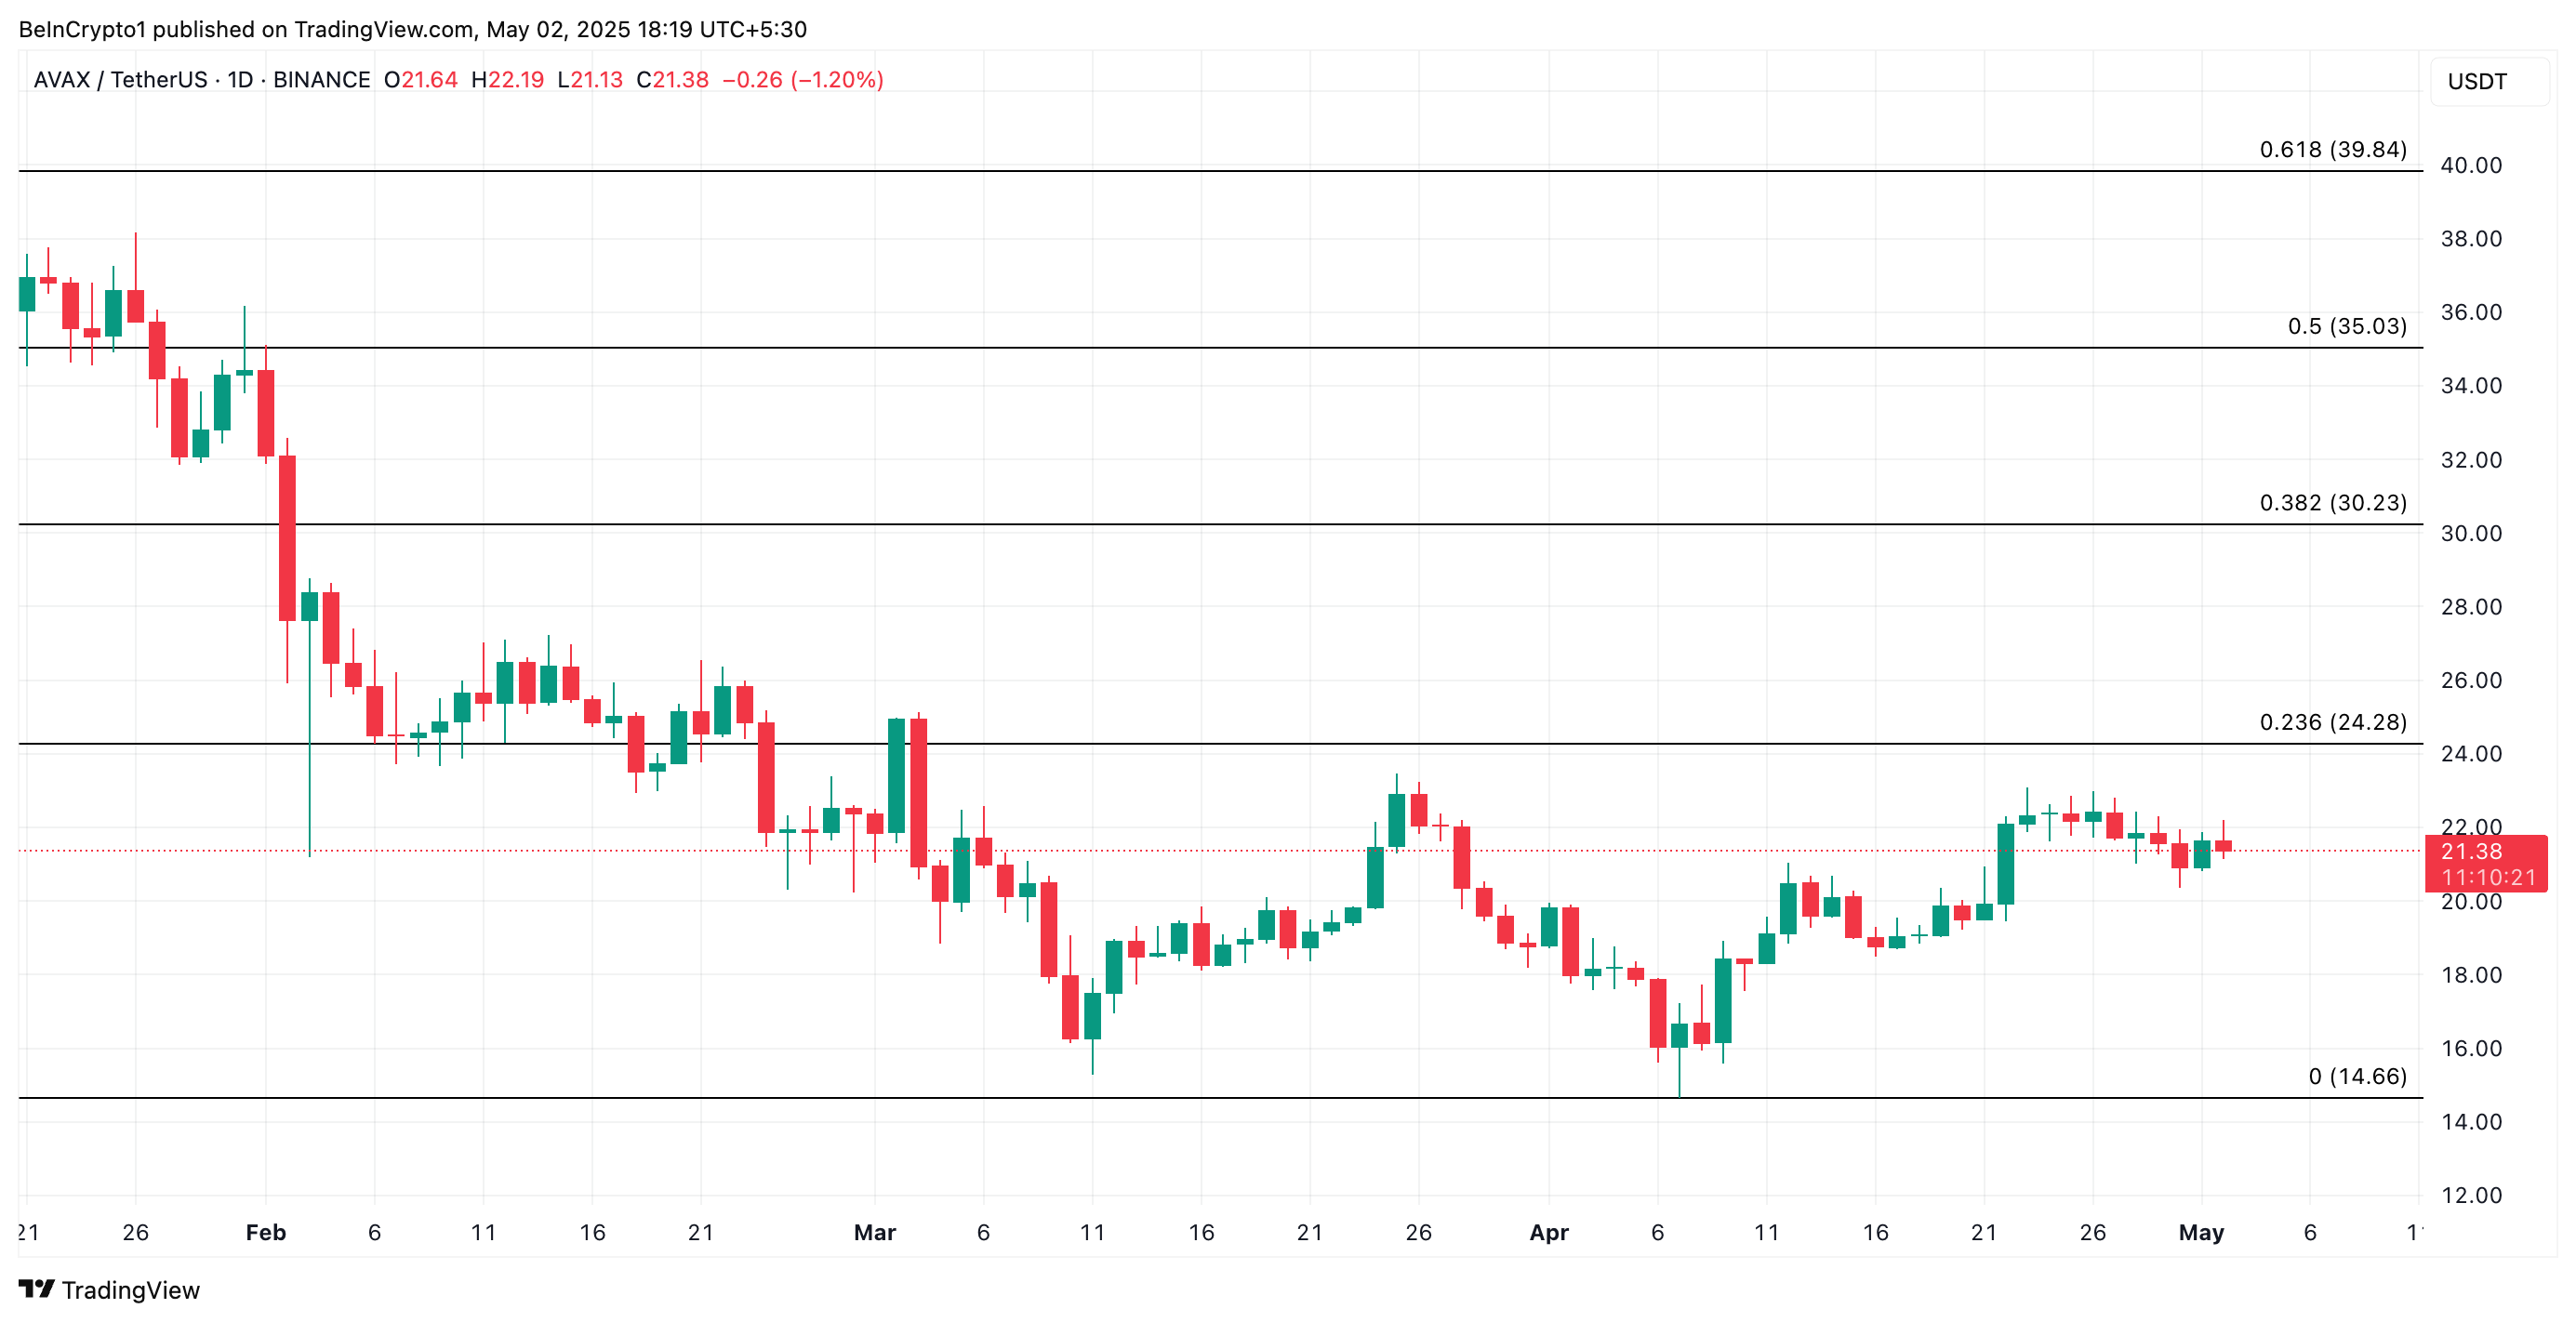
Avalanche (AVAX)
Layer-1 (L1) coin AVAX has seen increased whale attention this week, reflected by the spike in its large holders’ netflow. According to IntoTheBlock, this has rocketed over 380% in the past seven days.
A large holder is a wallet address holding over 0.1% of an asset’s circulating supply. The large holders’ netflow tracks these investors’ buying and selling activity.
When it rises, crypto whales buy more tokens. This bullish signal often prompts retail investors to increase their holdings.
If AVAX’s accumulation trend persists, its price could breach the resistance at $24.28 and rally toward $30.23.
Conversely, if demand wanes, AVAX could fall to $14.66.
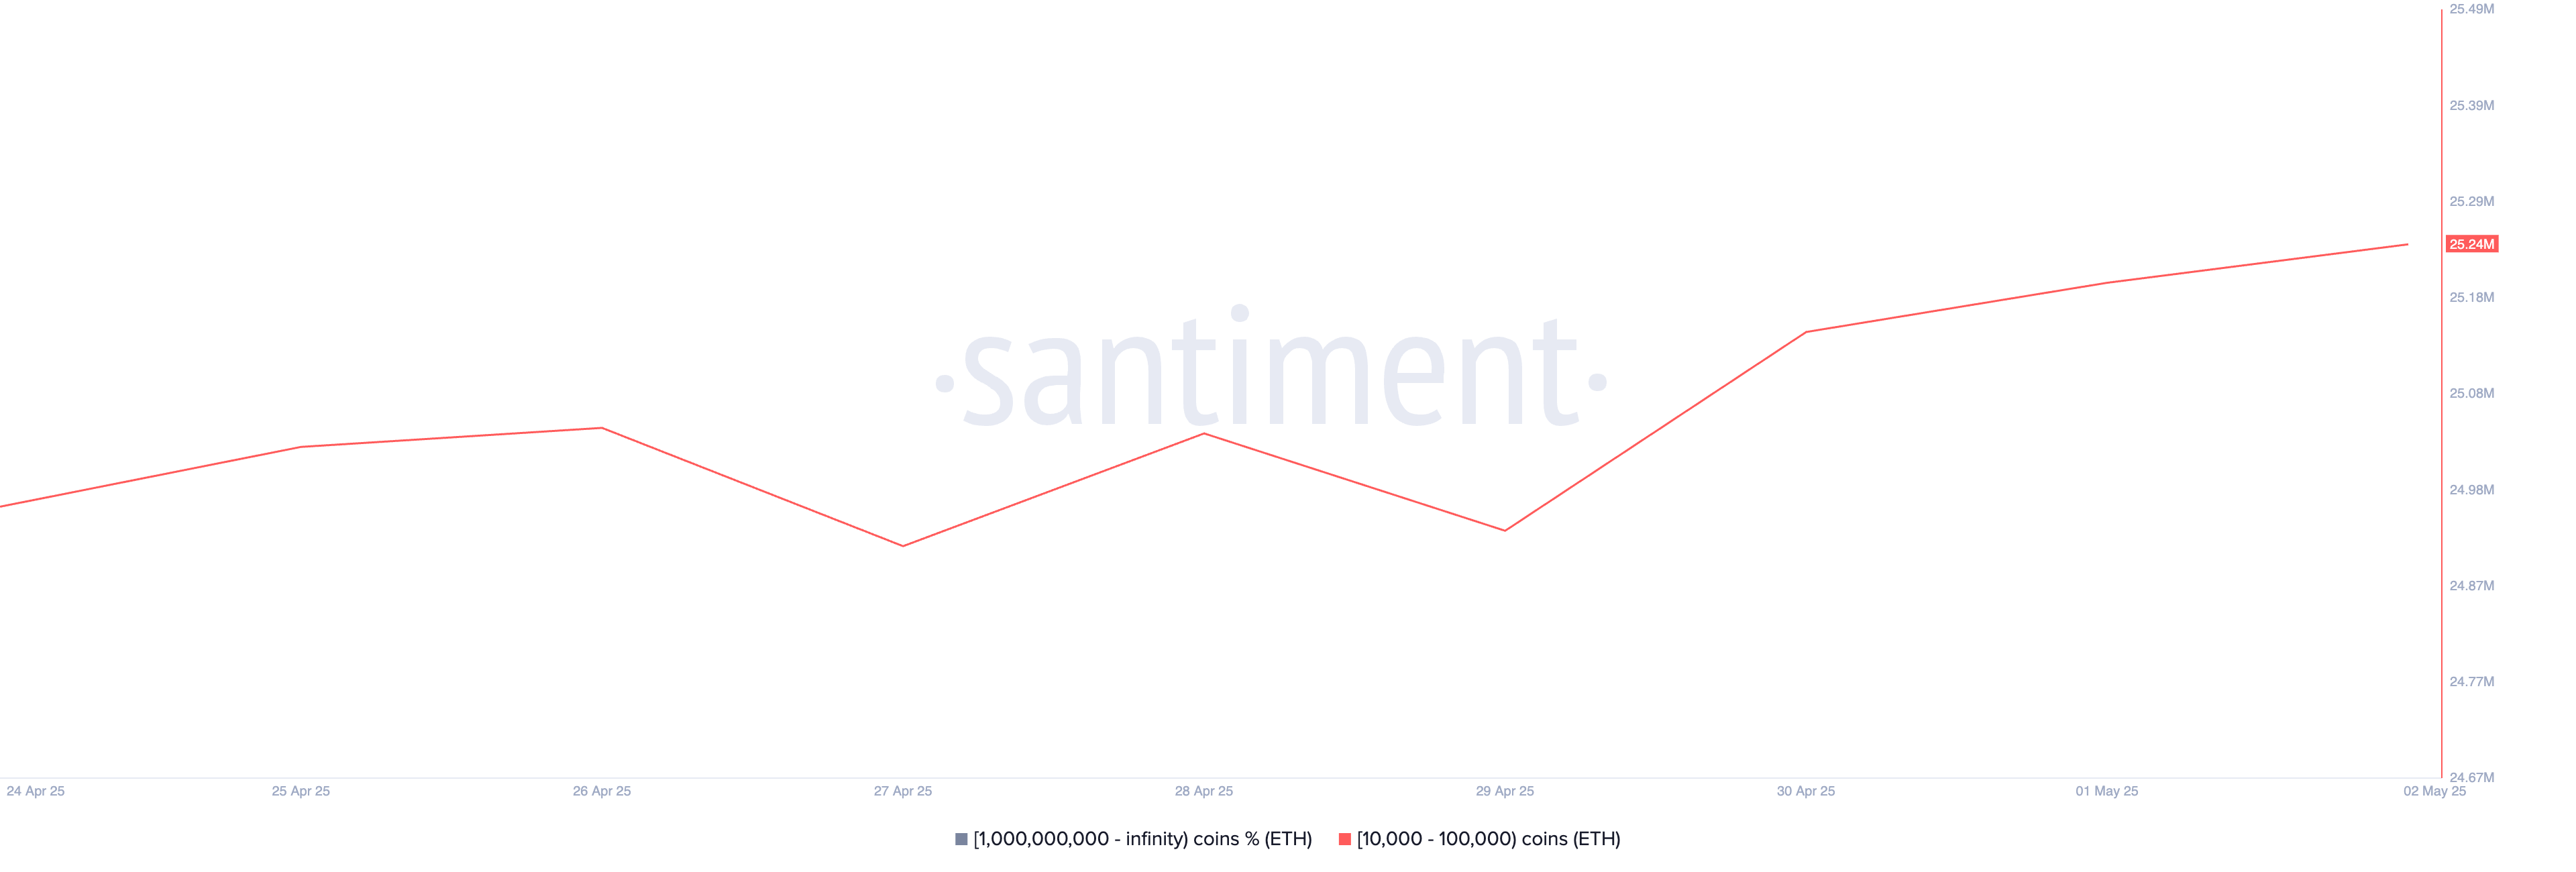
Ethereum (ETH)
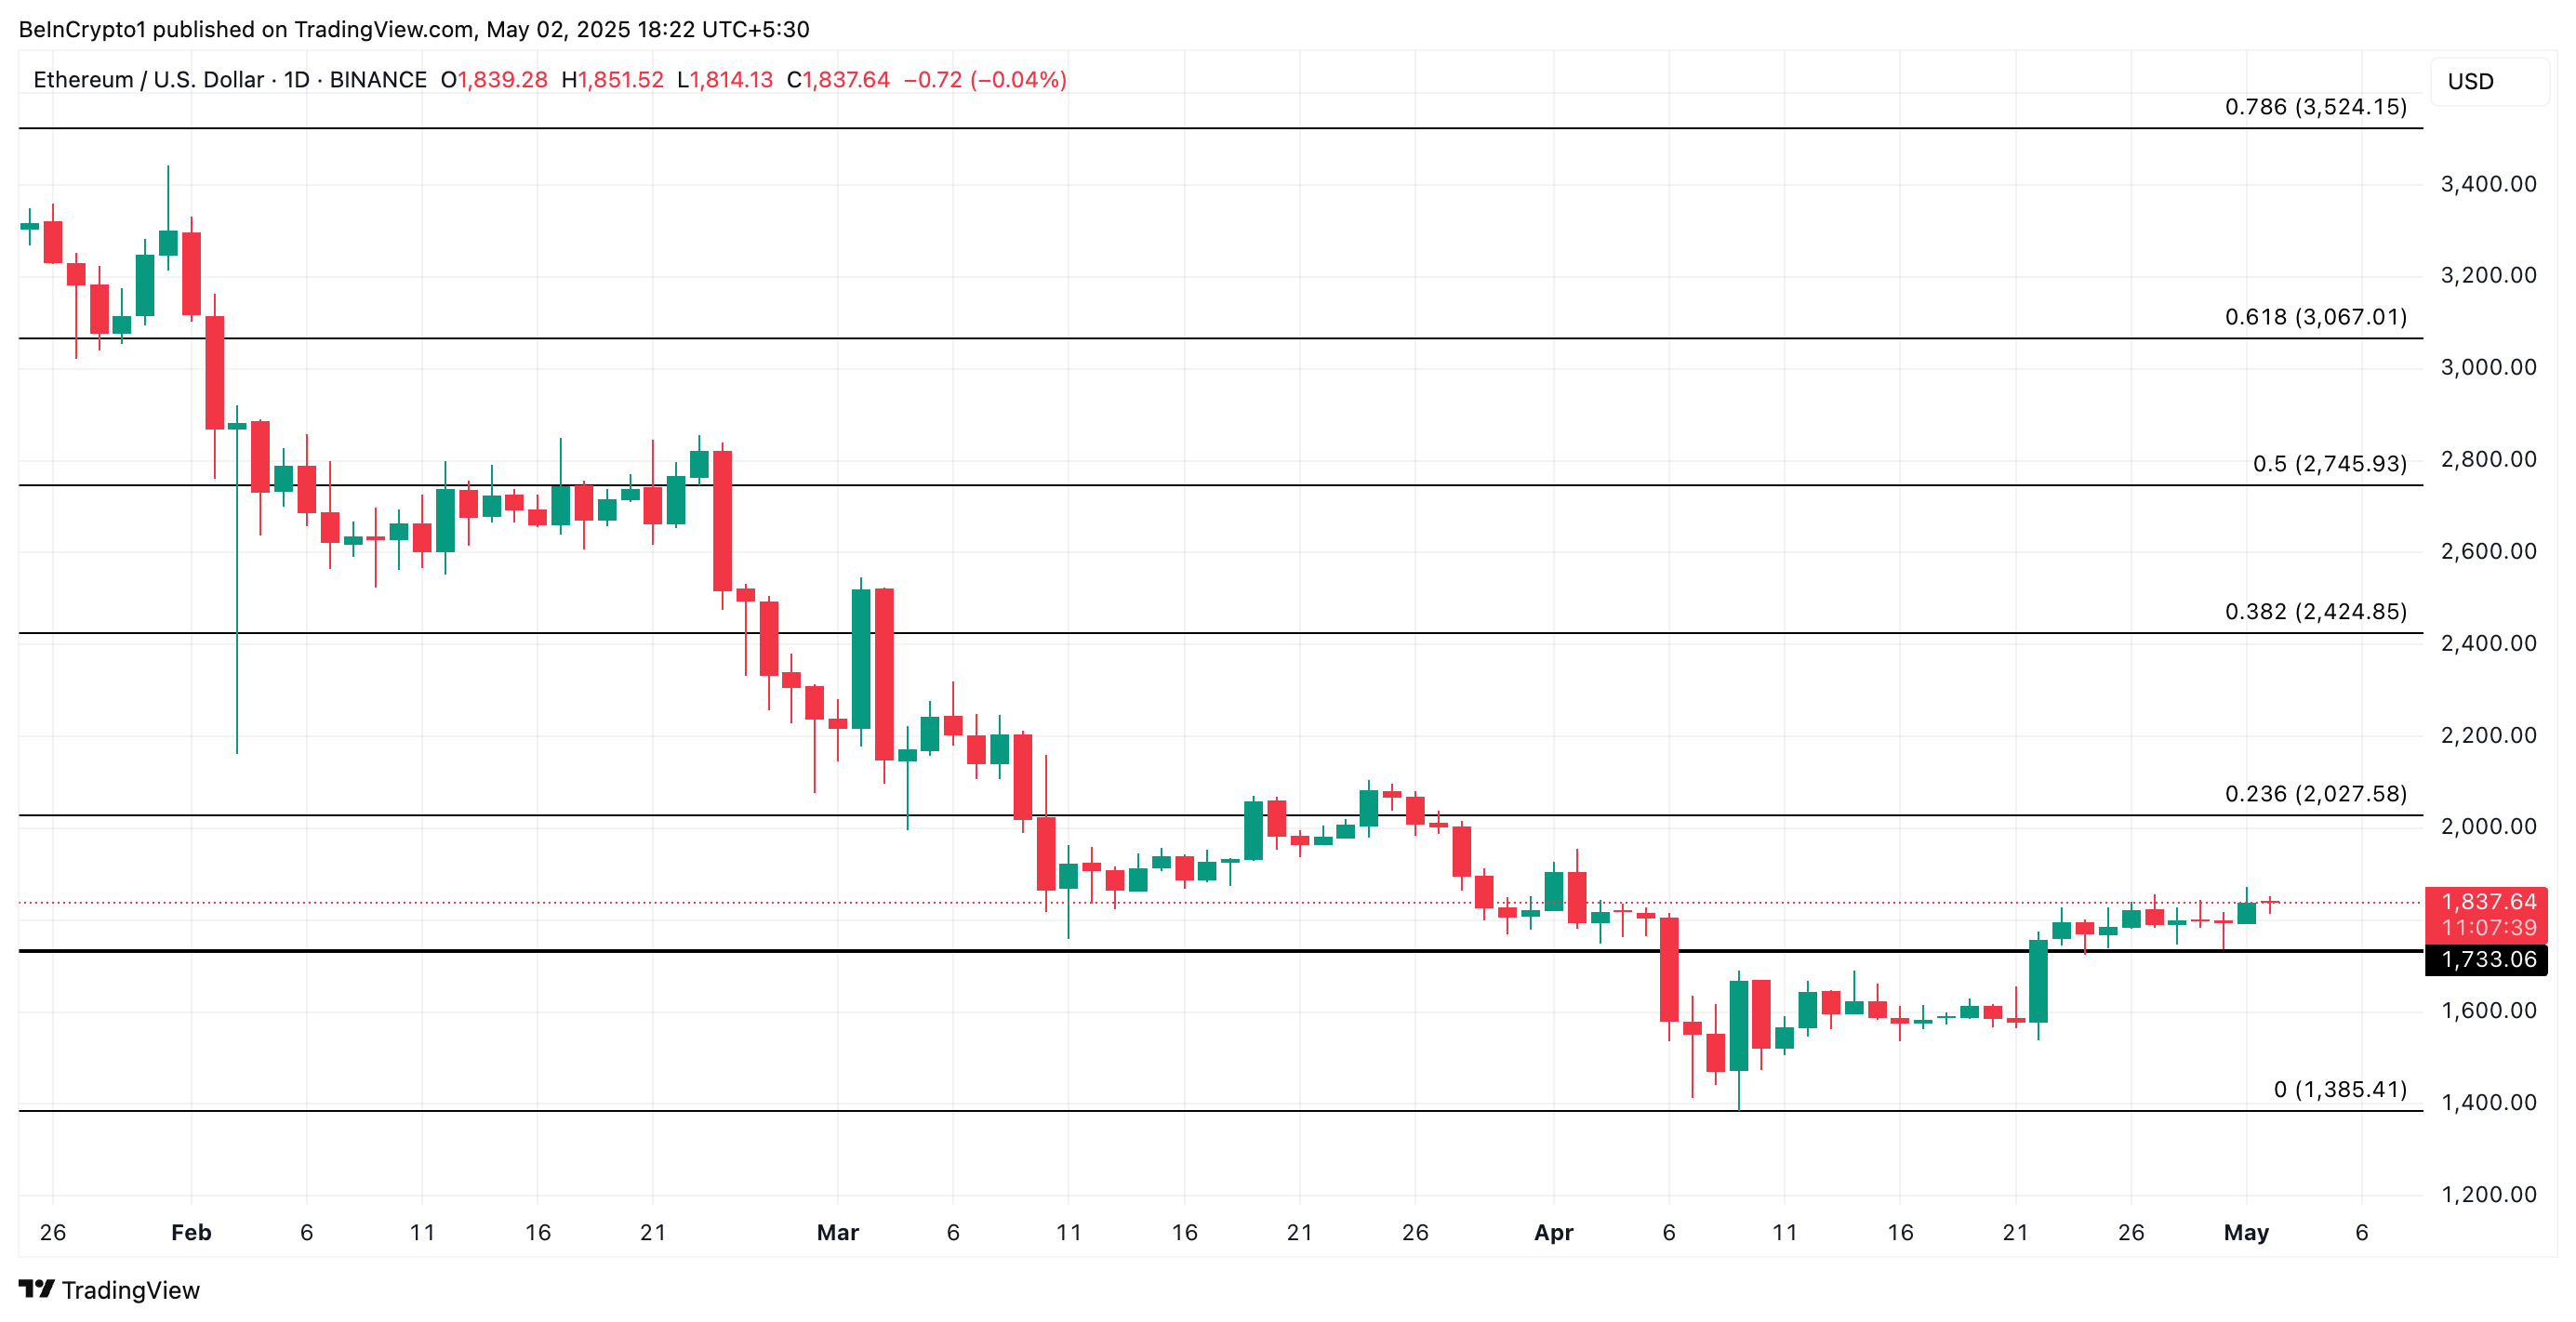
Amid the recent broader market rally, ETH has recorded a modest 3% price uptick in the past seven days, buoyed by steady whale accumulation.
According to Santiment, during that period, whale addresses holding between 10,000 and 100,000 coins have acquired 280,000 ETH valued at over $510 million at current market prices.
As of this writing, this cohort of ETH whales controls 25.24 million ETH, their highest holding in the past month. ETH’s price could be driven above the psychological $2,000 mark if whale accumulation persists.
However, if the bears regain dominance, they could push the coin’s price to $1,733.
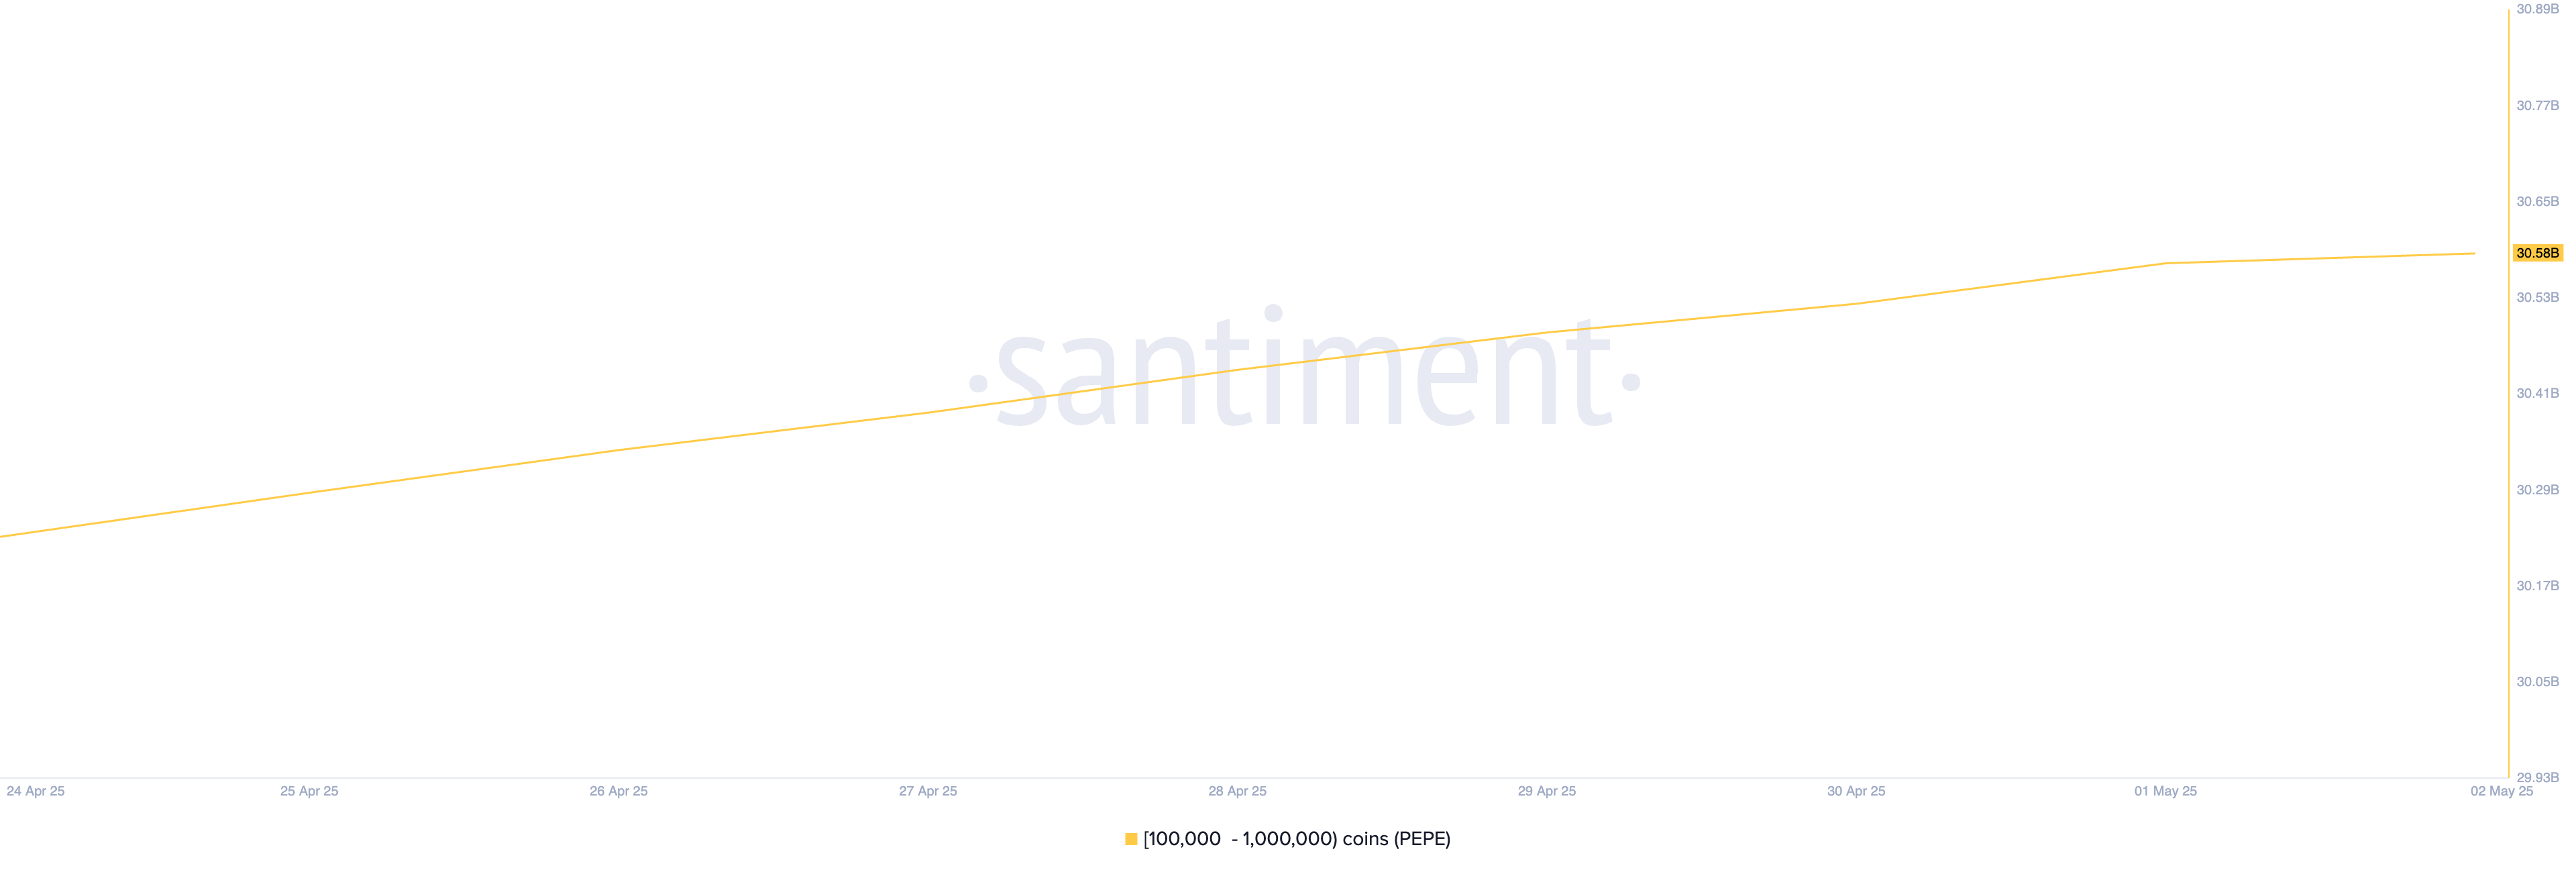
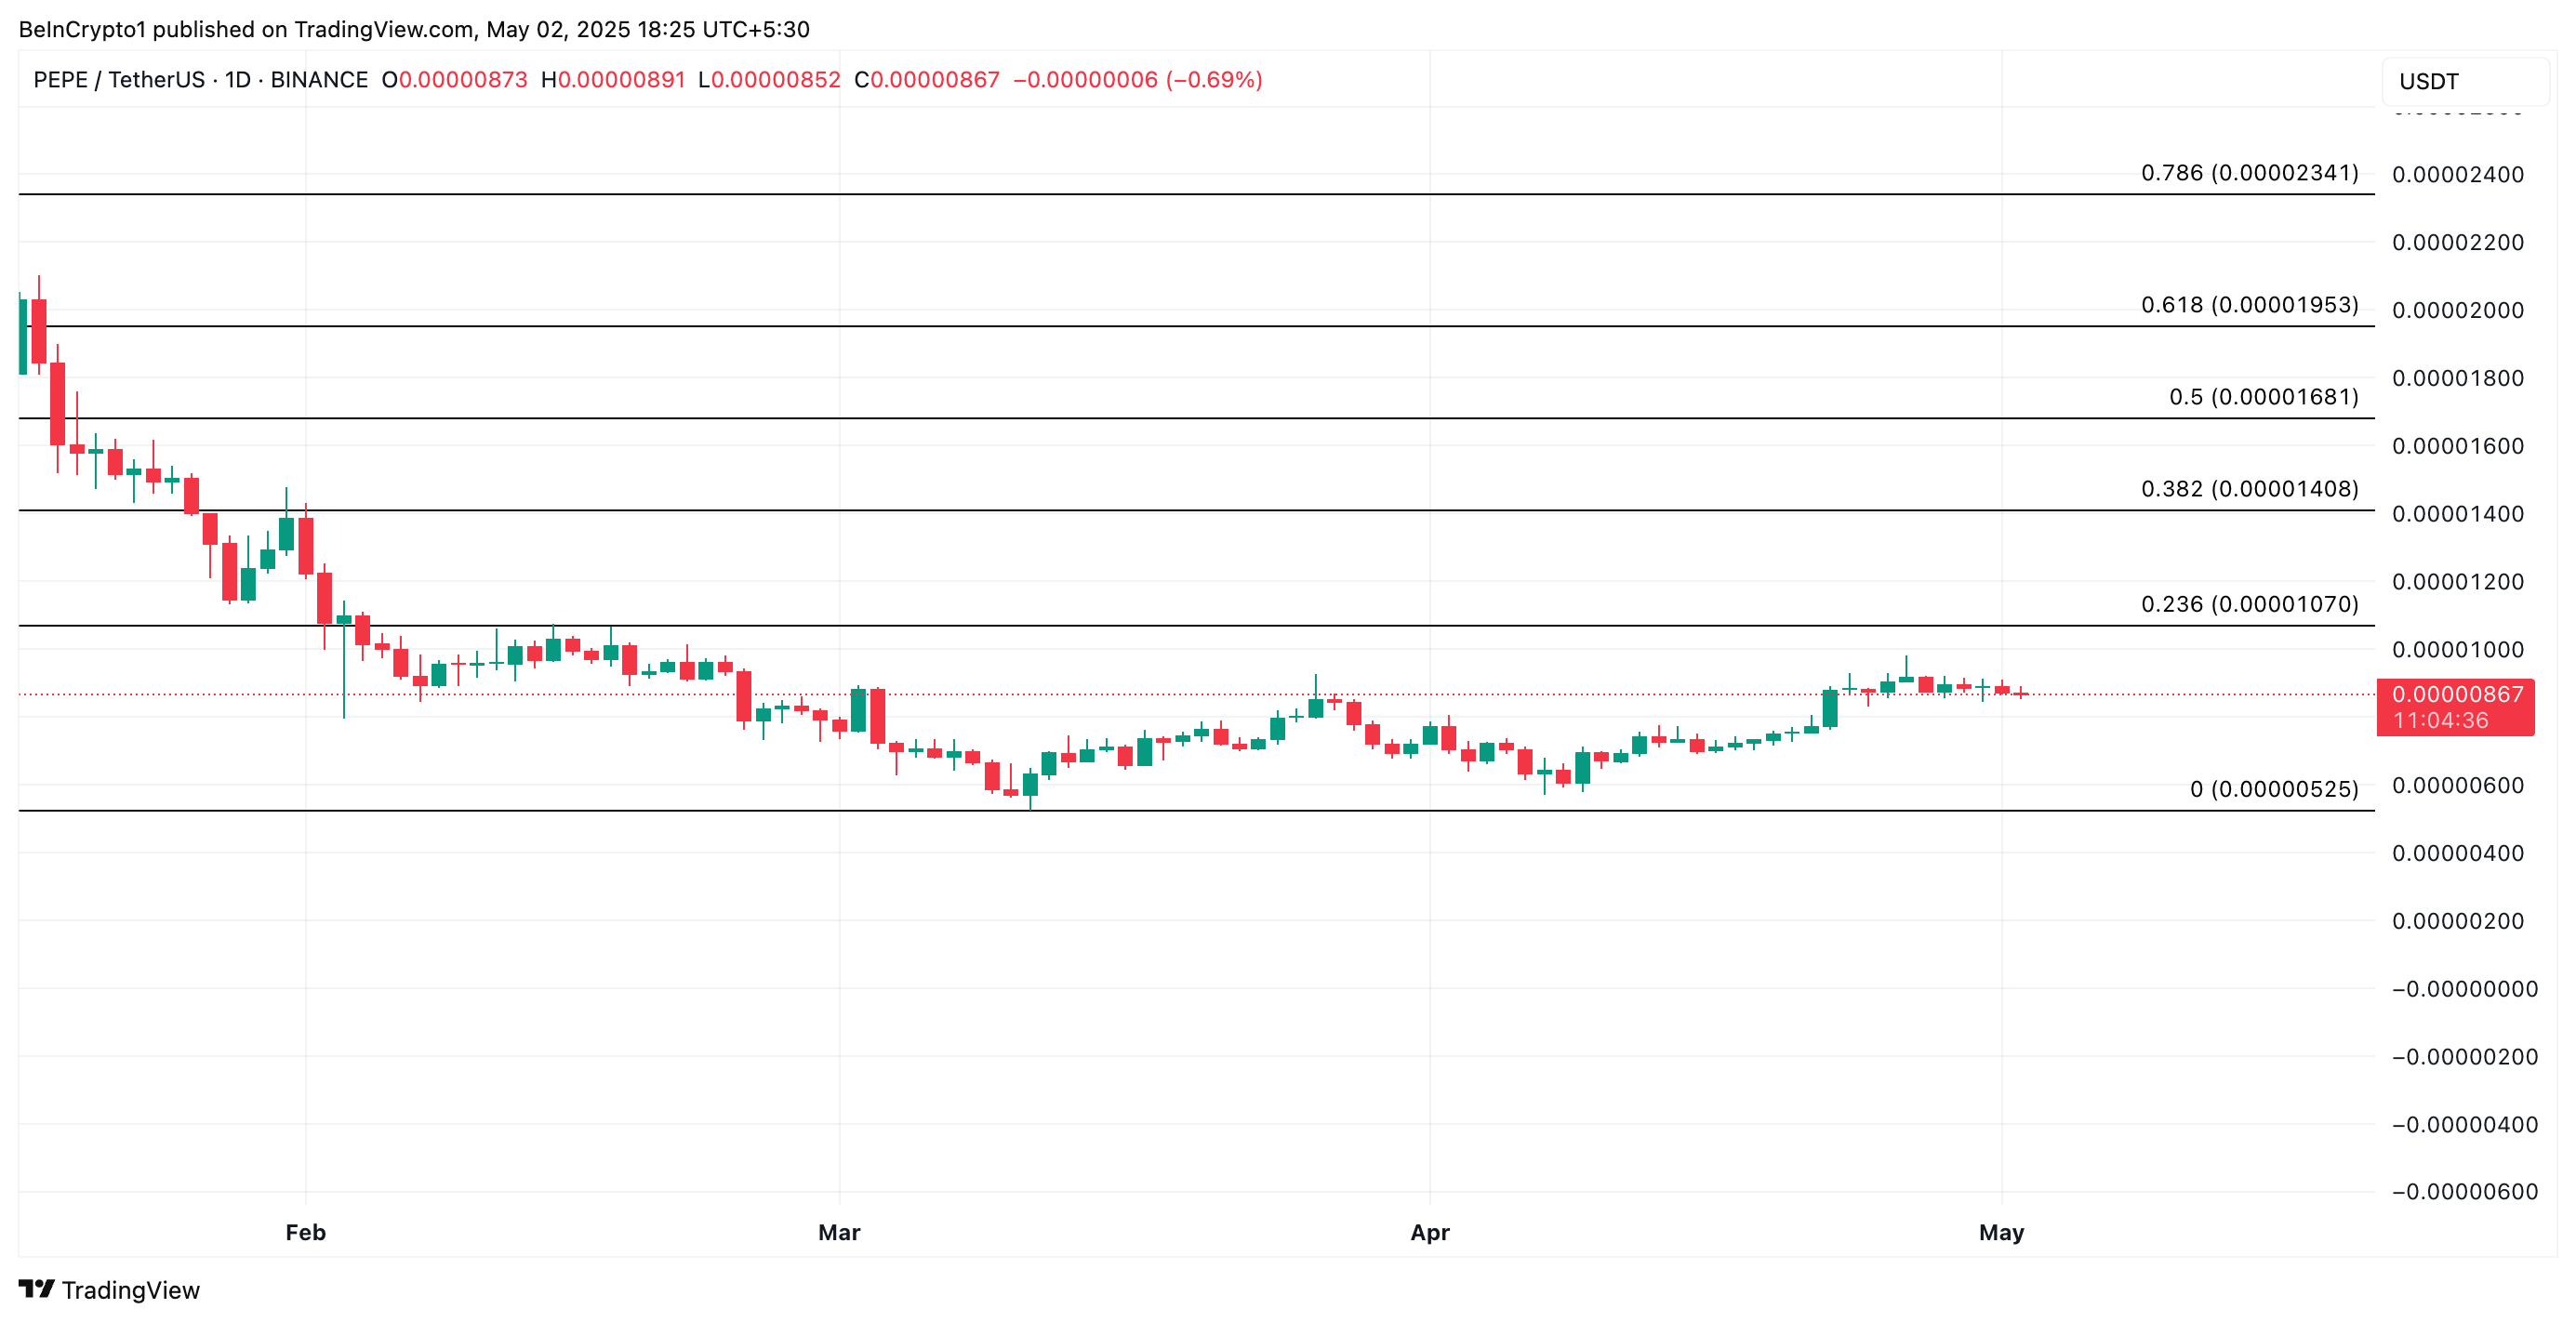
Pepe (PEPE)
Popular meme coin PEPE is another asset that has seen a surge in crypto whale accumulation this week. Per Santiment, wallet addresses that hold between 100,000 and 1 million tokens have bought 350 million PEPE in the past seven days.
At press time, the meme coin trades at $0.0000086. If whale accumulation persists, PEPE could reverse its current downtrend and break above the resistance at $0.0000010.
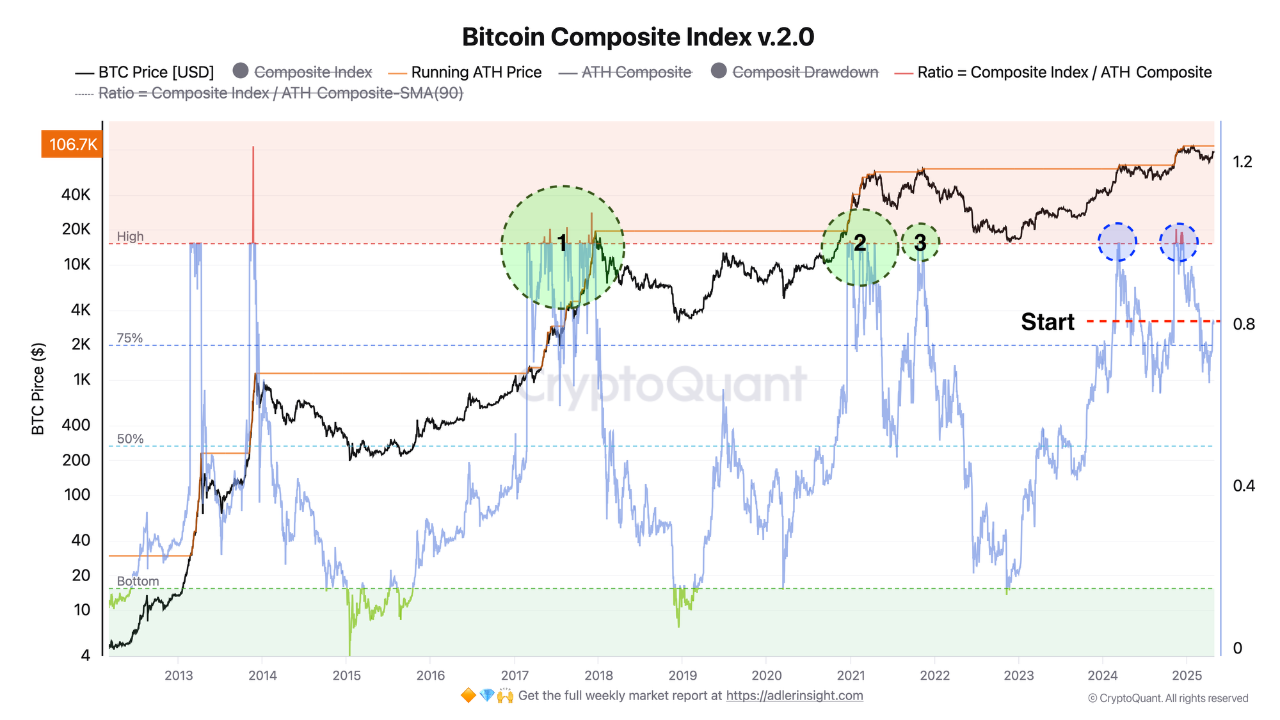
Bitcoin may face three potential trend scenarios in the future, with the most optimistic one forecasting a surge to $150,000 to $175,000 within the next 12 months.
This prediction is supported by factors such as a strong influx of institutional capital and positive investor sentiment following the Trump administration’s plans to establish a national Bitcoin reserve.
Positive Forecasts from Experts and Market Signals
The Bitcoin Composite Index currently stands at ≈ 0.8 (80%). Based on this indicator, AxelAdlerJr outlined three possible scenarios.
In the most optimistic scenario, BTC’s price could reach $150,000 to $175,000, following the cyclical logic of 2017 and 2021. This would occur if the Bitcoin Composite Index surpasses 1.0 and remains above that level.
If the ratio stays within the 0.8–1.0 range, the market would likely consolidate in a broad corridor between $90,000 and $110,000, indicating that participants are maintaining positions without increasing exposure.
Alternatively, if the ratio drops to 0.75 or below, short-term holders may start taking profits, potentially leading to a price correction to $70,000–$85,000. However, AxelAdlerJr notes that this scenario is less likely than the other two.
The return of YoY True MVRV to positive territory means that the average purchase price of all coins acquired over the past year is now below the current market price. The pressure from panic sellers is decreasing – many are now in profit and don’t need to lock in losses. Holder… pic.twitter.com/6AgvVVTn9h
On-chain signals further bolster the bullish outlook. According to Coinglass, over the past 7 days, approximately 42,525.89 Bitcoins were withdrawn from centralized exchanges (CEX), reducing the supply on exchanges to a 7-year low of about 2.48 million BTC.
The trend of Bitcoin withdrawals from exchanges is often seen as a positive sign, as it indicates investor accumulation and reduced selling pressure, paving the way for price growth.
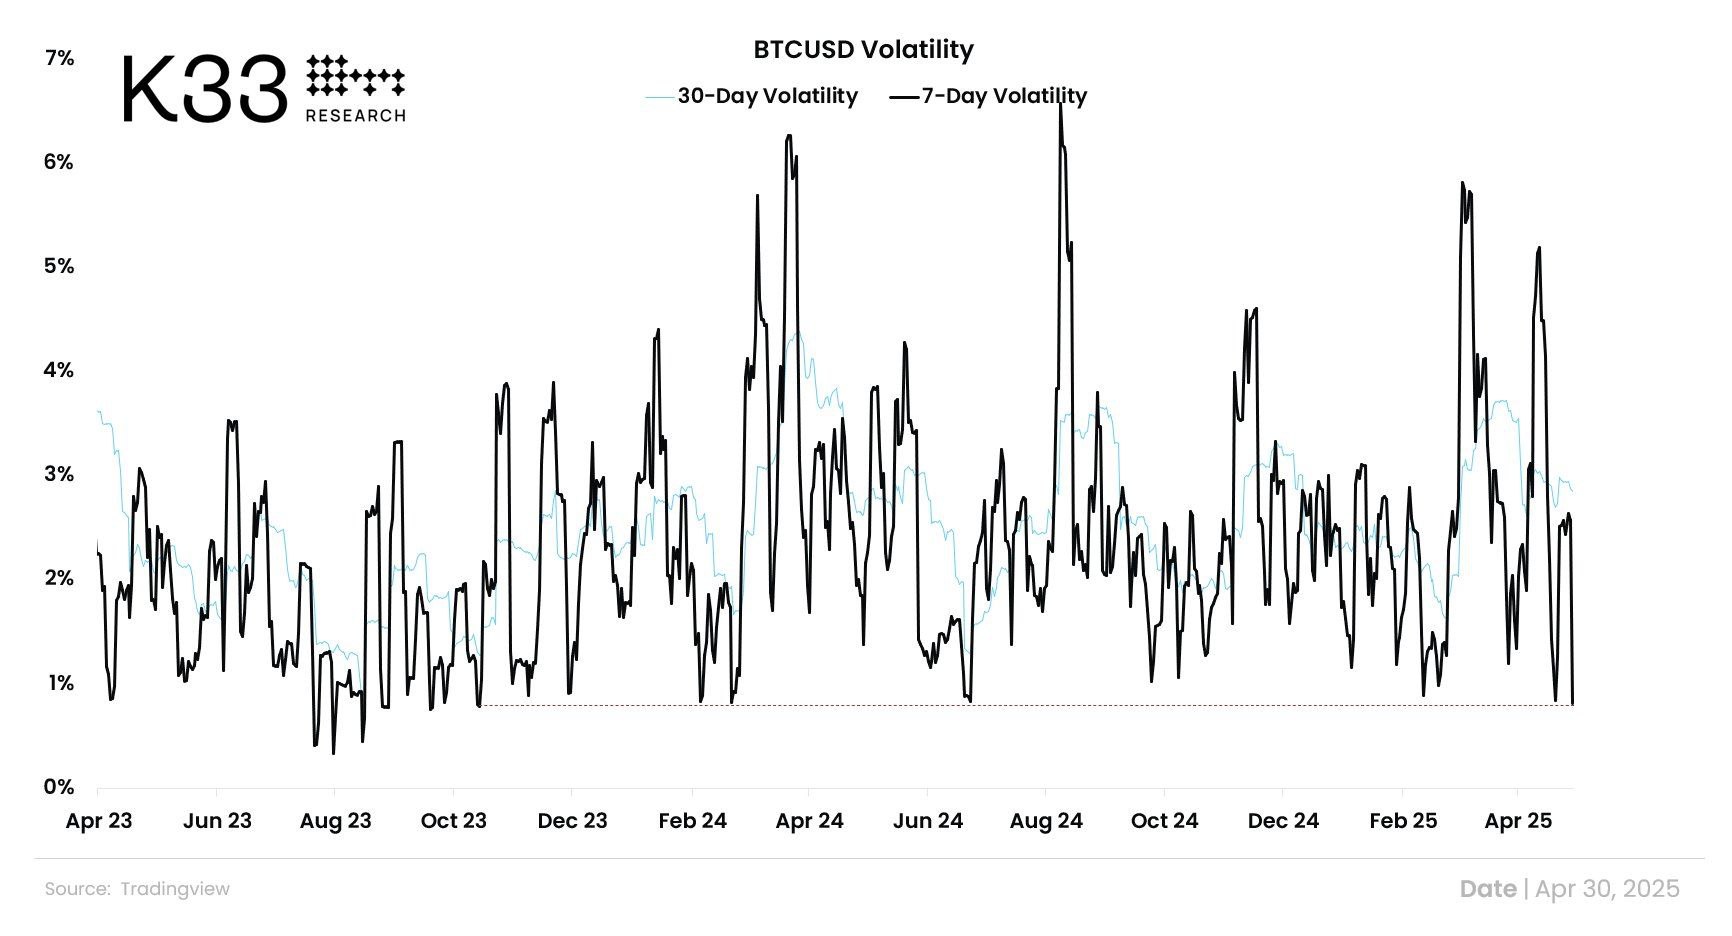
Bitcoin’s 7-day volatility has also hit its lowest level in 563 days. Low volatility typically signals a period of accumulation before a price breakout, as observed during past major rallies, such as in 2020 before Bitcoin peaked at $69,000.
Technical analysis also supports Bitcoin’s bullish scenario. According to a post on X by Ali, Bitcoin’s key support levels are at $93,198 and $83,444, indicating strong consolidation above these thresholds.
If Bitcoin sustains above $93,198, the likelihood of continuing its upward trend to reach the $150,000 target becomes highly feasible.
“The most critical support levels for #Bitcoin $BTC are $93,198 and $83,444. Key zones to watch if momentum shifts,” Ali shared.
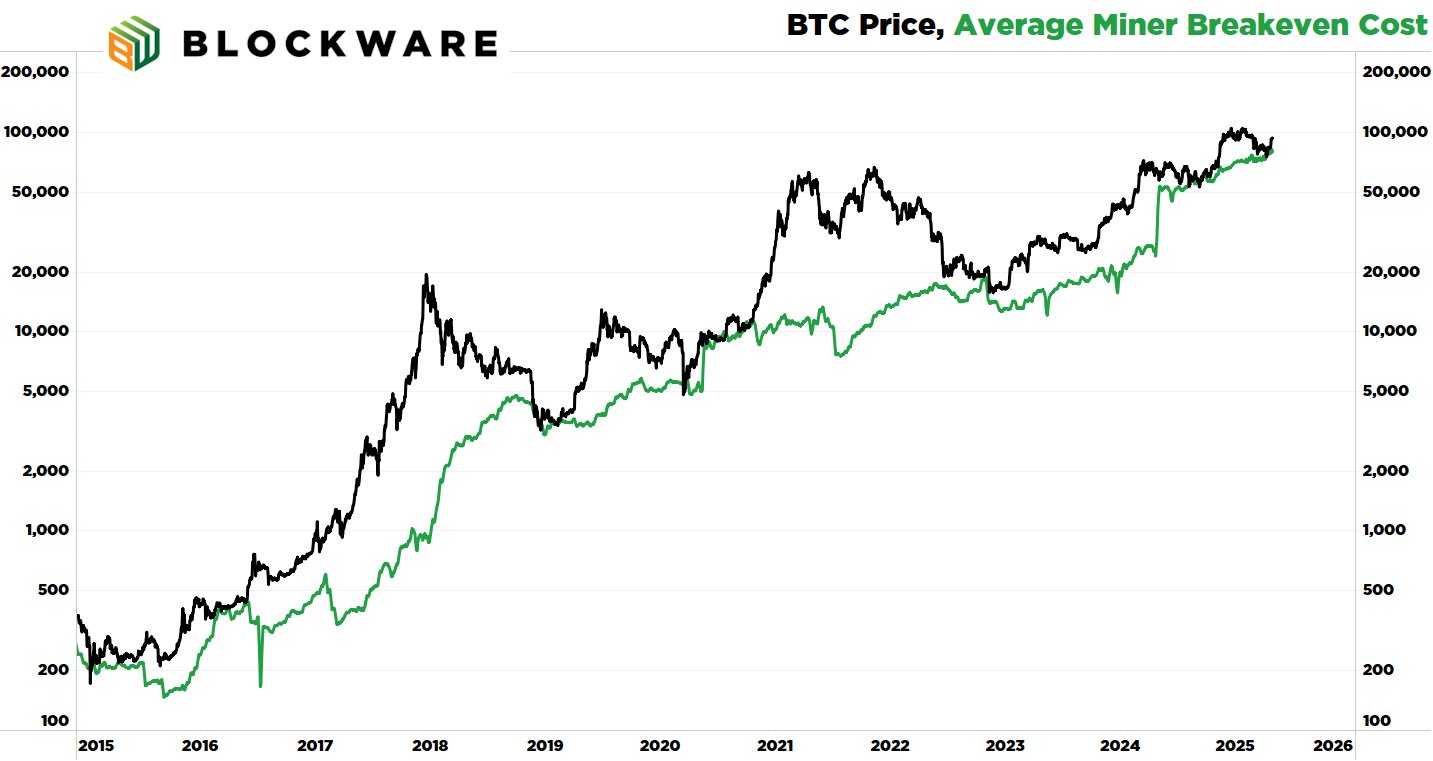
Moreover, Breedlove22, a well-known analyst, shared on X about three indicators signaling optimism for Bitcoin. The first is the Average Miner Cost of Production. According to Breedlove22, this metric is at a bottom, suggesting a significant bull market may be on the horizon.
Average Miner Cost of Production. Source: Breedlove22
The second indicator is the supply held by long-term holders, which measures Bitcoin unmoved on-chain for at least 155 days. Breedlove22 noted that over the past 30 days, long-term holders have acquired an additional ~150,000 BTC.
“Bitcoin is running out of sellers in the $80,000 to $100,000 range,” Breedlove22 stated.
Lastly, and most importantly, is USD liquidity, which effectively represents the “demand” side of the equation. More dollars in the system mean more potential bidders.
“And it’s not just USD liquidity that’s increasing – liquidity of all fiat currencies is on the rise, and Bitcoin is a global asset,” Breedlove22 added.
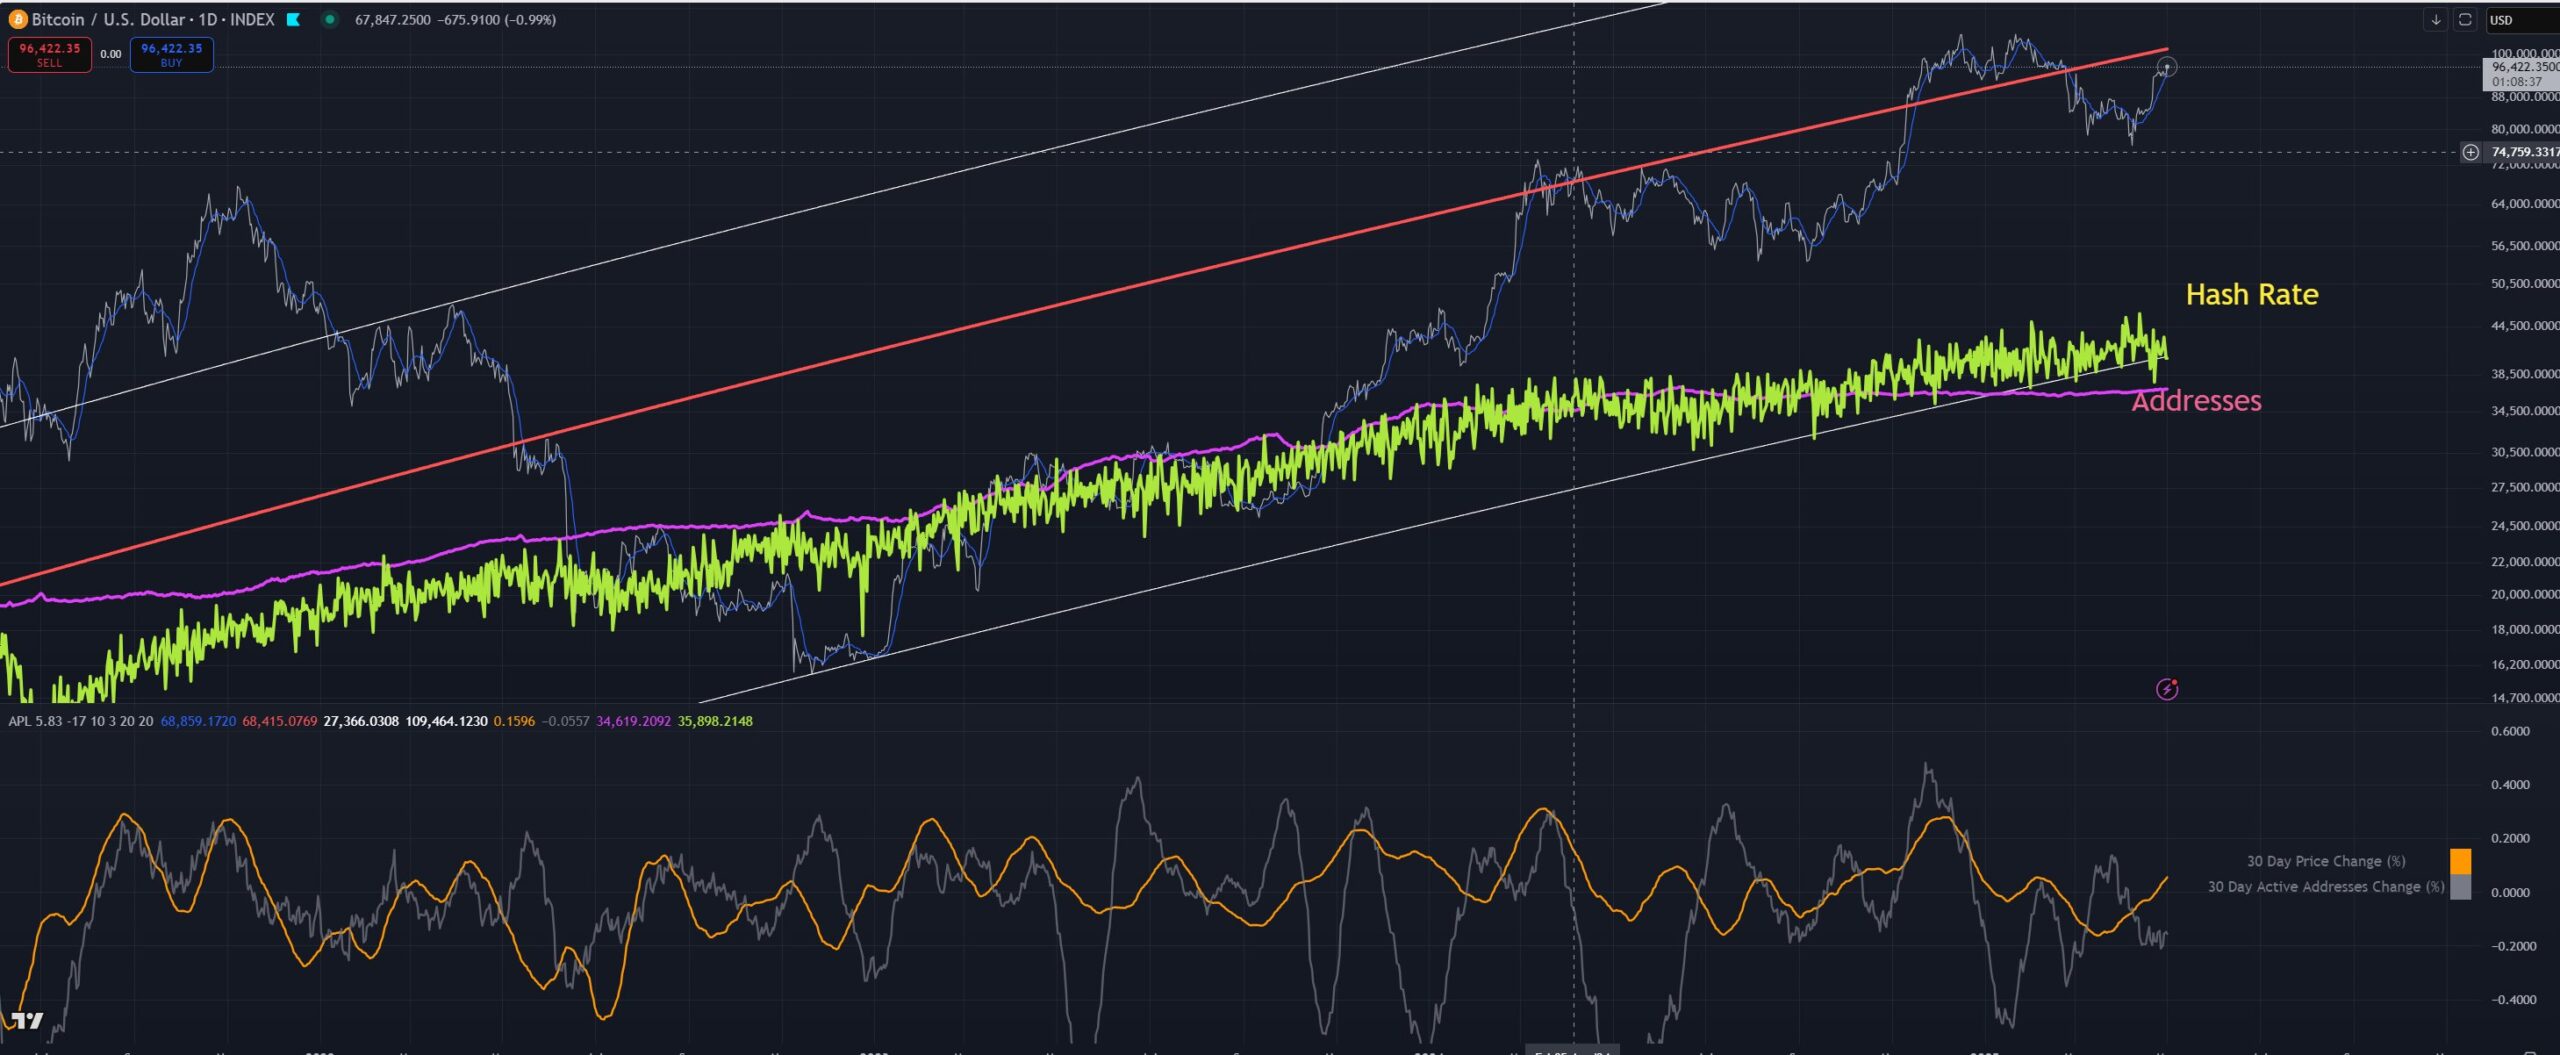
Echoing Breedlove22’s perspective, another X user shared that BTC’s valuation based on hash rate is at a support level, suggesting that a local bottom may have been reached.
In the optimistic scenario, Bitcoin is poised for a significant opportunity to reach $150,000 to $175,000. However, investors should also prepare for risks such as short-term price corrections.
With strong support levels at $93,198 and $83,444, Bitcoin has a solid foundation for continued growth, but caution remains essential.
Solana price is stuck within the range of $140 and $150, but a deep dive into technical analysis suggests that the altcoin may reach $300 soon. Moreover, robust fundamentals, including a surge in SOL staking volumes, support this bullish outlook.
SOL value today trades at $150 after facing rejection at the $153 resistance level. The token eyes more gains this weekend amid a positive shift in the broader market sentiment after Bitcoin broke above $97,000 for the first time in two months.
Solana Price Eyes $300 After Bounce From Critical Trendline
The Solana price is about to enter a recovery phase that may culminate in a 100% surge to $300. This is according to analyst Mihir, who observed that SOL has been trending upwards since 2023, and defending resistance at the lower ascending trendline.
In his analysis, Mihir noted that each time the SOL price bounces from this trendline, it goes on an uptrend. In 2023, the token recorded a 2x rally after making such a bounce, and later in 2024, SOL went on a parabolic bull run from below $20 to an all-time high of $294 after recovering from this support level.
Solana Price Chart
If history rhymes, Solana may have entered a recovery phase, which may push the price upwards to as high as $300 in the near term. This bullish leg may occur in the coming months.
SOL Overtakes Ethereum in Staking Volumes
SOL price also eyes gains after analyst Colin Wu noted that Solana has surpassed Ethereum in staking volumes, a phenomenon that has sparked discussions within the crypto community about whether SOL is now a more secure layer 1. Solana staking volumes stand at $61 billion, which is slightly higher than Ethereum’s $58.7 billion.
While this data suggests that validators are favouring the Solana network over Ethereum, the latter still leads in terms of blockchain security. However, this surge may still fuel a Solana price rally as high staking volumes indicate that a majority of tokens are being taken out of the circulating supply, which may trigger a supply squeeze if demand surges.
Solana Four-Hour Chart Signals Rally
The four-hour Solana price chart teases that this altcoin is on the path towards a bullish breakout if it can overcome crucial resistance hurdles at $153 and $180. If it clears these levels, SOL might make a run up to $205 and kickstart an uptrend towards $300.
The RSI supports this bullish Solana price forecast, after its recent bounce above 50, suggesting that the bullish momentum is growing strong. However, this indicator needs to make a series of higher highs for the bullish continuation to play out. If it drops below 50, it will invalidate this bullish thesis and trigger a downtrend to support at $115.
SOL/USDT: 4-Hour Chart
To sum up, Solana price is flashing bullish signals, with its bounce from a descending trendline and robust fundamentals suggesting that a move to record highs may be on the horizon. The four-hour chart shows a major hurdle at $153 that SOL needs to overcome to avert going back to a downtrend.
RWA Partnership:- RWAs have become the hottest trends of 2025. Deloitte has predicted their total market cap to reach by $4 trillion by 2035.
Not only new RWA-focused innovative projects, but TradeFi giants like Blackrock are also catching up on the opportunity.
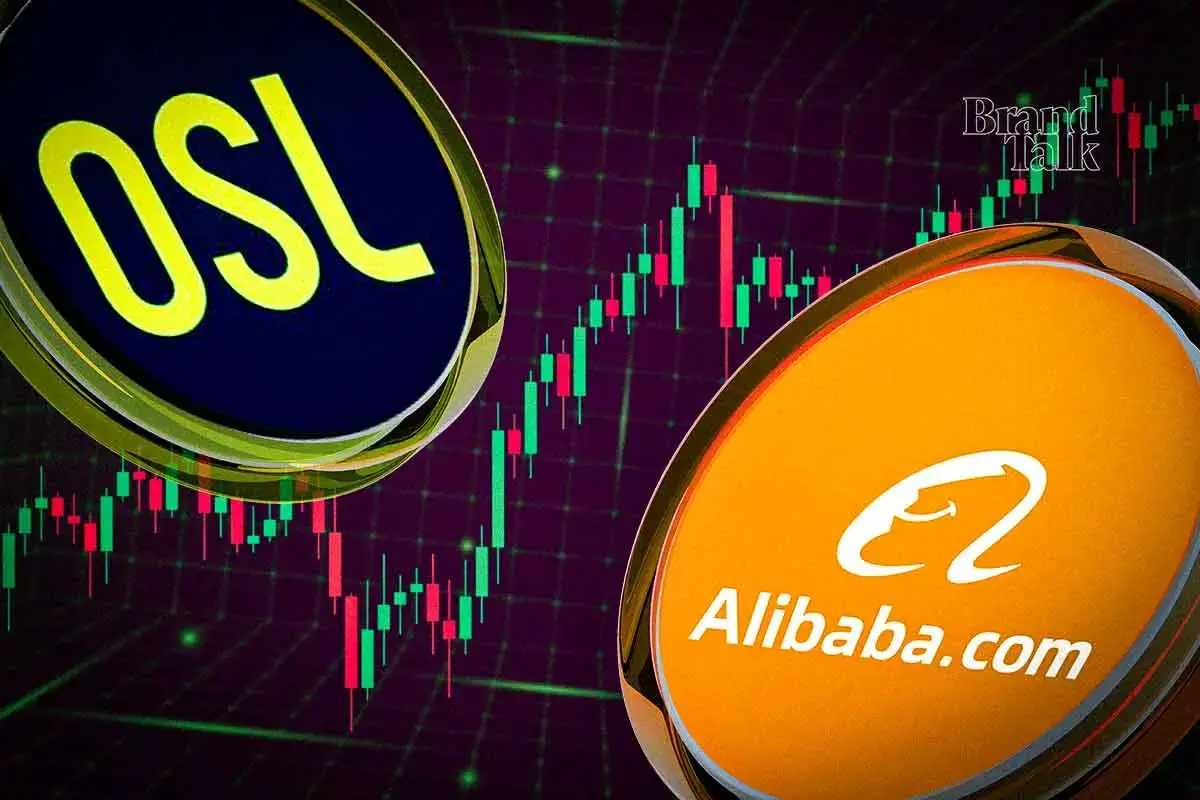
In another similar move, publicly-listed OSL has announced a major move to expand its presence in RWA sector.
The digital asset platform, OSL, has signed a partnership with Ant Digital Technologies at the recently concluded RWA REAL UP Dubai Smmit.
The partnership aims to integrate Alibaba subsidiary Ant’s blockchain tech with OSL’s regulation infra to drive institutional adoption of RWAs.
OSL & Ant Digital Technologies have officially joined forces to drive the institutional future of Real-World Asset (RWA) tokenisation.
Announced at the RWA REAL UP Dubai Summit, this partnership combines Ant’s blockchain tech with OSL’s regulated infrastructure to deliver a… pic.twitter.com/QvXi4HL8ZX
Ant Digital Technologies – formerly AntChain – is a subsidiary of Ant Group, the fintech affiliate of Alibaba Group.
It serves as the enterprise blockchain arm of Alibaba, specializing in blockchain, privacy computing, distributed storage, and digital identity solutions.
Till now, it has largely focused on permissioned chains and private enterprise deployments. This partnership with OSL marks its first significant foray into public Layer-2 blockchain infrastructure.
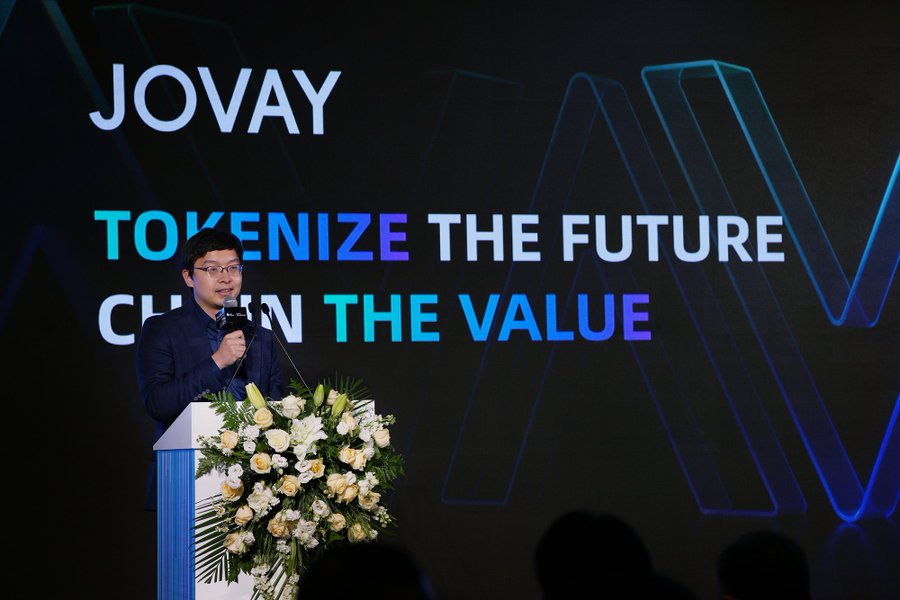
Apart from the partnership and MoU agreement on 30 April, Ant Digital has also launched its new layer2 chain, Jovay. It is designed to interact directly with Ethereum and revolutionize the green financing.
New RWA Chain Focuses on Renewable Products
According to the press release Coingape got access to, Jovay is a newly launched Ethereum Layer2 blockchain developed by Ant Digital Technologies. Unveiled at the REAL UP RWA Summit in Dubai, it is purpose-built for tokenizing real-world assets.
It will particularly work in green finance – such as solar panels, EV charging stations, and battery infrastructure. Jovay will turn them into globally tradable digital tokens.
Jovay is powered by DTVM (DeTerministic Virtual Machine) which is a custom-built, Wasm-based and EVM-compatible smart contract. This was unveiled by Ant Digital a week ago. It’s optimized for high-throughput execution and integrates AI capabilities through tools like SmartCogent.
This allows for intelligent contract automation and lifecycle management. Thus, Jovay will enable high-speed, AI-assisted smart contracts and cross-border RWA transactions.
Already live, Ant Digital hosts over 14 million tokenized green energy devices, making it the world’s largest platform of its kind.
The development of layer2 Jovay and its DTVM engine could lead to significant advancements in blockchain technology. This is especially for RWAs (real-world assets) and green finance.
Till now, sustainable infrastructure financing has been slow, fragmented, and tied to regional markets.
By tokenizing renewable products, Ant Group’s Jovay can increase scalability for clean energy infrastructure. This will also help in providing faster, efficient cross-border liquidity in renewable energy markets.
RWA market is also expected to see bullish momentum in its trading volumes. Further, as Ant Digital partners with OSL, more RWA-focused initiatives are expected in near future.
On-chain data reveals that the expiration of the $2.85 billion BTC and ETH options will take place today, which can affect the crypto market significantly. With the recovery of investors ‘ sentiments toward crypto assets, many, including Bitcoin and others, surged. However, experts are concerned about potential volatility past these options’ expiration. Let’s discuss.
What’s Happening in the Crypto Market Today?
The crypto market heatmap today shows a division of bulls and bears dominance in the market. Some of the cryptocurrencies like Bitcoin, Dogecoin, and Cardano are up slightly in the 24 hours, whereas the remaining Solana, Ethereum, and the rest of the top altcoins remain down.
Despite the bearish performance, the global market cap has surpassed the $3 trillion mark, currently at $3.01 trillion, and the trading volume is $83.89 billion, up nearly 5% today. However, the concerns grow higher, and the fear of a crash builds as $2.85 billion worth of BTC and ETH options expire.
BTC and ETH Option Expiry Breakdown
According to the Deribit exchange reports, 26,949 BTC options are expiring today, with the max pain point between $90,000-$91,0000. The max paint point is the level where most options expire and could influence downward pressure.
As a result, this could create a significant downtrend in the Bitcoin price, currently at $97,045. The Put/ Call ratio is slightly bullish with 0.95 stats on major crypto exchanges, but it is slightly bearish on the Derbit exchange.
Additionally, the investors have stacked heavy call options above $95,000 in the hope of a further rally to $100,000.
In the case of Ethereum, 184,296 ETH options are expiring today. The Put/Call ratio of 0.88-0.92 indicates bullish sentiments. The current Ethereum price is $1,834, and the max pain point is $1,800, i.e, the expirations of most ETH options.
The investors reaction is mixed in this crypto’s case; some are shorting while others are betting long in anticipation of further gains.
What to Expect From the Crypto Market?
The cryptocurrency market is already facing volatility, and the $2.85 billion BTC and ETH expiration could extend it. Based on the current situation, the Bitcoin price could react in three ways: crashing to $90k as dealers wish for a minimum payout, surge to $100k based on call staking, and sideways consolidation amid neutral sentiments.
Ethereum price can also move similarly, but additional factors like the US job data report and others also need to be considered. Overall, the options expiry could affect these cryptos and the rest of the market significantly.


 Adler Jr (@AxelAdlerJr)


 OSL & Ant Digital Technologies have officially joined forces to drive the institutional future of Real-World Asset (RWA) tokenisation.