Arizona’s Bitcoin Reserve Bill, SB 1373, has successfully passed the House Committee of the Whole. The bill is now set to move forward to the Third Reading and the final floor vote. This significant step brings Arizona closer to establishing a Bitcoin reserve, potentially strengthening the state’s role in the cryptocurrency space. If approved, this bill could have lasting implications for Arizona’s approach to Bitcoin and digital assets.
BlackRock Ethereum ETF (ETHA) hits a massive milestone with 3 million ETH holdings after the latest purchase of 59,309 ETH on July 29. The Ethereum fund has been on a massive acquisition spree in July, with assets under management (AUM) now over $11.1 billion. Amid these massive inflows, the ETHA share price is showing strength
Donald Trump’s announcement that the US would create a National Strategic Crypto Reserve that would include Bitcoin and other altcoins sent market prices to the moon. However, the reality behind its creation is far more complicated than what investors’ enthusiasm might indicate.
In an interview with BeInCrypto, Erwin Voloder, Head of Policy of the European Blockchain Association, explained that if the US acquired more crypto beyond the seized assets from law enforcement, it would have to overcome several Congressional hurdles and public scrutiny.
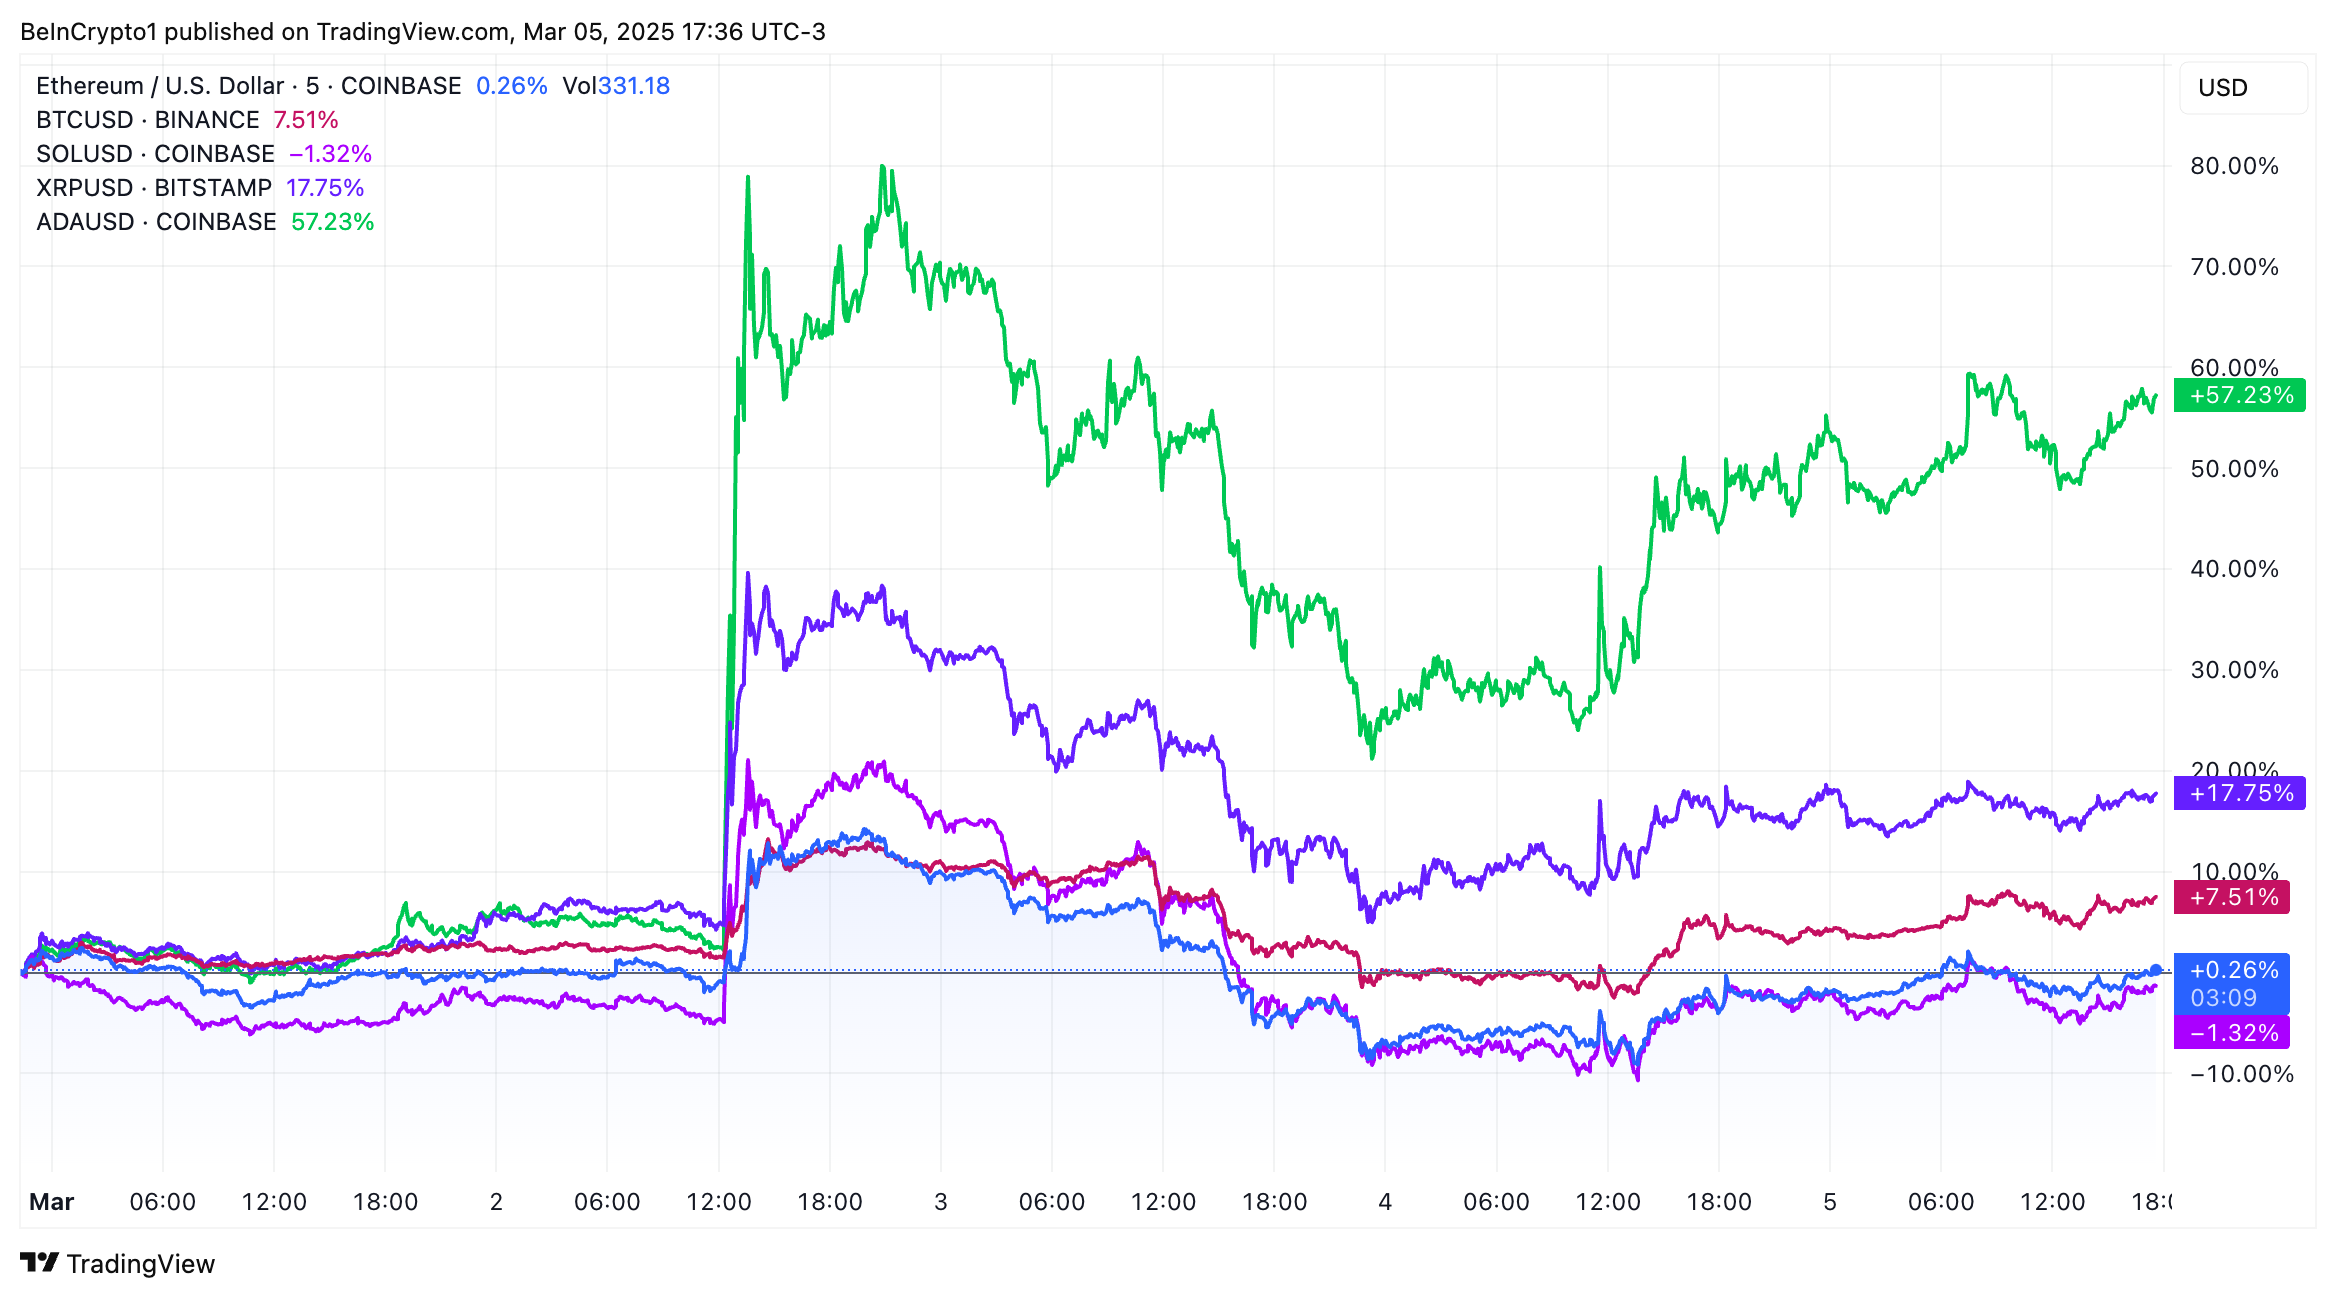
“A US Crypto Reserve will elevate this critical industry after years of corrupt attacks by the Biden Administration, which is why my Executive Order on Digital Assets directed the Presidential Working Group to move forward on a Crypto Strategic Reserve that includes XRP, SOL, and ADA. I will make sure the US is the Crypto Capital of the World,” Trump posted on Truth Social.
BTC, ETH, SOL, XRP, and ADA prices rose sharply following Trump’s National Strategic Crypto Reserve Announcement. Source: TradingView.
Despite the positive reaction the news had on the market, analysts quickly began wondering how feasible Trump’s promises were and how beneficial they would actually be for further adoption.
Challenges in Defining Reserve Purpose
Establishing a National Strategic Crypto Reserve aims to encourage institutional adoption and influence global crypto regulations. As a national stockpile of digital assets, nations can use this reserve for financial stability, economic diversification, and geopolitical leverage.
“The reserve is intended to position the US as a leader in the digital asset space, ensuring that the nation has a strategic buffer against potential economic and geopolitical risks related to cryptocurrencies. By holding a mix of major cryptocurrencies (including Bitcoin, Ether, XRP, Solana, and Cardano), the reserve aims to serve as a long-term store of value and a hedge against currency devaluation and market volatility,” Voloder told BeInCrypto.
However, Trump’s announcement left analysts and the crypto community with many unanswered questions regarding the reserve’s key operational details.
Legal and Operational Uncertainties
The source of the reserve’s authority is among the points of contention. Some believe a new act of Congress is necessary, while others suggest Trump could establish it through executive powers.
“This uncertainty leaves a major operational detail undefined – without clear legal footing, the timeline and process for setting up the reserve are in limbo, and it could face political or legal challenges if not properly authorized,” Voloder explained.
“Nothing new here. Just words. Let me know when they get congressional approval to borrow money and or revalue the gold price higher. Without that they have no money to buy Bitcoin and shitcoins,” he wrote.
Similarly, though the announcement named five cryptocurrencies that would be incorporated into the reserve, it offered no specifics on allocation or criteria.
“Key questions like how much of each asset to hold, what proportion of the reserve each will comprise, and whether other tokens might be added were left unanswered. This lack of detail means it’s not clear if the reserve will heavily favor Bitcoin as a ‘digital gold’ approach or truly split among multiple assets,” Voloder added.
Another critical operational detail that has yet to be clarified is how the government will secure the custody of these digital assets and manage their associated keys. This complex undertaking requires stringent security protocols to safeguard against hacks and insider risks.
“The announcement didn’t address whether a federal agency like the Treasury or Federal Reserve will directly hold the assets, or if they’ll use third-party custodians, nor how they’ll ensure security and transparency. Failing to define this invites concern over potential cybersecurity risks or losses, which would be both economically damaging and politically embarrassing,” said Voloder.
The Trump administration’s lack of operational details, coupled with the need for strong justification, also creates questions about the urgency of the proposed crypto reserve.
Uncertainty Over Reserve’s Strategic Necessity
Skeptics of Trump’s announcement are raising concerns about the timing and purpose of a crypto reserve.
The federal government establishes reserves, such as the Strategic Petroleum Reserve, to secure essential commodities during economic crises. President Ford created the Petroleum Reserve after the 1973 oil crisis, which continues to be useful today.
“Aside from ‘holding’ crypto, there is no clarity on how the reserve would be managed and under what conditions it might be utilized. For example, strategic reserves (like the oil reserve) are usually tapped during crises or to stabilize markets – but when or why the government would deploy its crypto holdings is not specified,” Voloder said.
Unlike petroleum, which directly impacts the US economy, Bitcoin’s economic role remains unclear. Therefore, its necessity as a strategic asset is questioned. While oil reserves stabilize energy prices during crises, the rationale for a Bitcoin reserve lacks clear economic justification. This inconsistency makes clarifying a crypto reserve’s purpose all the more necessary.
“Is the reserve purely an investment to bolster the treasury long-term, a hedge against dollar inflation, or a tool to intervene in crypto markets during volatility? These questions are unanswered. Without defined objectives and governance protocols, it’s unclear how the reserve will function day-to-day or in emergencies. This vagueness makes it harder for markets to gauge the government’s future actions, while Congress and the public lack insight into the reserve’s purpose, making it harder to build support,” Voloder added.
Given the scenario, many proponents see transferring seized Bitcoin from the Department of Justice to the crypto reserve as the path of least resistance.
Leveraging Seized Crypto Assets
According to CoinGecko, governments worldwide collectively owned 2.2% of Bitcoin’s total supply as of July. Most countries with a crypto stockpile acquired Bitcoin through law enforcement seizures of illicit activity.
The United States currently holds the largest stockpile of seized assets, with approximately 200,000 Bitcoins, worth more than $20 billion at current market valuations. This is a very advantageous starting point for a strategic crypto reserve in the United States.
“In economic terms, this is a significant reserve base that could be allocated to the new Crypto Strategic Reserve without any new purchases. As a selling point, using what the government has already taken from criminals is easier to justify than spending new money. It can be framed as ‘putting seized ill-gotten gains to work for the public good,’” Voloder told BeInCrypto.
Using seized criminal Bitcoin as the primary source for the reserve would have the least disruptive impact on market dynamics since these coins have already been removed from the open market.
Unlike countries like Germany, which have sold off seized Bitcoin, proponents of a US reserve advocate for retaining those assets, effectively removing them from the market indefinitely.
“This could be mildly bullish for crypto prices in the long run, as it removes the overhang of government auctions which in the past have periodically added supply and dampened prices. Not selling seized BTC means avoiding downward pressure that such large auctions might create. However, since the market likely anticipated those coins being sold at some point, the decision to hold is a change – it’s as if a new long-term holder (the government) emerged, tightening supply,” Voloder said.
The move would also avoid causing a sudden spike in demand. In contrast to an active purchasing program, simply reallocating existing holdings into the reserve is a relatively neutral market event.
“The announcement of the reserve itself moved prices due to sentiment, but that was anticipation; the actual act of transferring seized coins to a reserve doesn’t involve buying or selling in the open market. This is a quieter way to build the reserve – it doesn’t expend capital and doesn’t disrupt market pricing through large buy orders,” Voloder added.
However, in his announcement, Trump anticipated buying crypto beyond Bitcoin, implying that the government would need to purchase altcoins from the open market.
Scrutiny Over New Altcoin Acquisitions
The US government’s current cryptocurrency holdings primarily consist of seized Bitcoin and, to a lesser extent, Ethereum. However, it holds no significant reserves of assets like XRP, Solana, and Cardano. Therefore, if Trump effectively diversifies the reserve, these altcoins will have to be acquired.
“This means additional purchases are almost certainly required if those named tokens are to be part of the reserve. The likelihood of new acquisitions for those assets is high, because otherwise the reserve cannot include them as promised. In other words, unless the plan changes, the government would have to go out and buy XRP, SOL, ADA, etc., since it can’t simply reassign seized holdings that it doesn’t have,” Voloder said.
“Key questions like how much of each asset to hold, what proportion of the reserve each will comprise, and whether other tokens might be added were left unanswered. This lack of detail means it’s not clear if the reserve will heavily favor Bitcoin as a ‘digital gold’ approach or truly split among multiple assets. From an economic perspective this also leaves the optimal mix for stability vs. growth potential undefined, and politically, including riskier altcoins could be controversial,” Voloder added.
The announcement of a US crypto reserve that included altcoins beyond Bitcoin also raised concerns among crypto supporters, such as Coinbase CEO Brian Armstrong.
“Just Bitcoin would probably be the best option – simplest, and clear story as successor to gold. If folks wanted more variety, you could do a market cap weighted index of crypto assets to keep it unbiased,” Armstrong said in an X post.
“I get the rationale for a Bitcoin reserve. I don’t agree with it, but I get it. We have a gold reserve. Bitcoin is digital gold, which is better than analog gold. So let’s create a Bitcoin reserve too. But what’s the rationale for an XRP reserve? Why the hell would we need that?” Schiff wrote on X.
Meanwhile, how new Bitcoin and altcoin acquisitions will be funded raises concerns across the community.
Funding the Reserve: Taxpayer Money and Debt
Neither Trump nor Crypto Czar David Sacks addressed how new Bitcoin acquisitions for the crypto reserve would be funded, leaving the public guessing. According to Voloder, the government could take several different avenues. However, all of them involve roadblocks that must be overcome.
One potential funding method is direct allocation for additional cryptocurrency purchases through taxpayer funds or by issuing new Treasury debt. However, both of these options present significant concerns.
“The government could simply allocate funds to buy crypto either by appropriating tax revenue or, more likely, issuing new Treasury debt to raise the money. This means adding to the national debt or diverting funds from other programs. For example, if $10 billion is allocated, that either increases the deficit or requires cuts/taxes elsewhere. Given the huge national debt (~$36.5 trillion) and already hefty interest costs, adding even tens of billions for crypto might be seen as imprudent,” Voloder told BeInCrypto.
Funding new cryptocurrency acquisitions with taxpayer money would likely face strong opposition from lawmakers and the public, creating significant Congressional hurdles for Trump.
“Then there’s the inherently contentious nature of using taxpayer funds for what some may view as political adventurism. Opponents (including some Republicans) already argue that proposals to spend federal funds on bitcoin put taxpayers’ funds at risk, essentially gambling public money on a volatile asset. There would likely be congressional pushback and public skepticism about why tax dollars should buy crypto instead of funding schools, defense, or reducing debt. Unless framed as an investment that will reduce debt long-term (and that argument convinces enough lawmakers), direct funding is a tough sell,” Voloder added.
Meanwhile, the United States has the highest fiscal deficit in the world. Given the current environment, funding cryptocurrency purchases with taxpayer money is hard to justify. Issuing more debt to purchase hoards of volatile assets would not sit comfortably among many.
“If the crypto rises in value long-term, it could pay off; if it crashes, the government (and indirectly taxpayers) eat the loss. This dynamic will be closely watched. In the short run, spending, say, $10 billion on Bitcoin would add $10 billion to the deficit if not offset – not huge in a $20+ trillion economy, but symbolically significant. The market might view a well-funded reserve as bullish, with government skin in the game, but bond investors or credit rating agencies might view it as the state taking on speculative risk,” Voloder said.
New market purchases would also have a significant impact on market dynamics.
Should the government choose to purchase additional cryptocurrency for the reserve through open market acquisitions, the consequences would be substantial. This government buying would introduce a significant new source of demand, potentially driving up crypto prices.
“Actual sustained purchasing, like if the government regularly buys coins, could create an upward price bias – traders might front-run expected government buys, adding to the momentum. This could lead to higher prices in the short term, benefiting existing holders and the government’s own newly bought stash, creating a self-reinforcing effect if timed well. The risk here is the government becoming a sort of market mover,” Voloder explained.
Meanwhile, substantial acquisitions by the US government would also quickly erase a large part of the general market’s supply.
“Given crypto’s relative size, a US government buying program is significant; any hint of policy change such as slowing or stopping purchases could then cause downturns as traders adjust. Essentially, it introduces a new large whale in the market – one whose actions are somewhat predictable or politically driven, and thus subject to speculation. Volatility could increase, as markets swing on rumors of government buying or selling. As skeptics note, due to Bitcoin’s volatility, any government transactions could have outsized price impacts,” Voloder added.
In contrast, Voloder noted that a government sale of its reserve holdings could result in a dramatic market decline.
“Part of the strategic reserve concept is presumably not to sell casually and only in emergencies, but markets will be wary that at extremely high prices or in certain scenarios, the government might liquidate some holdings especially if there’s political pressure to realize gains to pay down debt. That overhang could cap excessive price rises to some extent,” he said.
Given the many obstacles open market purchases of new crypto would face, some proponents have looked into other venues for acquisition.
Exploring Alternative Funding Sources
Other possible sources of funding have surfaced besides using already seized Bitcoin or directly allocating new spending to purchase other cryptocurrencies. However, each has its respective implications.
Proponents have floated the idea to use the Exchange Stabilization Fund (ESF), which can hold foreign exchange currencies. The US Treasury uses the ESF as an emergency reserve to adjust foreign currency exchange rates without directly impacting the domestic money supply.
“Some experts suggest the ESF could directly purchase or hold Bitcoin by executive. The ESF holds several tens of billions in assets including some foreign currencies and special drawing rights that could potentially be shifted into crypto without a new congressional appropriation. Using the ESF would be quasi-off-budget – it wouldn’t require new taxes or debt, which is a political plus (it appears as using existing Treasury resources),” Voloder told BeInCrypto.
The ESF could be used to acquire or hold Bitcoin directly through executive action. Its substantial assets, including foreign currencies, allow for potential crypto allocation without Congressional approval. This ‘quasi-off-budget’ approach, which avoids new taxes or debt by utilizing existing Treasury resources, presents a political advantage.
But this option brings other considerations.
“Economically, however, the ESF is limited in size; it might fund an initial tranche of purchases but not a massive reserve. Also, reallocating ESF assets which currently backstop currency stability into crypto could have knock-on effects – e.g. less buffer for [foreign exchange] crises, and increased exposure to crypto volatility. An ESF maneuver might also draw legal scrutiny: is crypto considered a foreign currency for ESF purposes? and could be criticized as an executive overreach if done without Congress. Still, it’s a possible funding tool that avoids directly raiding taxpayer funds,” Voloder said.
Another rising funding idea is the possibility of selling or revaluing gold reserves.
Gold Reserves as a Potential Funding Source
With approximately 8,133 tonnes, the United States holds the world’s largest gold reserves, representing 72.41% of its total reserves.
In December, Arthur Hayes proposed in a substack article that the Trump administration should devalue gold and use the money to create a Bitcoin reserve. He based his statement on the idea that devaluation would allow the Treasury to generate credit for dollars quickly.
This credit could later be injected directly into the economy. It would also eliminate the need for diplomatic efforts to persuade other countries to devalue their currencies against the US dollar. The larger the gold devaluation, the bigger the credit would be.
Voloder sees some value in this article, arguing that the US can monetize part of its gold stock to fund crypto purchases.
“This could happen in two ways: outright selling a portion of the gold stockpile for cash, or revaluing gold on the balance sheet to create accounting gains that can be leveraged. The idea of revaluing gold by increasing the book value of gold holdings to current market price has been floated as a way to boost the Treasury’s coffers without new taxes. The difference could then be used to buy Bitcoin or other assets. If gold is sold, the US would be swapping one reserve asset for another and diversifying from gold into crypto. This could put downward pressure on gold prices depending on sale volume and upward pressure on crypto from the buying,” he explained.
Meanwhile, revaluing gold rather than selling it avoids a direct market impact on the gold price. This action represents an accounting adjustment that allows the Treasury or Federal Reserve to record a one-time gain.
An Accounting Maneuver
Given that US gold is valued at $42 per ounce—significantly below market price—revaluation could generate hundreds of billions in dollar assets.
The government effectively creates a sovereign wealth maneuver by tying the crypto reserve to gold. Advocates for a US sovereign wealth fund propose using gold’s unrealized gains to fund higher-yield assets, a model that fits a gold-backed crypto reserve.
However, gold hedges against equity market losses and provides stability against volatility. Therefore, reducing the US gold supply to fund a volatile asset will undoubtedly face strong opposition.
A gold sell-off would restructure national reserves, possibly shifting from a stable asset to a more volatile one, raising concerns about increased risk.
“Selling gold could be controversial – gold reserves are seen as sacrosanct by some, and there may be resistance to diminishing them. However, supporters might argue that a modest reallocation in the ballpark of 5-10% of gold into Bitcoin aligns with modernizing the reserve mix for better returns,” Voloder said.
Meanwhile, reevaluating gold instead of outright selling it might be more feasible.
“Revaluation as a funding trick might be an easier sell politically if it doesn’t feel like spending taxpayer money, just ‘unlocking’ value, but some may see it as an accounting gimmick or a form of backdoor money printing,” Voloder added.
Given these drawbacks, some economists have also turned to revenue generated from tariffs on imports as a source of funding for a crypto reserve.
Tariffs as a Revenue Stream
During his campaign and first few months as President, Trump created the concept of an “External Revenue Service.” Under this pretense, Trump proposes collecting tariffs so that “instead of taxing our citizens, we will tariff foreign countries to enrich our citizens,” as he phrased in his inaugural address.
Using the revenue generated from tariffs for the reserve means the funding is essentially from importers and consumers rather than income taxpayers, which Trump sees as politically advantageous.
“In the context of funding a crypto reserve, tariff revenues could be earmarked or redirected to cover the cost of purchases. For instance, a new broad-based import tariff (say 10%) could yield an estimated $300–$400 billion per year, a portion of which might fund strategic initiatives like this reserve,” Voloder said.
“Tariffs act as a tax on imports, which often pass the cost to consumers and businesses – potentially raising domestic prices and inviting retaliation from trade partners. So, while tariffs could generate substantial revenue, they might also slow trade and economic growth if other nations respond or if import costs soar,” he said, adding that “they were a feature of Trump’s trade policy in his first term and often led to trade wars, which can hurt farmers and exporters.”
Meanwhile, lawmakers on both ends of the spectrum have expressed concern that relying on tariffs for revenue is regressive. Some argue that tariffs act as a sales tax on consumers and provide unreliable income.
While presenting tariffs as a burden on foreign entities might appeal to some, it could strain relationships with key trading partners like Canada, Mexico, and China, potentially leading to political complications and required negotiations.
Sovereign Wealth Funds and Long-Term Bonds
Other potential funding mechanisms that have surfaced include creating a US sovereign wealth fund (SWF) and issuing ultra-long-term bonds.
The idea involves monetizing existing US assets to create a SWF capable of investing in cryptocurrency. Unlike traditional SWFs funded by trade surpluses, the US, which suffers from a trade deficit, would leverage government-owned assets like federal land, mineral rights, and spectrum licenses. This process would generate capital for SWF investments in higher-yield holdings like stocks and cryptocurrencies.
“If implemented, this could be a major source of funding– the US has vast assets that, if leveraged, could provide trillions. For instance, revaluing gold could be one component, or issuing bonds secured by future federal revenues, etc. However, a leveraged SWF approach is risky: it’s akin to the government running a hedge fund – borrowing money (or using asset collateral) to buy volatile investments. If those investments like Bitcoin outperform the borrowing costs, the nation profits and debt burdens ease; if they underperform or crash, taxpayers could end up worse off having effectively socialized investment losses,” Voloder told BeInCrypto.
Voloder suggested the administration could fund the crypto reserve by issuing very 50-year or 100-year bonds. These could attract investors and lock in fixed-rate financing. While issuing new debt increases the overall debt, long-term bonds delay repayment. They could free up cash flow if foreign debt holders were persuaded to swap for zero-coupon bonds, potentially freeing up funds for the crypto reserve.
“From an optics perspective, century bonds could be framed as patriotic financing– asking allies or investors to help the US secure its financial future in exchange for a safe long- term instrument. But it might also be seen as a gimmick that only delays debt problems without solving them. Moreover, if tied to funding crypto, critics might argue it’s like trading long-term obligations for a speculative asset. In essence, century bonds could reduce the immediate fiscal pressure by cutting interest costs or spreading out impact, making it easier to justify spending on a reserve now, but they are not free money,” he said.
Another option is the creation of a US Infrastructure Fund (USIF).
The USIF Proposal
Strategists analyzing how to reduce the US’s massive fiscal deficit have proposed creating a USIF. This would allow Treasury bondholders to swap debt for infrastructure equity, reducing interest burdens and creating potential revenue streams, freeing up fiscal space.
USIF offers a dual benefit: infrastructure improvement and debt reduction. Success could indirectly justify allocating funds to a crypto reserve through generated dividends or savings. This approach signals a holistic debt strategy, restructuring obligations to improve the fiscal position and funding strategic investments.
“This is a more roundabout funding path, but it tries to be sustainable. It doesn’t rely on continuous taxpayer infusions, instead using economic growth and reallocated capital to support the reserve. The political benefit is that it sounds responsible – tying the reserve to infrastructure and debt reduction – but detractors might call it overly complicated or doubt its feasibility,” Voloder concluded.
While Voloder believes that there is not one solution to effectively fund a national strategic crypto reserve, different aspects of the various mechanisms he factored in can be employed to responsibly and strategically create a reserve that would have minimal impact on American taxpayers.
Voloder argues that no single solution can effectively fund a national strategic crypto reserve. He believes that combined aspects of various mechanisms can be leveraged to create a reserve responsibly and strategically.
The key, however, is not to fund the reserve using public money.
Minimizing Taxpayer Impact
Today, a critical political gap exists across the United States. Though the Republican Party holds a majority over the House and the Senate, this advantage is razor-thin. Furthermore, Trump does not count on absolute Republican approval over his crypto reserve agenda.
This reality requires careful policymaking, especially considering public opinion on crypto remains fundamentally divided.
Using an unpopular method to finance the acquisition of more crypto for a recently created fund could have unwanted effects on crypto enthusiasts’ long-term goals.
“Many Americans remain skeptical or don’t fully understand it, while a vocal minority are enthusiastic. If taxpayer money is used, those skeptical might react negatively. This could lead to backlash, protests, or demands to halt the program, especially if the crypto market experiences a downturn,” said Voloder, adding that “if one administration uses public money for the reserve, a future administration and especially of another party might reverse course – possibly even liquidating the reserve – if there’s enough public anger or if they view it as misguided.”
Given this reality, critics have already suggested that Trump’s crypto moves could be a payoff to industry backers. If actual taxpayer money is deployed, those critiques would amplify.
“Any hint that the reserve’s creation enriched certain investors or insiders would be a scandal. The conflict of interest angle is real – the Financial Times noted some Trump advisers have crypto investments, raising concerns that official decisions might benefit those insiders. Using public money in this space would demand extreme caution to avoid any appearance of self-dealing. If such allegations arise, it could tarnish the administration and erode trust in the program. Opponents would seize on any whiff of impropriety to attack the legitimacy of the reserve,” Voloder said.
Thus, the administration would also need to develop clear and ethical guidelines for pursuing a National Strategic Crypto Reserve.
With over 20 million users and seven years of operation under its belt, crypto exchange BingX is carving out a unique path through user-focused innovation and institutional-grade infrastructure.BingX is positioning itself as a hybrid exchange that balances ease of use for retail traders with the sophistication institutional investors need.
At the center of this evolution is Vivien Lin, Chief Product Officer and Head of BingX Labs, who is spearheading the platform’s product innovation and strategic direction. In an exclusive interview with BeInCrypto, Lin sheds light on BingX’s scaling efforts, regulatory adaptations, and expansion into emerging sectors like Real World Assets (RWA) and AI.
Ensuring Scalable Growth Amidst Expanding User Base
This year marks our seven-year anniversary, and to date, we’ve proudly served over 20 million users worldwide.
Scalability has always been a significant challenge for platforms with a large retail user base. At BingX, we’ve addressed this by continuously upgrading our core systems. We’ve streamlined and simplified the entire process—from order placement to execution.
We consistently optimize our underlying infrastructure and database architecture and apply the latest technologies to enhance the overall user experience. We also actively listen to our community. Whenever users highlight areas for improvement, our dedicated product team takes their feedback seriously and investigates those needs. By doing all this, we ensure two things: first, that our product team stays closely connected with our users, always listening to their voices; and second, that our technology evolves to meet the growing and dynamic demands of our global user base.
Innovative Product Initiatives for 2025
One of our key strategies is to stay aligned with trending products and the evolving needs of our user base. At BingX Labs, our approach is more targeted: when we identify a sector with strong potential, we invest in small companies or emerging teams to test the market.
Throughout this process, we don’t just invest—we also actively support these projects by helping them acquire users, refine their go-to-market strategies, and even advise them on their tokenomics. This allows us to both explore new market opportunities and help our portfolio projects grow successfully.
What sets BingX apart from other global exchanges is our focus on specific areas where we see a strong advantage. One of those areas is Real World Assets (RWA). We have several major partners from the trade sector with deep access to valuable assets. By collaborating with them, we’re able to combine our user base and regional resources to advance the RWA space effectively.
Another area of focus is AI. Internally, we consistently explore how AI can enhance our operational efficiency and improve user experience. In fact, BingX is likely one of the most active exchanges investing in AI. We’re launching a dedicated AI fund to invest in AI-driven projects, technologies, and strategic partnerships.
Improving Trust and Security Post-FTX
Post-FTX, we’ve taken several key measures to reinforce transparency and user protection.
First, we regularly publish our Proof of Reserves to help the public clearly understand the scale of our reserves and to build greater trust. It demonstrates that our operations are fully backed by assets—100%.
Second, we recently launched our Shield Fund, a $200 million protection fund designed to safeguard user assets in extreme or unforeseen situations. Of course, we hope such events never occur, but we’re prepared.
Third, we’ve invested heavily in how we structure our wallets. Our layered security system includes hot, warm, and cold wallets—with the majority of assets stored securely in cold wallets.
Given the rise in hacker activity, especially the number of DEX platforms hacked in the past 12 months, we take these risks seriously. Every incident in this industry serves as a valuable lesson. We use these events as learning opportunities to strengthen our technology and enhance our security measures, ensuring a safer system for our users.
Enhancing Copy Trading for Diverse User Levels
Actually, there are two parts to this question.
First, who are the copy trading users? Based on our experience and observations, most of them are retail customers. That’s because the crypto space can be overwhelming for newbies and everyday users. It’s complex, and many people find it difficult to navigate on their own.
That’s why we aim to onboard institutional or professional traders as master traders—the leaders others can follow.
Second, how we make copy trading more effective and rewarding for retail users, we’ve developed a rigorous screening process through our Elite Traders Program. Master traders must pass specific filters and evaluations before being granted more exposure and benefits on the platform.
After going through this process, these traders typically demonstrate stronger skills and better risk management. This helps retail users easily identify and follow trustworthy and capable master traders, giving them a seamless and more rewarding trading experience.
Insights into Institutional Adoption Trends
We’ve seen a significant influx of institutional customers, especially following the approval of crypto ETFs. Many traditional finance (TradFi) traders and institutions are now actively entering the crypto market.
When these institutions look for partners, they typically start with a shortlist of trusted exchanges. Then, they examine each platform’s micro-dynamics. We’ve had many reputable TradFi institutions approach us expressing interest in forming trading partnerships with our exchange. This has become a notable trend in the current market.
Of course, this trend also presents challenges. One of the biggest is upgrading our core systems to meet institutional demands. These clients expect faster execution speeds, lower latency, etc.
At the same time, this shift has pushed us to elevate our service quality. We now have a dedicated VIP team that caters specifically to institutional clients, family offices, and high-net-worth individuals. We offer them tailored solutions, including asset and wealth management services, as well as other customized features designed to meet their unique needs.
Differentiating BingX in a Competitive Market
On the one hand, we run a variety of engaging campaigns. Some are fun and interactive—like “share your life” or “share your habits,” where users can retweet or reply to our posts on X for a chance to get lucky.
We also have our big campaign, our Super 7 Anniversary, which features a substantial prize pool. By participating, users have a great chance to earn rewards through different campaign activities.
On the other hand, what truly differentiates BingX from other major exchanges is our effort to understand our users’ needs deeply. We recognize that even when offering the same functionality, exchanges often execute it differently. These differences often reflect subtle variations in trader behavior.
Take our Standard Futures product, for example. It’s incredibly simple and beginner-friendly, which is why it’s popular among newcomers. Other platforms may focus more on advanced features for professional traders and might overlook this kind of offering.
This is just one example of how we tailor our products to specific user segments. We also offer many other features designed for niche user groups. That’s how we continue to capture and grow our market share.
BingX on Convergence Between CeFi and DeFi
I believe CeFi and DeFi are complementary to each other. CeFi typically offers a better user experience, while DeFi excels in transparency.
However, we’re observing a clear trend: CeFi platforms are becoming increasingly transparent, and DeFi platforms are actively working to improve their user experience, moving closer to what CeFi offers.
In the end, the differences or competition between CeFi and DeFi will likely come down to the fundamental characteristics of their underlying technologies, such as trading speed, latency, and the level of security each can provide.
Focus Areas for Partnerships in 2025
We’ve always focused on infrastructure, but in this cycle, we’re seeing fewer truly innovative infrastructure projects emerging. That said, we’re still actively looking for teams with strong technical backgrounds who are working on new infrastructure solutions.
That’s one area of focus. Another is the RWA (Real World Assets) space—we’re exploring new partnerships there, as well as in the AI space.
Personally, I’m also diving deeper into PayFi and related sectors. There are quite a few emerging projects in this space—like PayFi itself, and hardware-focused solutions like Wary—and these are the kinds of areas we’re currently paying close attention to.
We’re actively exploring opportunities in DeFi and DEX. We’re particularly interested in partnering with high-performance mainnets. Additionally, we’re looking for mainnets that already have a strong user base, which we believe are especially well-suited for sectors like GameFi and SocialFi.
These are the areas we see as having high potential in the next cycle.
Expansion Beyond Trading
We’ve just launched a new product called ChainSpot, designed to bridge the CeFi user experience with DeFi liquidity.
What this means is that when a user has a BingX account, they can seamlessly access DEX liquidity. This gives them early access to tokens as soon as those tokens have an active on-chain pool.
And this is just the beginning—we have many similar initiatives coming in the next few months. So stay tuned, we’ll be announcing more very soon.
Navigating Web3 as a Female Leader
I think there’s a common misconception that women working in the Web3 industry are too soft or unwilling to take on technical roles.
But based on my own observations and experience working in crypto and Web3 firms, I’ve seen that women are incredibly clear-minded, determined, and hardworking.
One piece of advice I’d offer to female leaders—or women looking to enter this industry—is to learn something technical, whether it’s coding, AI technologies, or even marketing and customer service. Gaining skills in these areas will help you become a more well-rounded professional.
That kind of versatility builds a sharper understanding of what the market needs and what people truly want. When you’re in Web3—and especially when you grow into a leadership role—all these skills and insights connect.
Final Thoughts
Personally, I’ve been hearing a lot of talk about whether we’re in a bull or bear market, and how market value is low, and so on.
From my perspective, I believe the market is actually forming a bottom, and I’m quite optimistic about the future—especially when it comes to the price of BTC and other major coins.
That said, I’d advise anyone looking to trade meme tokens during this time to be very cautious about volatility. The correlation between meme tokens and BTC—or other mainstream assets—has diverged significantly.