
Animoca Brands co-founder and executive chairman Yat Siu expects continued growth through 2025 due to a more crypto-friendly regime in the US.
Dig Deeper, Invest Smarter

Animoca Brands co-founder and executive chairman Yat Siu expects continued growth through 2025 due to a more crypto-friendly regime in the US.

Tron founder Justin Sun has renewed his accusations against First Digital Trust (FDT), claiming the firm moved $500 million in customer funds to banks in Dubai.
In a May 3 post on X, Sun claimed the money was spread across multiple institutions, including Mashreq Bank, Emirates NBD, Abu Dhabi Islamic Bank (ADIB), and EFG.
Sun also named several individuals he believes were involved in authorizing or facilitating the transfers. These include Christian Alexander Boehnke, De Lorraine Elbouef, FDT CEO Vincent Chok, Yai Sukonthabhund, Matthew William Brittain, and Cecilia Teresa Brittain.
According to him, these individuals held executive roles at FDT and related entities, which allegedly gave them the authority and access needed to misappropriate customer assets.

Sun’s accusations come as Dubai is positioning itself as a global center for crypto innovation. Over the past years, the authorities have introduced several pro-crypto initiatives that have drawn international attention and investment.
Against this backdrop, Sun urged local banks, regulators, and government bodies to take immediate steps to investigate the transfers and freeze any suspicious inflows.
He also pushed for internal audits, public disclosures of any anomalies, and active cooperation from the institutions involved.
“I once again urge the Dubai government, regulators, and banks to act swiftly and decisively. Dubai must not become a safe haven for fraud and money laundering. Banks must conduct internal reviews, freeze suspicious inflows immediately, and report them proactively. Do not become enablers of criminal activity,” Sun stated.
These accusations add to a growing dispute between Sun and the Hong Kong-based custodian.
Last month, he compared the alleged embezzlement at FDT to the FTX scandal, calling it “far worse” because it did not involve a loan collateral structure or user approval.
Sun has launched a $50 million bounty program to support investigations, uncover further details, and hold those responsible accountable. He has also launched a dedicated website to expose the alleged scam.
FDT has denied all accusations and filed a defamation lawsuit against Sun. Meanwhile, Hong Kong regulators have started reviewing local trust companies’ conduct in light of the allegations.
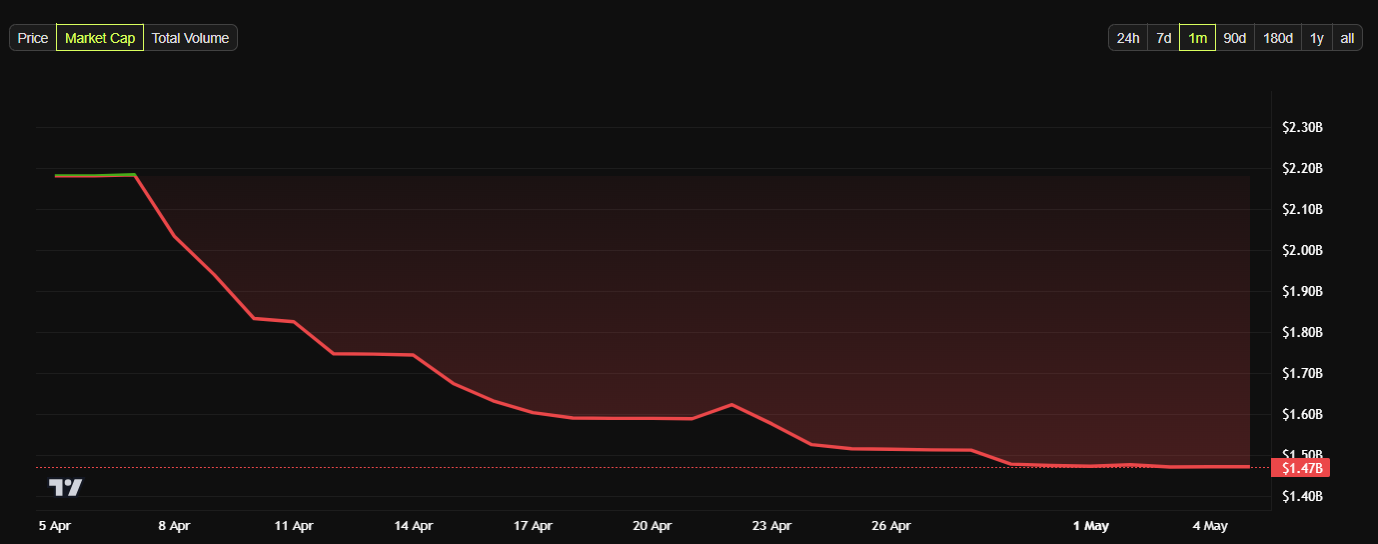
Since the dispute began, the market capitalization of FDT’s FDUSD stablecoin has plunged. According to BeInCrypto data, the stablecoin’s market cap had dropped from over $2.5 billion to around $1.4 billion as of press time.
The post Justin Sun Accuses First Digital Trust of Misusing $500 Million via Dubai Banks appeared first on BeInCrypto.
Crypto and TradFi markets had a strong opening today, as Bitcoin briefly jumped 5% due to optimism about a tariff deal. China and institutional investors in the US wish to avoid a trade war if possible.
Despite these encouraging signs, no deal has actually been reached, and Bitcoin also suffered subsequent losses. The whole market is in a state of flux until the situation becomes more clear.
The crypto markets are full of fear right now, and it’s difficult to determine a safe bet moving forward. Since the market suffered huge liquidations yesterday, it opened with cautious optimism today.
This trend was particularly influenced by Bitcoin, which briefly jumped around 5% due to hopes about a potential deal on Trump’s tariffs.
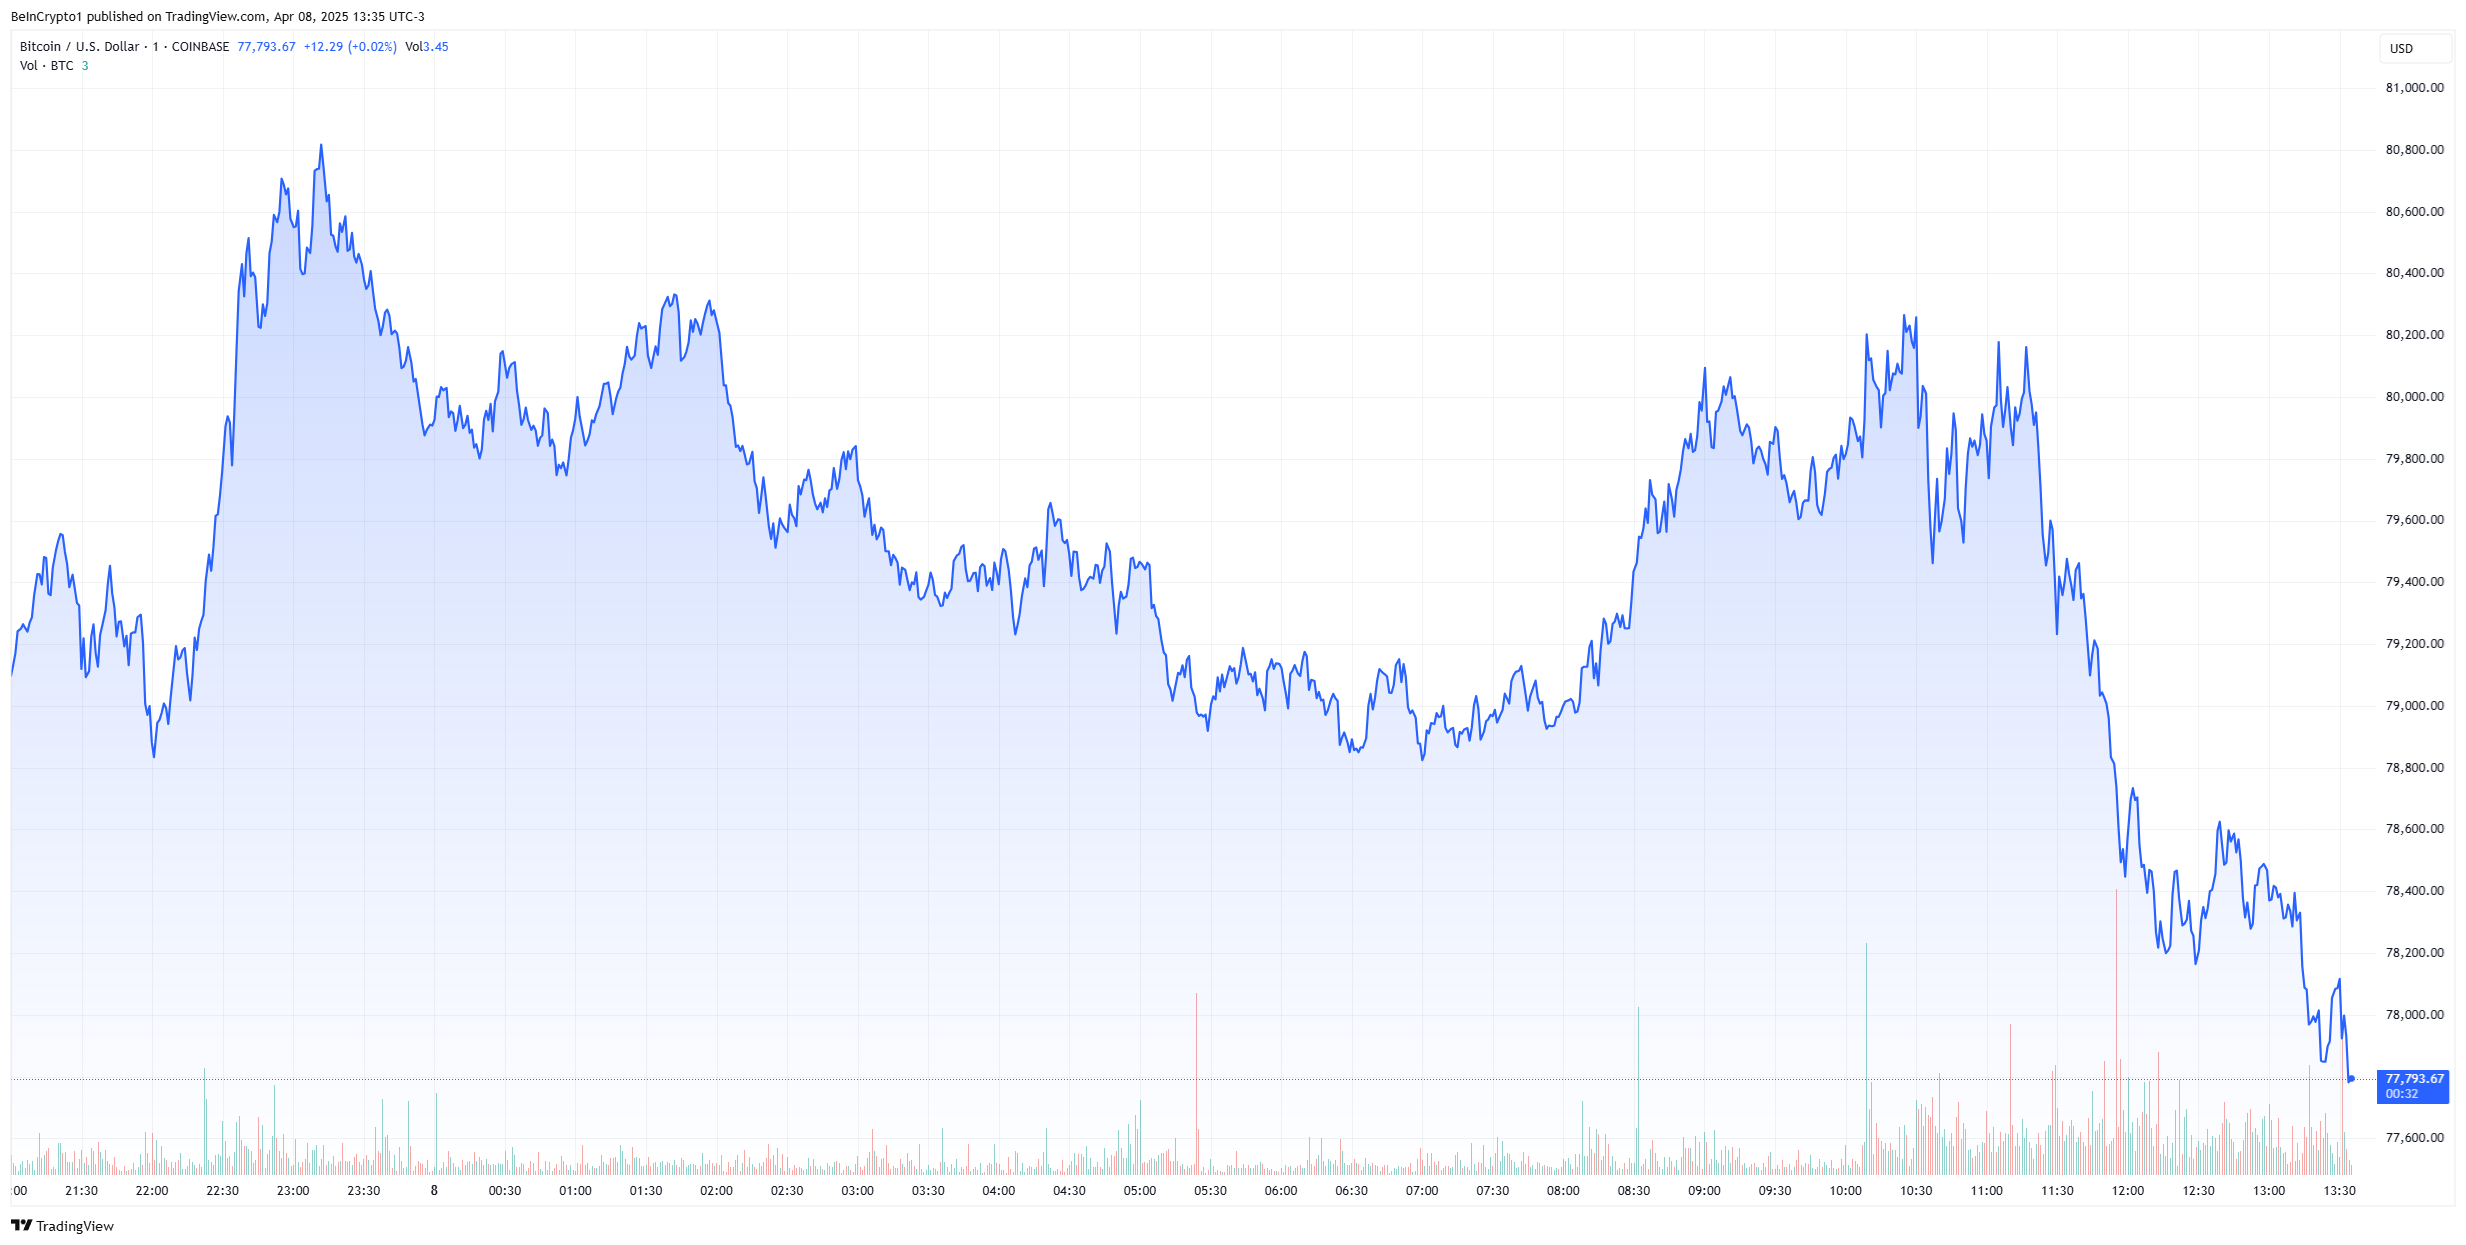
The price of Bitcoin has fluctuated wildly due to the tariffs as speculation about a sell-off increases. However, the whole market is in a chaotic state right now.
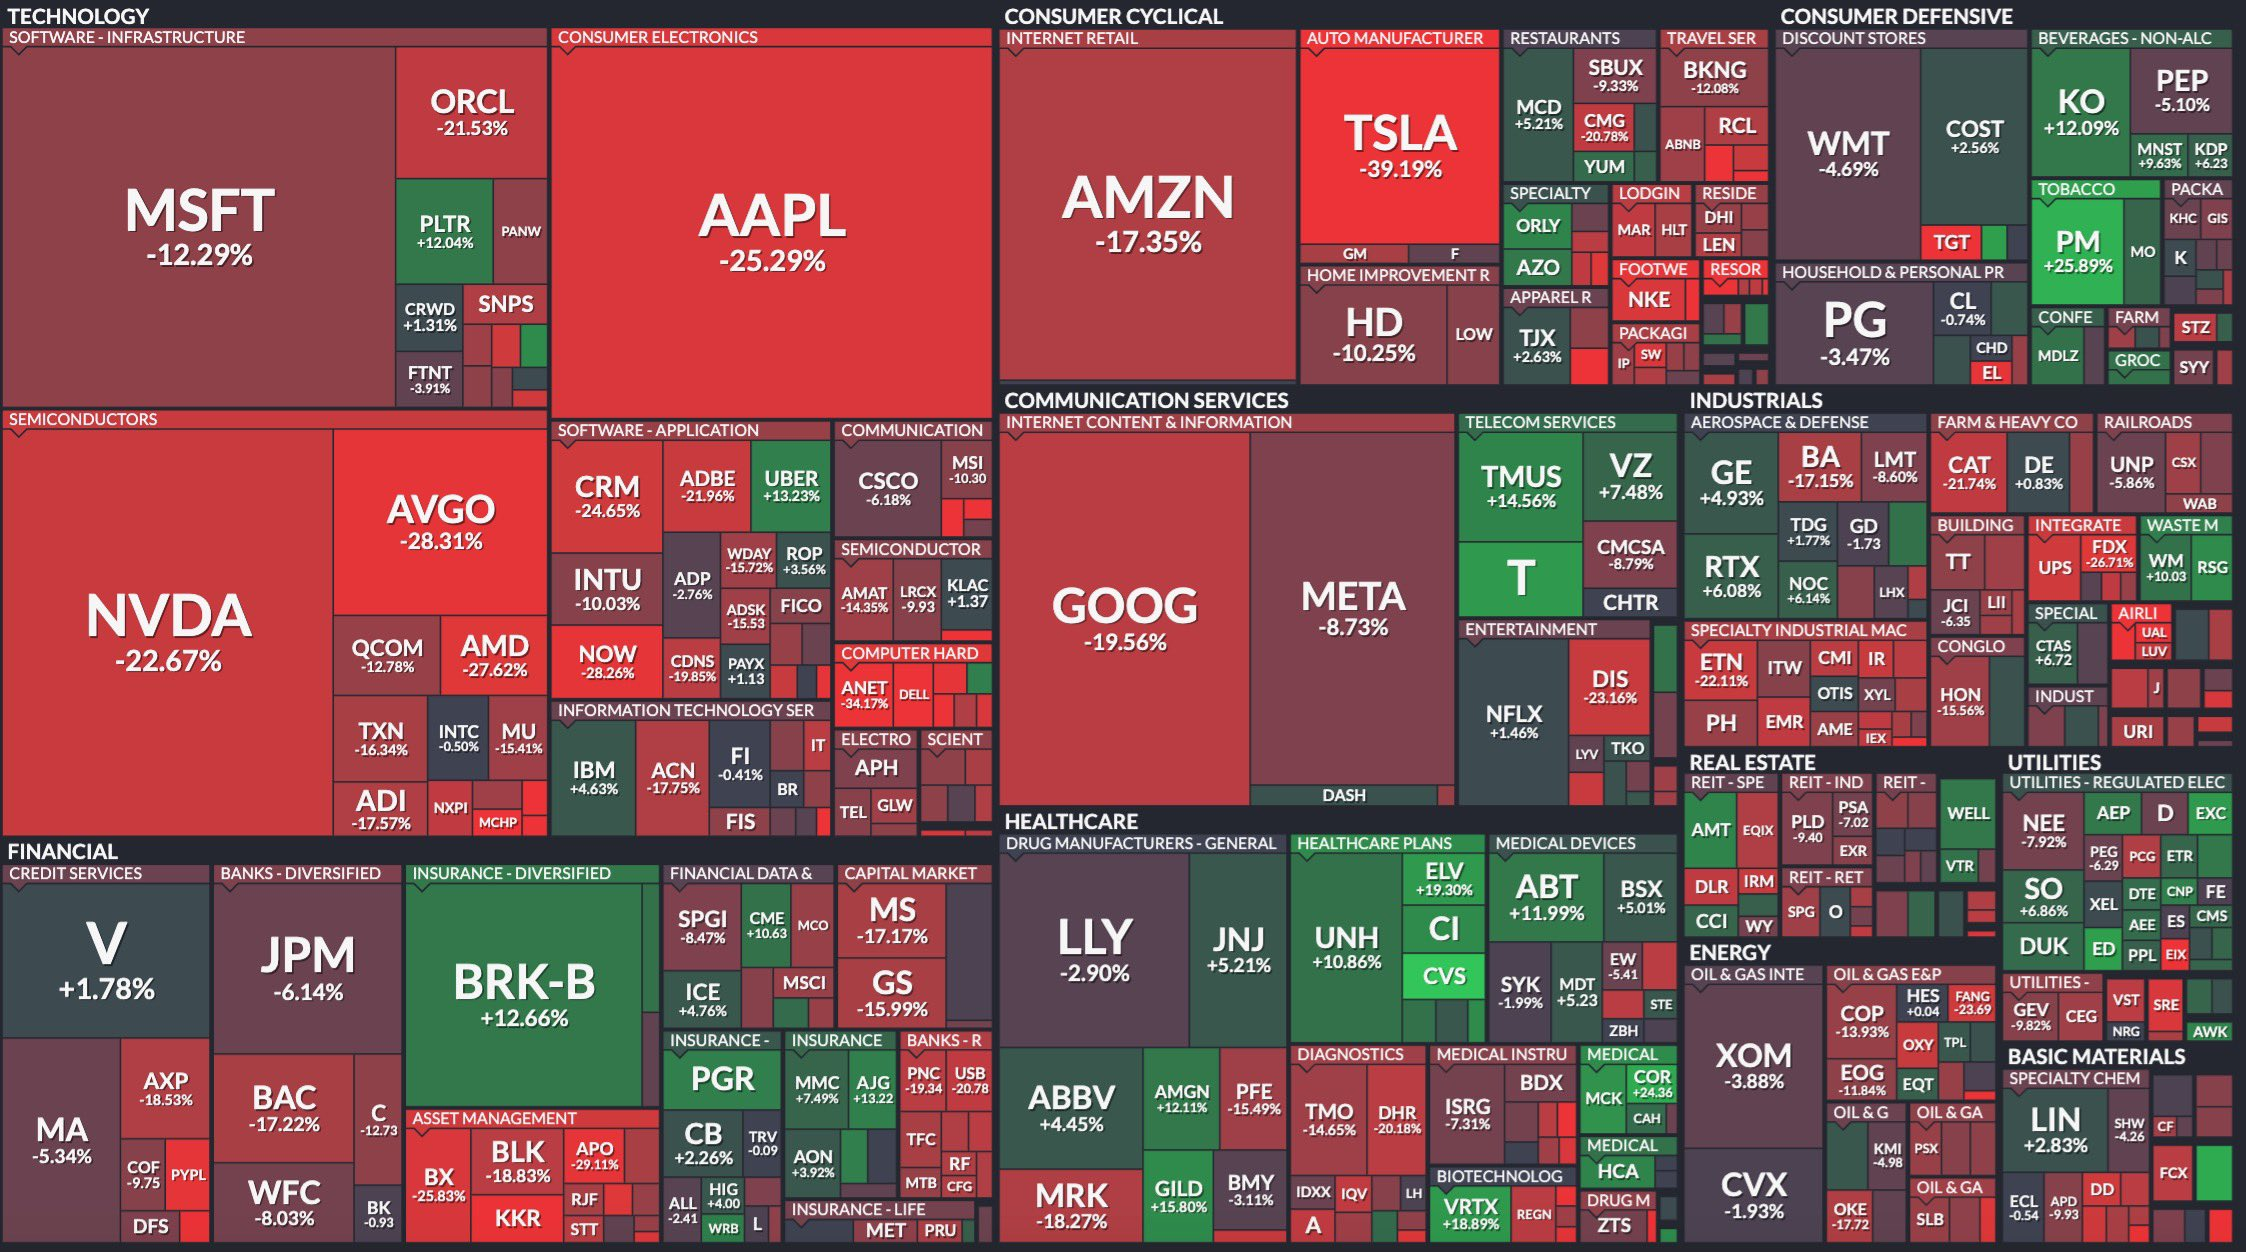
Today, the Dow Jones Industrial Average surged 1,285 points, or 3.4%, while the S&P 500 and Nasdaq Composite both jumped 3.4% and 3.3%, respectively. Nonetheless, hundreds of stocks have fallen 20% or more.
Meanwhile, Bitcoin has a few advantages that can protect it from tariff volatility. For example, a recent report from Binance Research claims that the least risky cryptoassets are the most insulated from drops.
This includes RWAs and centralized exchanges, but Bitcoin is a close third.
Furthermore, the markets are very optimistic about a deal to avoid the tariffs. Yesterday, rumors of a pause triggered a trillion-dollar rally, highlighting traders’ desperation for good news.
Despite the retaliatory tariffs, China is similarly eager to avoid a full-blown trade war with the US. Trump claimed that he is making progress with China and South Korea, fueling optimism.
Nonetheless, it’s important not to overstate Bitcoin’s chances of success under tariffs. Despite the hopes on both sides of the Pacific, China confirmed that it’s prepared to fight a trade war if Trump forces its hand.
This might explain Bitcoin’s price drops despite its strong performance since yesterday. Ultimately, all we can do is wait and hope.
The post Bitcoin and US Stock Markets Hinge on Trump-China Tariff Deal Hopes appeared first on BeInCrypto.
Bitcoin ETF outflows have nearly amounted to $750 million in the last two days as the crypto market consistently fell. BlackRock, the largest issuer, has offloaded around 2,000 BTC in the previous 24 hours.
Together, the ETF issuers sold off enough BTC that they collectively hold less than Satoshi. They surpassed him three months ago and continued buying huge amounts of Bitcoin, indicating truly massive sales.
Since the Bitcoin ETFs first got SEC approval last year, they’ve had a transformative impact on the market. Lately, however, they’ve been turning bearish.
Towards the end of February, the market saw $2.7 billion in outflows, and this trend continued. The last four consecutive weeks had outflows, and the market already lost nearly $750 million this week alone.
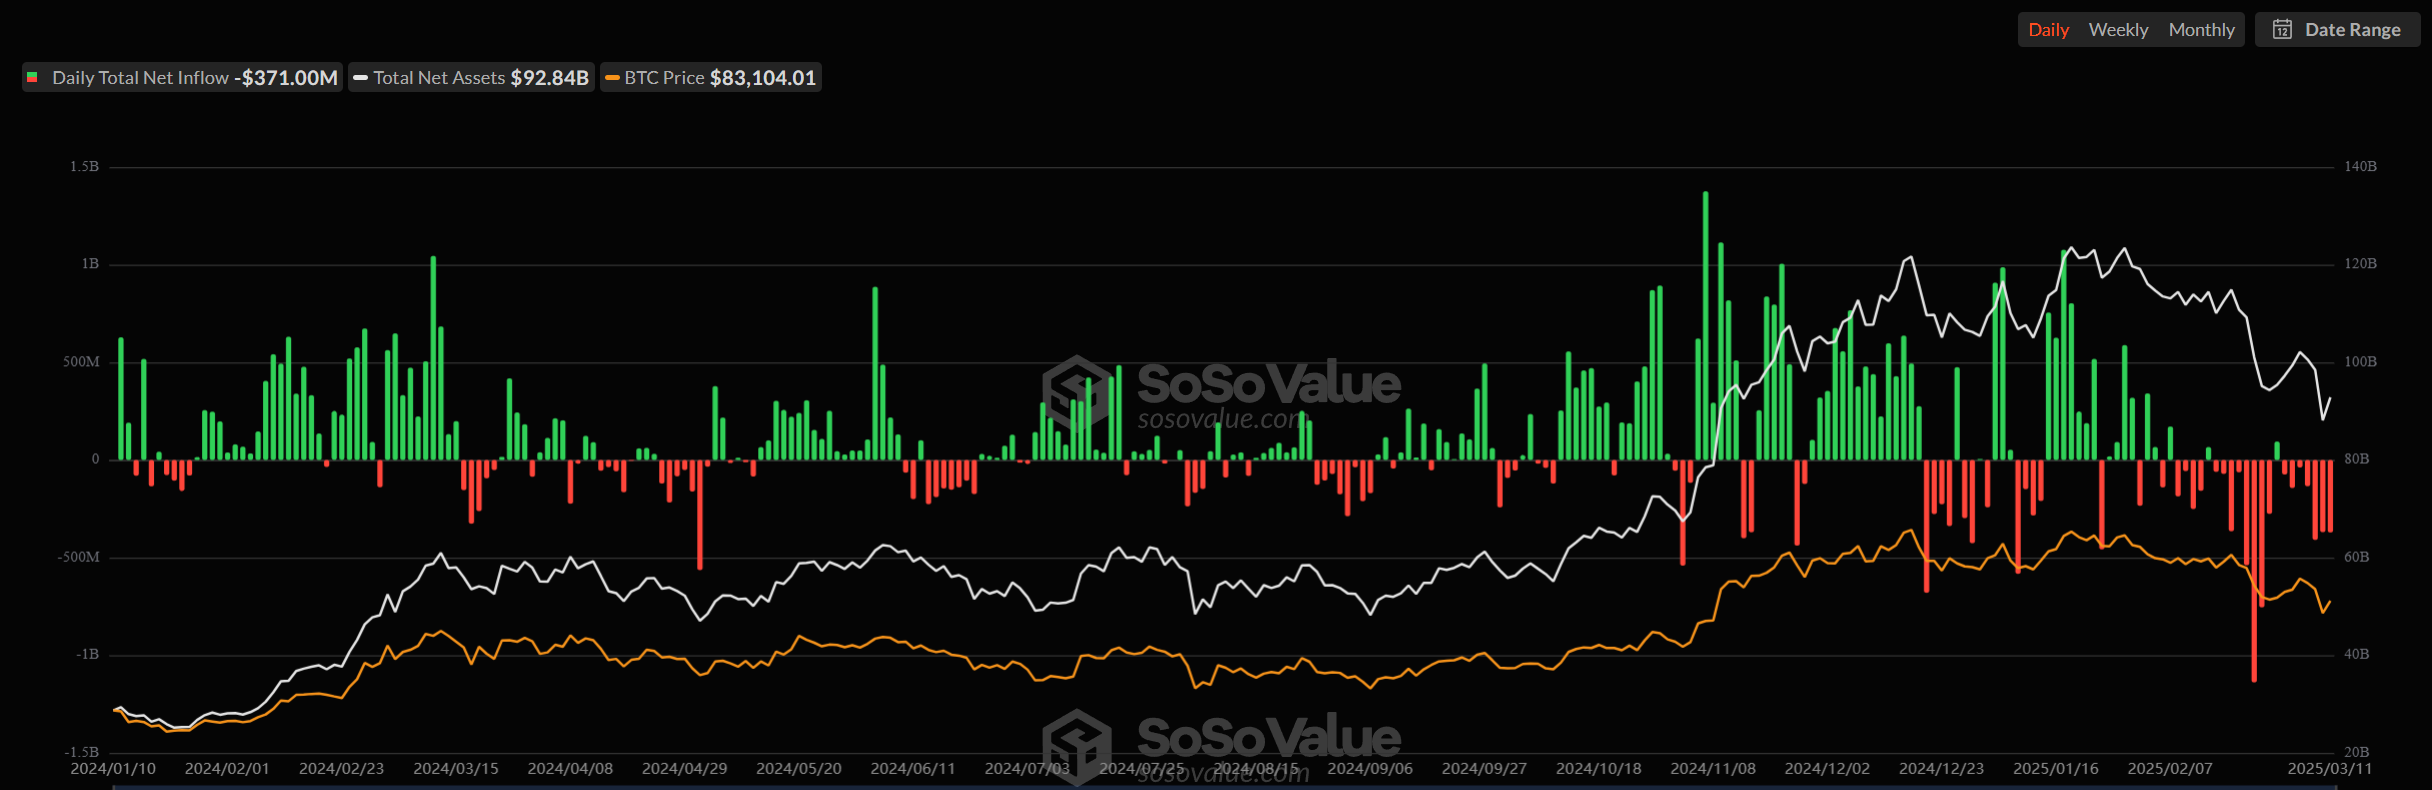
This marks the seventh consecutive day of outflows for this ETF market. IBIT, BlackRock’s product, led these losses with $151 million in the last 24 hours.
In mid-February, some analysts began speculating that BlackRock would begin selling its Bitcoin, and ETF analyst Shaun Edmondson noticed how large of a trend it’s becoming:
“I know the markets are very ‘risk off’ at the moment with the Tariff uncertainty, but this is yet another outflow day from the US Spot ETFs, collectively now falling below Satoshi again. Given the bullish narrative from the SEC, Strategy raising 21 billion, State [Bitcoin Reserve] race and National [Bitcoin Reserve] bill, I find this a little surprising,” Edmondson claimed.
BlackRock alone has offloaded around 2,000 BTC since Edmondson posted yesterday’s daily tallies. It’s unclear how far the ETF issuers want to take this trend, but these Bitcoin sales are very concerning.
These issuers surpassed Satoshi’s Bitcoin holdings in December, so these outflows have already eaten up three months’ worth of vociferous purchasing.
Still, despite this ETF pessimism, Bitcoin’s actual price could be doing a lot worse. The entire crypto market has been hit with massive outflows, and BTC fell accordingly.
However, the US CPI report this morning was better than anticipated, which allowed Bitcoin a little breathing room. It’s anyone’s guess, however, how long this reprieve will actually last.
The post US Bitcoin ETF Holdings Fall Below Satoshi As Outflows Continue appeared first on BeInCrypto.