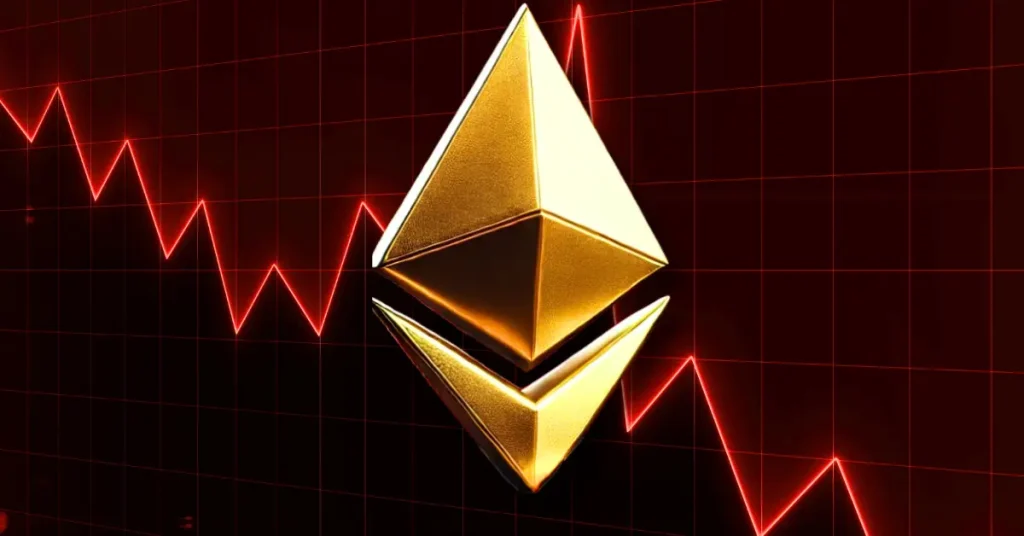
The crypto markets are healing after the trade war losses that wiped out billions from the space. While Bitcoin surged above $93,000, the Ethereum price made a more intense leap of over 10% in the past 24 hours and is trying to secure the newly gained support at $1800. Soon after the second-largest token displayed strength, the whales jumped in and intensified their activity, which created a huge volatility.
As per some reports, an ETH whale bought nearly 20,000 ETH worth nearly $34.7 million.
On the other hand, another whale withdrew over 12,000 ETH from Binance, which raised the suspicion of a potential drop. However, the selling pressure does not seem to have mounted, hinting towards the price maintaining a continued upswing for the rest of the week.
The ETH price rose but failed to rise above the 50-day MA at $1830 as the bears extracted some of the profits. Meanwhile, the conversion and base lines have triggered a bullish crossover; the cloud suggests the token remains under bearish influence. Hence, the price may continue to remain consolidated within a small range while the bulls are trying hard to defend the support at $1770.
The ETH price is currently trading just below $1800 at $1797, while the gains have dropped below 10%. There is a strong resistance at $1860, and if it is overcome, then the token may try for $2000. Meanwhile, if the price drops to the support area of $1750, it may face a correction below $1700.
Bitcoin might be on the edge of a massive breakout, at least, that’s what crypto analyst Timothy Peterson believes. Based on key market signals, he says Bitcoin could reach $135,000 in just 100 days, and the reasons behind this are worth a closer look.
What Does the VIX Have to Do with Bitcoin?
At the center of Peterson’s prediction is the VIX, a volatility index that tracks how uncertain investors are about the market. When it spikes, it usually means fear is high.
The 4 Things I’m Watching that Point to Bitcoin New ATH in 100 Days.
In order of least important to most important. (Day 3, continued tomorrow) $VIX and Volatility. I described this here: https://t.co/k0YFtsc0ft
In April, the VIX closed above 56, something that’s happened only twice in modern history, during the 2008 financial crash and the 2020 COVID market panic. In both cases, what followed was a strong bounce back, especially for tech stocks like those in the NASDAQ.
Peterson noticed that after a VIX spike, the NASDAQ gained around 10% in the first week, then soared by another 40% over the next 100 trading days.
Bitcoin Is Acting Like a Tech Stock
What’s surprising is that Bitcoin seems to be moving in a similar pattern to the NASDAQ’s historical rebound. Peterson says the data shows Bitcoin is tracking the NASDAQ’s recovery with 95% accuracy, a striking similarity.
But since Bitcoin is more volatile, the impact could be bigger. If market fear (VIX) continues to drop, especially below 18, which is seen as a “risk-on” zone, Peterson predicts Bitcoin could hit $107,000 in a few weeks and rise to $135,000 within 100 days.
As of now, Bitcoin price is trading around $96,296, reflecting a drop of 0.51% with a market cap hitting $1.9 trillion. Looking at the price chart, Bitcoin formed a “local bottom” between February and April 2025. It also stayed above a key line called the Kijun, strengthening the trend.
Bitcoin’s price action shows it may be ready for a breakout. If it stays above $95,800, expect more upside soon.
Never Miss a Beat in the Crypto World!
Stay ahead with breaking news, expert analysis, and real-time updates on the latest trends in Bitcoin, altcoins, DeFi, NFTs, and more.
The post Bitcoin To Hit $135k in 100 Days? Here’s Why Top Analyst Thinks So appeared first on Coinpedia Fintech News
Bitcoin might be on the edge of a massive breakout, at least, that’s what crypto analyst Timothy Peterson believes. Based on key market signals, he says Bitcoin could reach $135,000 in just 100 days, and the reasons behind this are worth a closer look. What Does the VIX Have to Do with Bitcoin? At the …
Bitcoin recently broke above the $111,000 mark, setting a new all-time high. However, data across major exchanges suggests that traders are growing increasingly wary of a sustained rally.
CoinGlass data indicate that over 53% of Bitcoin positions are currently short, meaning a majority of traders are betting on a price drop. By contrast, just 47.43% of active positions are long.
Most Traders Turn Bearish Despite Bitcoin’s Recent All-Time High
The pattern is mirrored on Binance, where short trades make up 54.05% of open interest, compared to 45.95% for longs.
The sentiment shift is reinforced by the latest move from prominent crypto whale James Wynn, who reversed his bullish stance after a multi-million dollar loss.
The trader closed his long exposure at a loss of $13.39 million, with liquidation unfolding in under an hour on May 25.
He has since opened a short position of 3,523 BTC—valued at approximately $377 million—at an entry price of $107,128. The new trade carries a liquidation threshold near $118,380.
James Wynn Bitcoin Bet on Hyperliquid. Source: X/EmberCN
Market analysts have suggested that Wynn’s pivot reflects broader signs of exhaustion in the current bull cycle.
According to blockchain analytics firm Alhpractal, short-term holders (STHs) have begun distributing coins. Historically, a decline in STH supply often signals that Bitcoin is approaching a local top.
The firm noted that the Short-Term Holder Realized Price currently stands at $94,500, which is the last strong support before losses set in.
Alphractal stated that while Bitcoin previously hit record highs under similar conditions in 2021, it warned that the current cycle may be nearing exhaustion.
It added that several macro indicators and historical halving trends point to a possible correction after October 2025.
Chainlink (LINK) has been showing mixed technical signals recently, with some indicators turning bearish while others suggest a potential upside ahead. With its price up 11% in the last seven days, Chainlink was on its path to surpass Pi Network in market cap, but this could be delayed for now.
With LINK almost not moving in the last 24 hours, its market cap is currently $10.3 billion, and Pi Network is around $12.7 billion. The upcoming days will be crucial as several technical indicators reach critical inflection points that could determine whether LINK continues its rally or faces a correction.
Chainlink DMI Shows Sellers Took Control
According to Chainlink’s DMI chart, its ADX (Average Directional Index) has decreased from 26 yesterday to 20.46 today. This decline indicates weakening trend strength regardless of direction.
ADX is a component of the Directional Movement Index (DMI) that quantifies trend strength on a scale of 0-100, without indicating direction. Generally, readings above 25 suggest a strong trend, 20-25 indicate a developing trend, and below 20 reflect a weak or absent trend.
Chainlink’s ADX moving from above 25 to just above 20 signals that the previous strong trend is losing momentum and shifting toward a more neutral or ranging market.
The Positive Directional Indicator (+DI) has fallen significantly from 33.3 to 20.1, while the Negative Directional Indicator (-DI) has increased from 14.2 to 21. This crossover, with -DI now exceeding +DI, suggests a potential shift from bullish to bearish momentum.
Combined with the weakening ADX, this technical picture points to a likely bearish reversal or continuation pattern forming for LINK’s price. Traders might anticipate further downside pressure in the near term, though they should monitor for stabilization or reversal signals as the trend weakens.
LINK BBTrend Is Now Positive After Staying Negative For Several Days
LINK’s BBTrend has now turned positive, reaching 3.69 after remaining in negative territory since March 4. A significantly negative reading of -20 was recorded on February 28.
The BBTrend (Bollinger Bands Trend) indicator is a momentum oscillator that measures the relationship between price and Bollinger Bands to identify trend strength and direction. It calculates how price is moving relative to the Bollinger Bands, which themselves represent standard deviations from a moving average.
When BBTrend is positive, it suggests prices are moving above the middle band and potentially toward the upper band, indicating bullish momentum.
Conversely, negative readings suggest bearish pressure with prices moving below the middle band toward the lower band. The recent shift to a positive 3.69 BBTrend value for LINK could signal emerging bullish momentum after a period of downward pressure.
This reversal, coming after an extended negative period that bottomed at -20, might indicate a meaningful change in market sentiment.
However, traders should confirm this signal with other indicators, as the relatively modest positive reading of 3.69 suggests the bullish momentum is still developing rather than strongly established.
Will Chainlink Go Back To $20 In March?
LINK EMA (Exponential Moving Average) lines are currently trending downward, potentially forming a death cross in the near future.
If this bearish pattern materializes and Chainlink price breaks below the critical support level at $15.79, we could see further downside movement.
In this scenario, LINK might decline to test psychological and technical support levels at $14 and potentially even $13.45, representing significant drops from current prices.
Conversely, the recent positive shift in BBTrend suggests growing buying pressure may be building. If this bullish momentum continues to strengthen, LINK could challenge the immediate resistance at $17.64.
A decisive break above this level would open the path to test higher resistance zones at $19.79 and, subsequently, $22.31. In a strongly bullish scenario where upward momentum accelerates, Chainlink could potentially reach $26.4, which would mark its first time trading above $25 in over a month.
This technical setup presents a clear inflection point for LINK, with convincing breaks of either the support at $15.79 or resistance at $17.64, likely determining the next significant price movement.