Pi Network (PI) is trading in the green today, July 3, amid a recovery across the broader crypto market. At press time, Pi Network price stood at $0.50 with a modest 1.63% increase in 24 hours. Despite these gains, bearish pressure is still facing this altcoin after it formed a bear flag pattern ahead of
According to the latest reports from Reuters, the exchange had prior knowledge of the data breach but delayed public disclosure, sparking concerns about transparency and security practices. Coinbase suffered a major data breach last month, exposing sensitive customer information, including names, addresses, and phone numbers. Coinbase Hack: Prior Knowledge & Delayed Disclosure Raise Concerns In a surprising revelation, Reuters reported that Coinbase had prior knowledge of a customer data leak as early as January. This raises questions about the company’s delayed public disclosure. According to Coinbase’s SEC filing, the company was aware that contractors had accessed unnecessary data in the “previous months”. The company added that they didn’t know that it was part of the larger operation until they received an extortion demand on May 11. On May 15, as CoinGape reported, Coinbase revealed a significant hack that involved the stealing of personal information of high-profile users like Sequoia Capital’s… Read More at Coingape.com
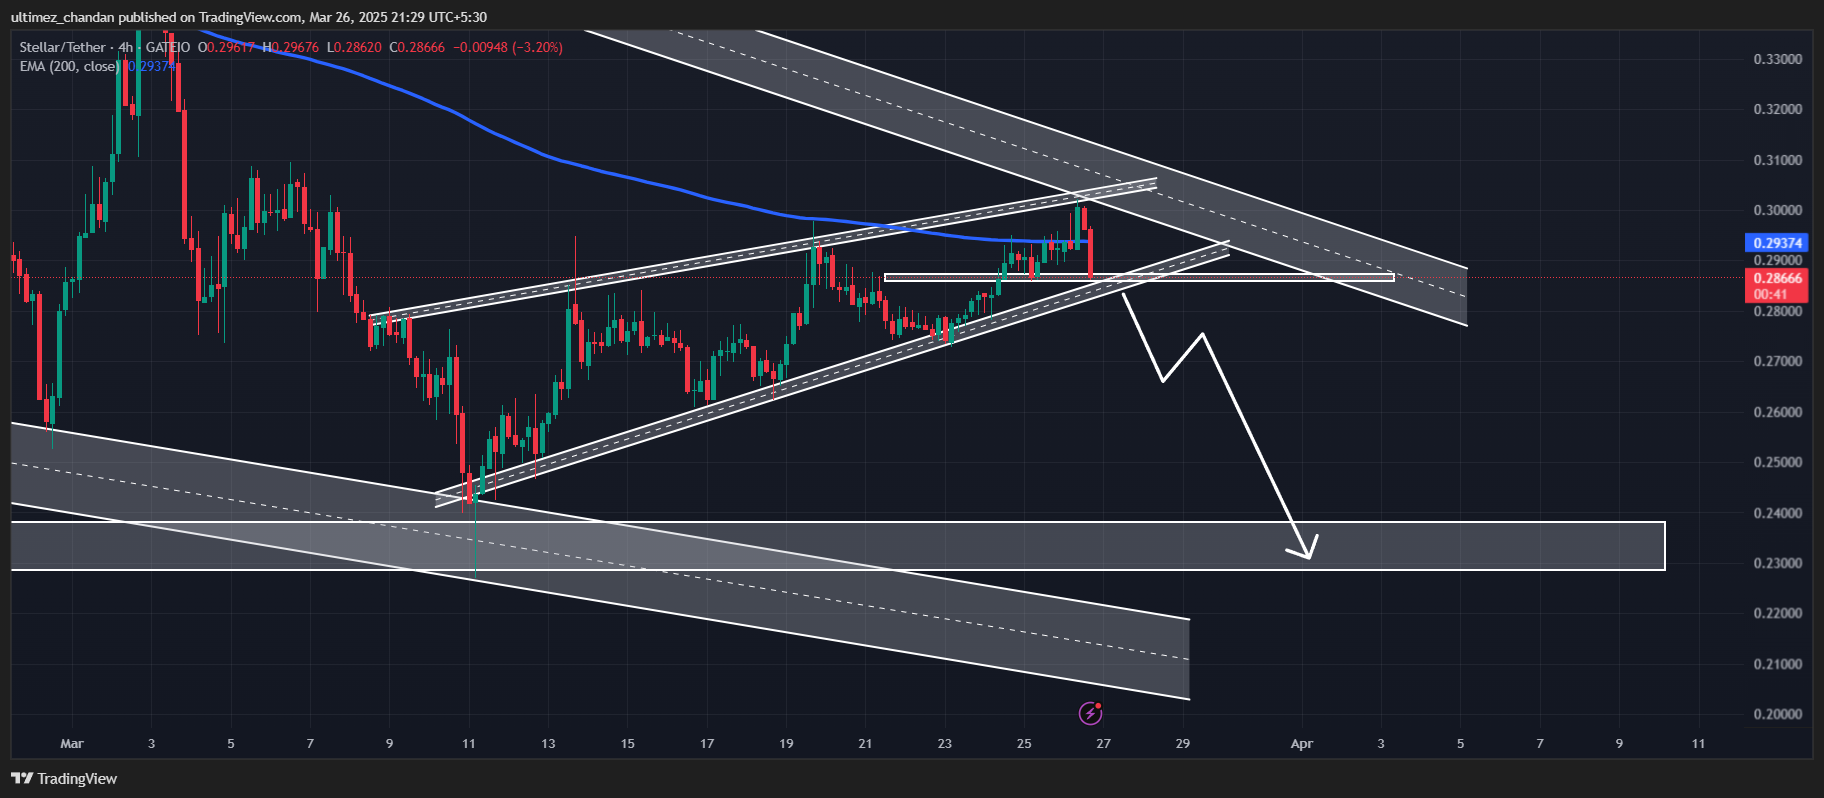
In the ongoing market uncertainty, Stellar’s native token, XLM, appears bearish and is poised for a price decline due to the bearish price action it has formed on the four-hour timeframe. At the beginning of March 2025, XLM experienced impressive upside momentum, but it later formed a bearish rising wedge pattern.
XLM Technical Analysis and Upcoming Levels
According to expert technical analysis, the asset is currently experiencing a price decline and is at a crucial support level. Based on recent price action and historical patterns, if XLM fails to hold the $0.288 level and closes a 4-hour candle below it, the price could decline by 15% to reach the $0.23 level in the coming days.
In addition to this bearish pattern, XLM’s price began falling after hitting a descending trendline with a strong history of price reversals. However, the asset has formed a bearish engulfing candlestick pattern, which is pushing XLM’s price lower.
Source: Trading View
Current Price Momentum
At press time, XLM is trading near $0.288 and has recorded a 2% price drop in the past 24 hours. Despite the decline, its trading volume has spiked by 25%, indicating increased participation from traders and investors compared to previous days.
Bearish On-Chain Metrics
This bearish price action has been further reinforced by recent activity from whales and long-term holders, as reported by the on-chain analytics firm Coinglass.
$1.40 Million Worth of XLM Inflow
Data from spot inflow/outflow reveals that exchanges have witnessed an inflow of over $1.40 million worth of XLM tokens in the past 24 hours, suggesting a potential sell-off by these holders, which could lead to a price decline in the future.
$3.30 Million Worth of Bearish Bet
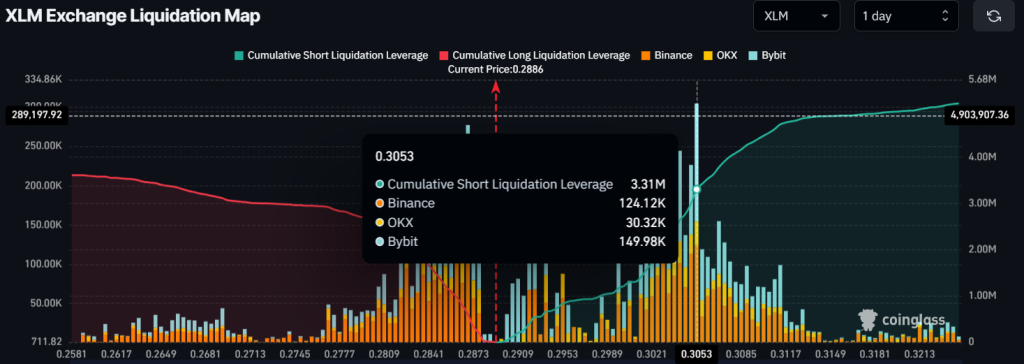
In addition to the activity of long-term holders, traders are also following the bearish market sentiment, as they are strongly betting on the downside. Data shows that traders are currently over-leveraged at $0.305 on the upper side and $0.286 on the lower side, both on the verge of liquidation. At these levels, traders have built $3.30 million and $611K worth of short and long positions, respectively.
Source: Coinglass
When combining all these on-chain metrics with technical analysis, it appears that bears are currently dominating, and XLM’s price could see a further decline in the coming days.
The post XLM Price Crash Incoming? Bearish Pattern Spotted appeared first on Coinpedia Fintech News
In the ongoing market uncertainty, Stellar’s native token, XLM, appears bearish and is poised for a price decline due to the bearish price action it has formed on the four-hour timeframe. At the beginning of March 2025, XLM experienced impressive upside momentum, but it later formed a bearish rising wedge pattern. XLM Technical Analysis and …
The XRP price slumped in the first quarter even after some notable Ripple news, including the end of the SEC case and its ecosystem growth. Ripple was trading at $2.2 on April 1, down by 35% from its highest level in 2025. There is a risk that the XRP coin will crash soon, even as the Ripple USD (RLUSD) volume to total value locked (TVL) jumped.
Ripple USD (RLUSD) Volume to TVL Has Jumped
One of Ripple’s strategies to grow its ecosystem has been the launch of RLUSD, a regulated stablecoin. Ripple hopes that its regulation and transparency will help to dethrone Tether and USD Coin.
Recent data shows that RLUSD stablecoin is still a small player in the stablecoin industry. It has a market cap of over $243 million, a tiny amount in an industry valued at over $237 billion.
However, a closely watched metric shows that RLUSD is in a good place. It has a volume-to-total value locked (TVL) of 37%. This figure is much higher than that of other stablecoins. For example, USDC has a ratio of 14.26%, while Tether is slightly behind at 34.5%.
RLUSD Stats
A higher ratio means that RLUSD holders use it to handle daily transactions. It also means that a higher liquidity is provided to facilitate trading. A stablecoin with a low ratio means that it is not being used.
RLUSD has become the biggest player in the XRP Ledger network, with the other notable players being Sologenic, Crypto Trading Fund, Coreum, and XRP Army.
XRP price has also lagged despite other bullish catalysts. The SEC has ended its Ripple case, while many companies have applied for a spot XRP ETF. Further, Ripple is working to become the best alternative to SWIFT, a network that handles billions of dollars each day.
XRP Technical Analysis Points to a Potential Crash
While Ripple has some solid fundamentals, there is a risk that it will have a strong downtrend in the coming weeks. There is a risk that the XRP price is about to form a death cross pattern as the spread between the 50-day and 200-day Weighted Moving Averages (WMA) narrows. A death cross is a highly risky pattern in technical analysis.
The other risk is that the Ripple price has formed a head and shoulders pattern, whose neckline is at around $2. This price coincides with the 50% Fibonacci Retracement, which is drawn by connecting the lowest point in 2024 and highest level this year.
XRP Price Chart
XRP Price Targets
Therefore, a drop below this neckline will be a victory for bears, who will trigger panic selling. More downside will push the token downwards, potentially to the $1.5, the 61.8% Fibonacci Retracement level.
The bearish Ripple price forecast will be canceled if the coin surges above right shoulder point at $3. Such a move will likely trigger a jump to the YTD high of $3.4, followed by the psychological point at $5.