Ripple’s RLUSD stablecoin has been steadily gaining momentum, emerging as one of the fastest-growing assets in the crypto space.
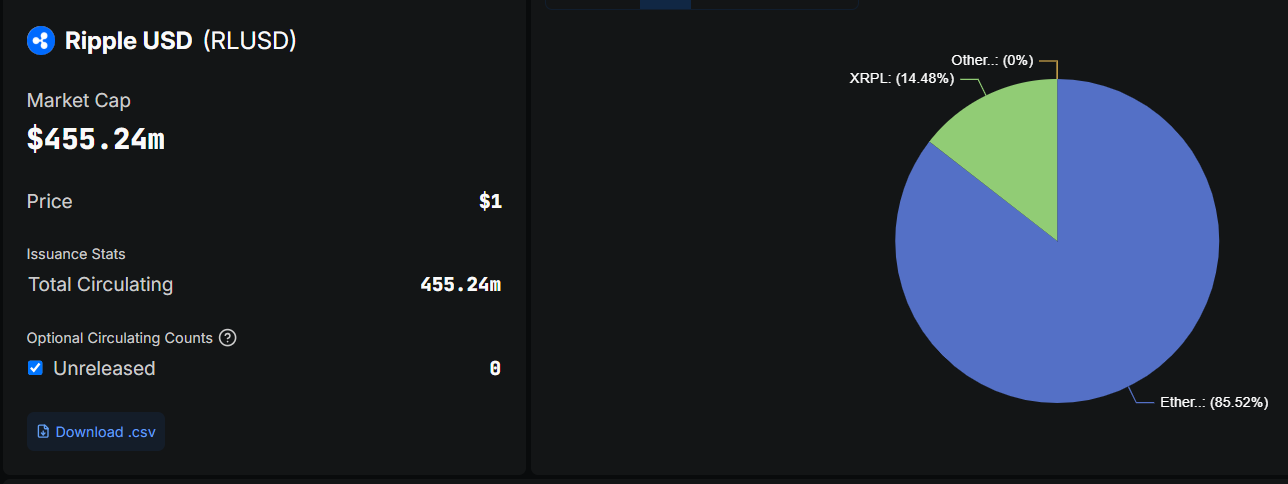
Data from DeFillama reveals that RLUSD’s circulating supply surged by 47% this month, reaching an impressive $455 million in June. This means its supply increased by over $150 million this month.
Ripple RLUSD Gains Ground as Ethereum Supply Quadruples
According to the data, approximately $390 million of RLUSD’s supply is on the Ethereum network, while $65 million resides on Ripple’s XRP Ledger.
Notably, the stablecoin’s supply on Ethereum has grown by nearly four times since January, according to blockchain analytics platform Token Terminal.
After a five-year legal battle, Ripple CEO Brad Garlinghouse announced that the company would drop its cross-appeal. This move signals a possible end to the protracted legal dispute.
In addition to the US legislative advancements, RLUSD has also received approval from the Dubai Financial Services Authority (DFSA), which regulates the Dubai International Financial Centre (DIFC).
This approval allows companies within the DIFC to use RLUSD for various virtual asset services, including payments and treasury management.
The DIFC is home to nearly 7,000 registered businesses and serves as a key financial hub for the Middle East, Africa, and South Asia. This positioning sets the stage for broader adoption of RLUSD across these regions.
Ethereum (ETH) is facing a sharp correction, dropping 11% over the past week as bearish momentum continues to dominate. The Relative Strength Index (RSI) remains weak, showing a lack of strong buying pressure, while the Directional Movement Index (DMI) confirms that sellers are still in control.
Additionally, the Exponential Moving Averages (EMA) are in a firmly bearish structure, suggesting that ETH could soon test critical support levels at $1,756 and potentially fall below $1,700 for the first time since October 2023.
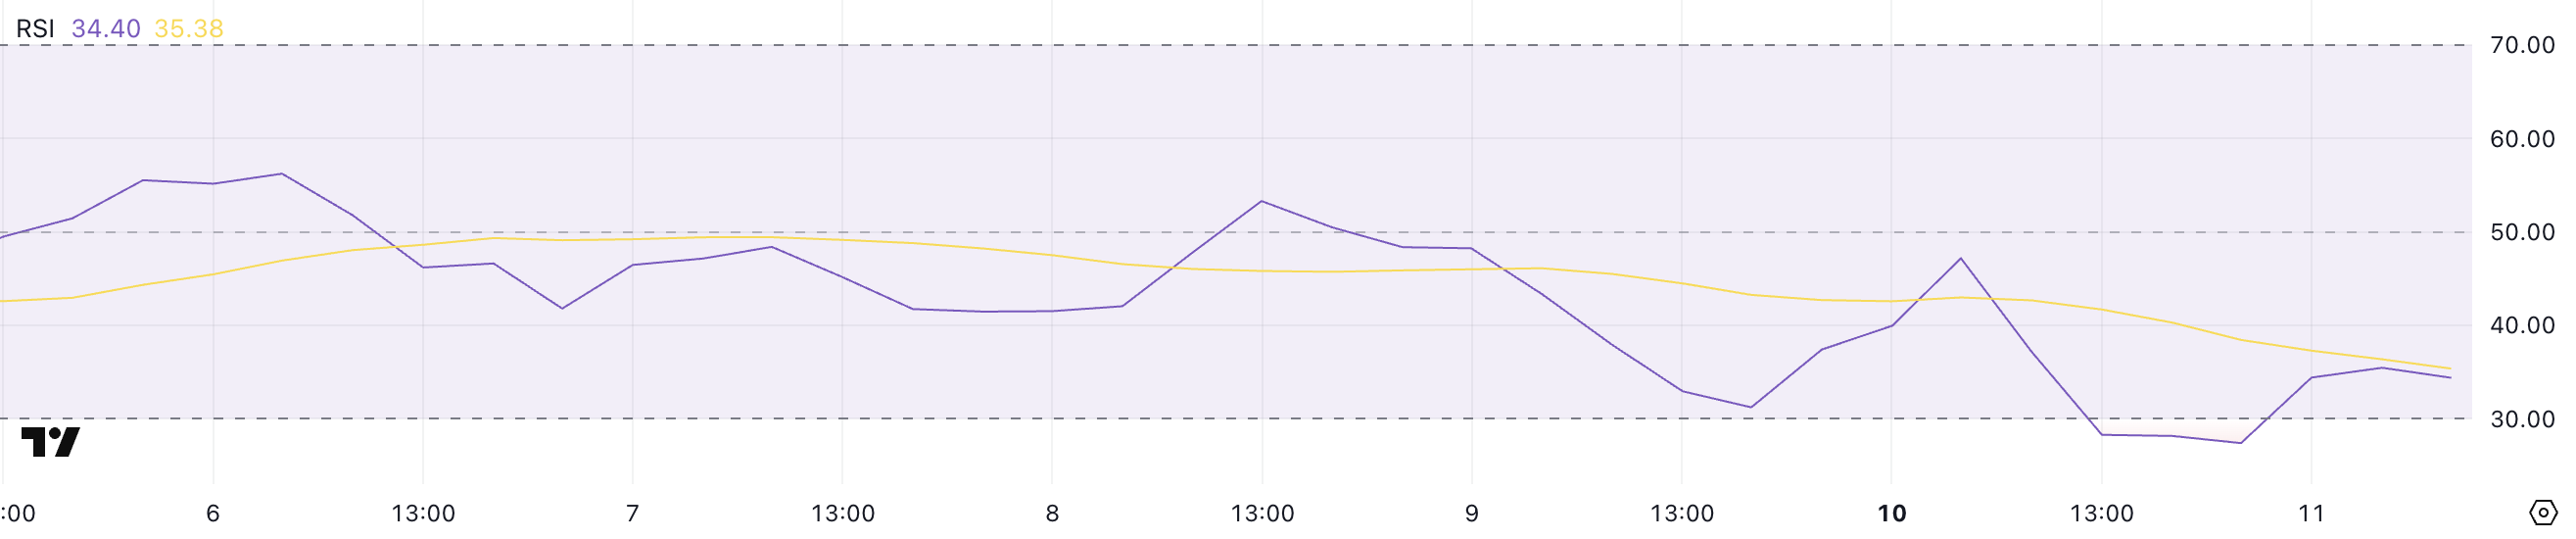
ETH RSI Shows the Lack Of Buying Pressure
Ethereum Relative Strength Index (RSI) is currently at 34.4, recovering slightly after briefly dipping to 27.4 yesterday. The RSI has remained below the 50 mark for three consecutive days, signaling that bearish momentum is still dominant.
The RSI measures the speed and magnitude of recent price changes to assess whether an asset is overbought or oversold.
Typically, an RSI above 70 indicates overbought conditions, suggesting potential for a pullback, while an RSI below 30 signals oversold conditions, implying that selling pressure may be overextended and a bounce could be imminent.
With ETH’s RSI now at 34.4, it suggests that while the asset is still in bearish territory, the extreme selling pressure seen yesterday has eased slightly.
The brief dip below 30 signaled an oversold condition, which often leads to short-term relief rallies. However, for ETH to regain bullish momentum, the RSI would need to climb back above 50, indicating a shift in market sentiment.
Until then, any upward movement could face resistance, and the broader trend remains weak unless sustained buying pressure pushes ETH out of this bearish zone.
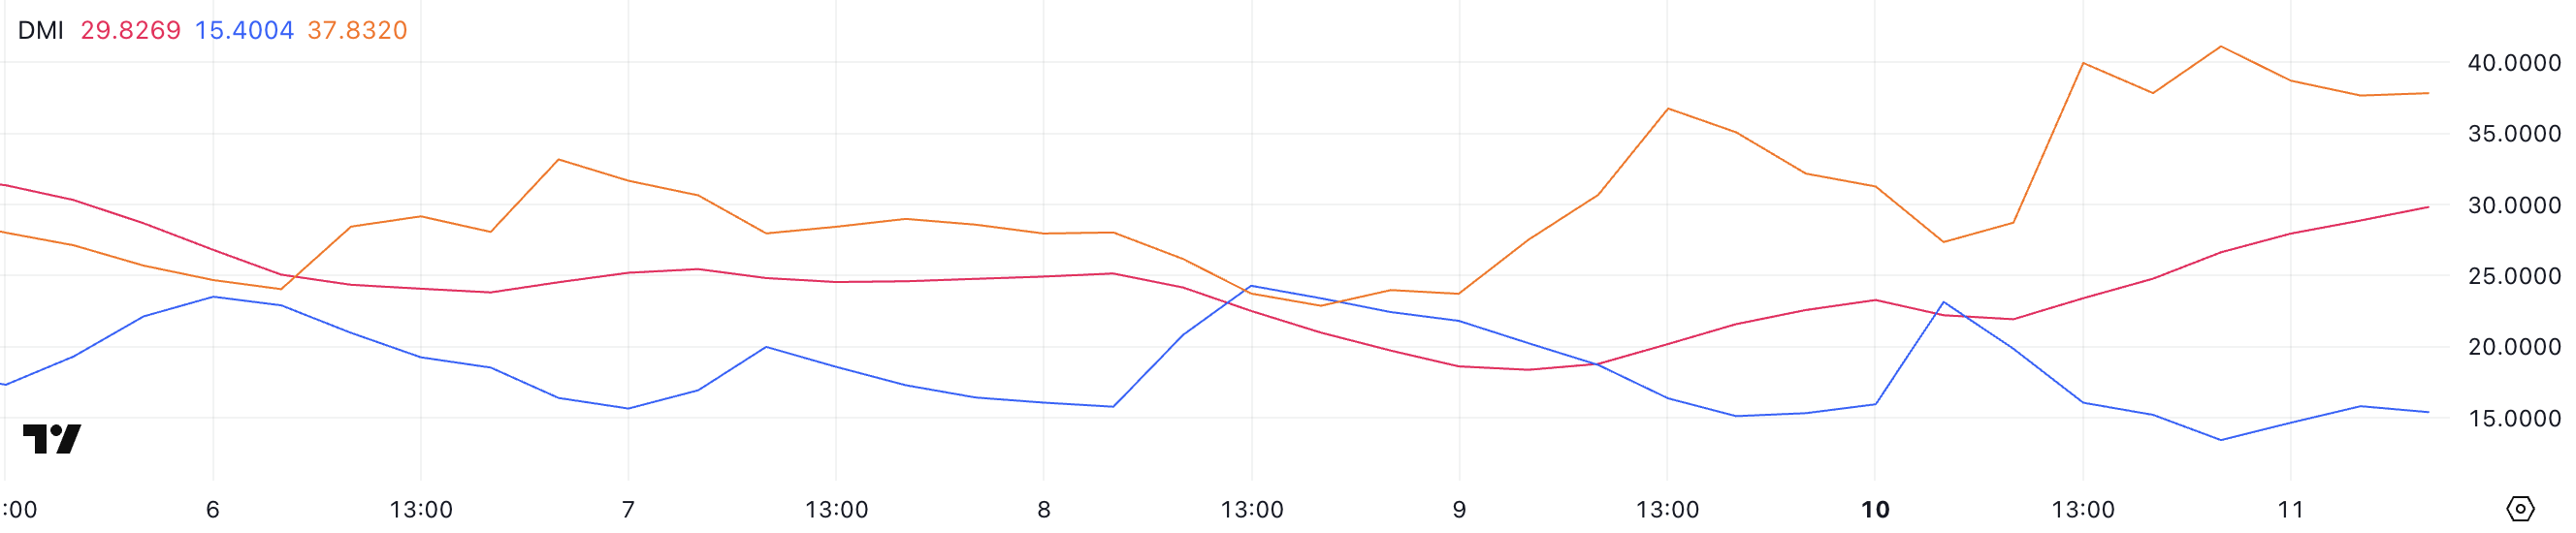
Ethereum DMI Shows The Current Downtrend Is Strong
Ethereum Directional Movement Index (DMI) chart shows that its Average Directional Index (ADX) is currently at 29.82, rising from 21.9 yesterday.
The ADX measures the strength of a trend, with values above 25 indicating a strong trend and readings below 20 suggesting a weak or nonexistent trend. Given the ADX’s sharp increase, it confirms that ETH’s ongoing downtrend is strengthening.
The +DI (positive directional index) has dropped to 15.4 from 23.1 in the past day, while the -DI (negative directional index) has surged to 37.8 from 27.3, reinforcing the dominance of sellers in the market.
With the -DI significantly above the +DI, it signals that bearish momentum is intensifying, and sellers continue to control ETH’s price action.
The decline in +DI suggests that buying pressure is weakening, making it more difficult for ETH to stage a recovery. Unless the +DI begins to rise and crosses above the -DI, ETH’s price is likely to remain under pressure.
Given that the ADX is nearing 30 and still climbing, the downtrend appears well-established, and any short-term relief rallies may face strong resistance before a meaningful trend reversal can occur.
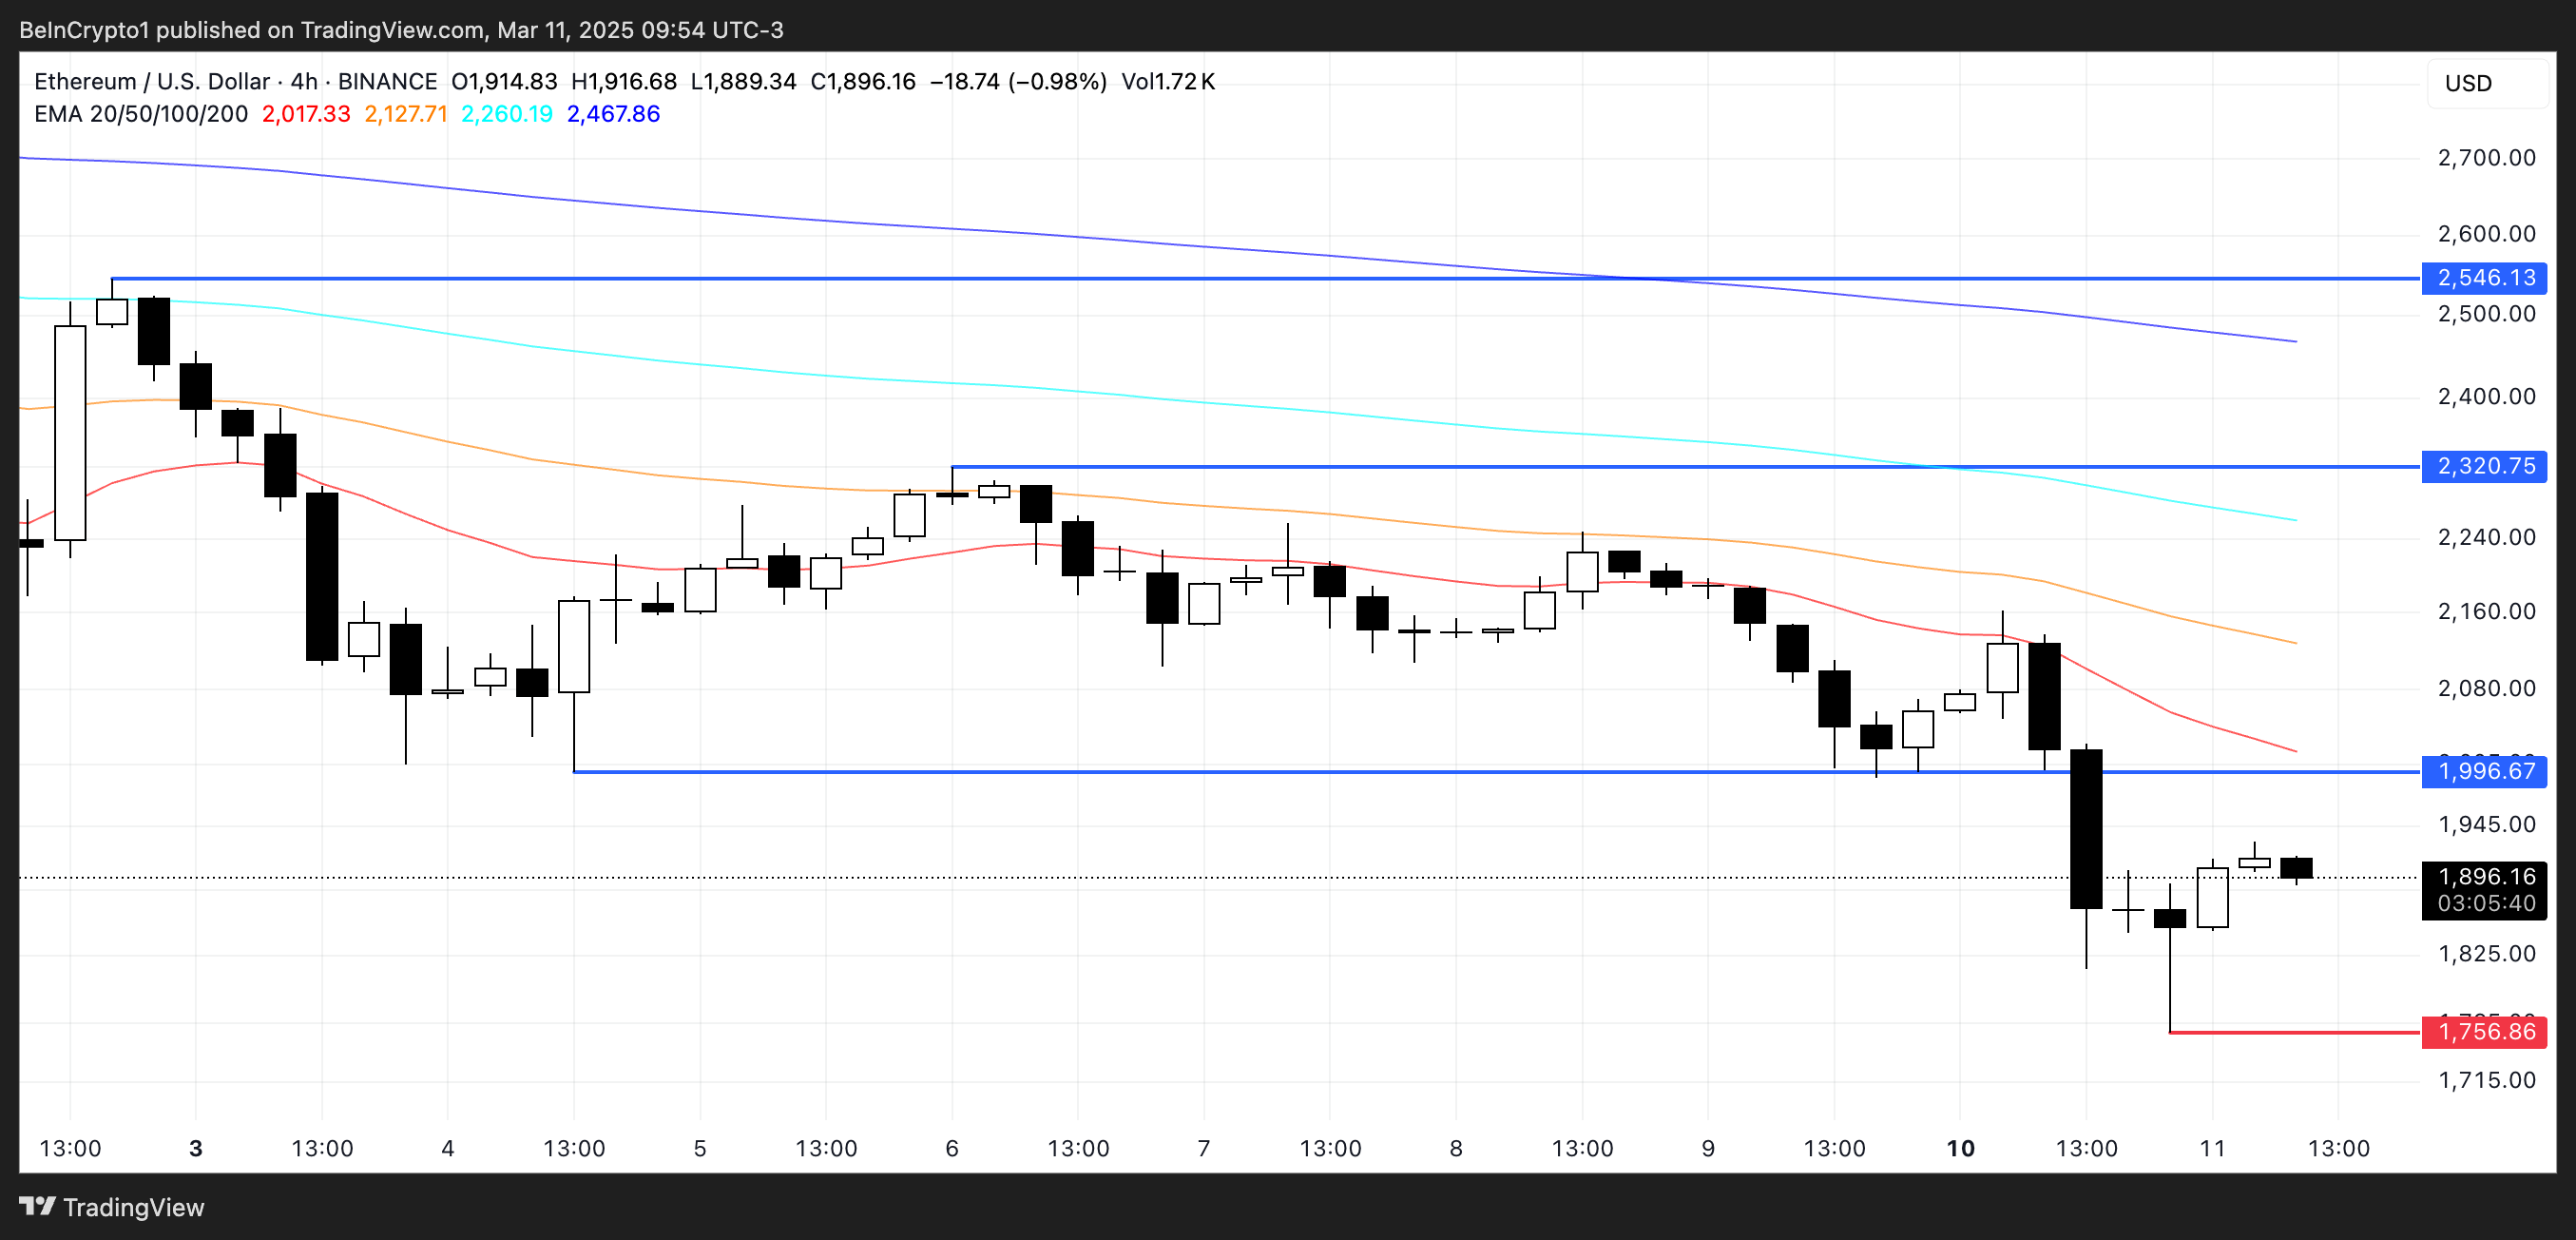
Ethereum Is Still Struggling Below $2,000
Ethereum Exponential Moving Average (EMA) lines are displaying a strongly bearish setup, with short-term EMAs positioned below long-term ones.
This alignment confirms the continuation of downward momentum, with ETH having dropped over 11% in the last 24 hours. If the current trend persists, ETH could test the critical support at $1,756, a level that could determine whether further declines are imminent.
A breakdown below this support would expose Ethereum’s price to a potential drop below $1,700, a level not seen since October 2023, further reinforcing bearish sentiment in the market.
However, if ETH manages to reverse its downtrend, the first key resistance to reclaim would be at $1,996. A successful breakout above this level could trigger a stronger recovery, pushing ETH toward the next resistance at $2,320.
If bullish momentum accelerates, Ethereum could extend gains toward $2,546, a level that would mark a complete shift in trend structure.
For this to happen, ETH would need sustained buying pressure and a bullish EMA crossover, signaling a transition out of its current bearish phase.
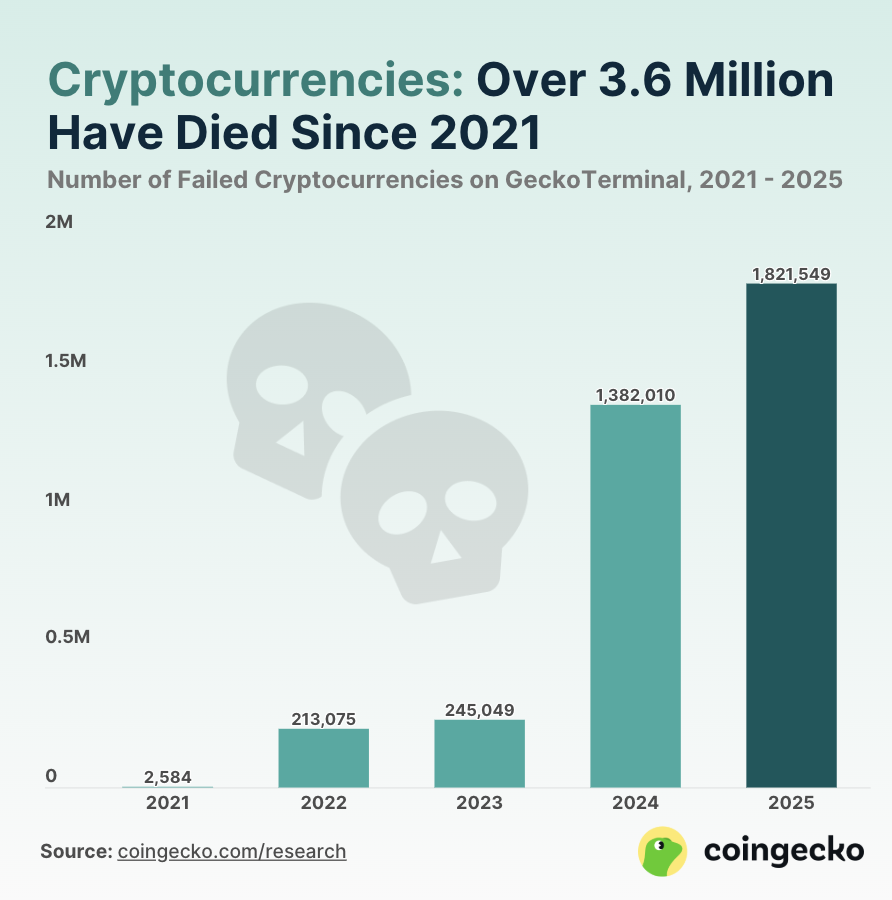
Over 50% of all cryptocurrencies ever launched since 2021 are now defunct. An even more alarming trend is emerging in 2025, where the percentage of failed tokens launched this year has reached the same level in just the first five months.
That percentage will naturally rise with more than half of the year left. Representatives from Binance and Dune Analytics told BeInCrypto that these failures are just another reminder of the need to launch viable projects, backed by solid tokenomics and a robust community.
Ghost Tokens Skyrocket
A recent CoinGecko report revealed some jaw-dropping data. Of the approximately 7 million cryptocurrencies listed on GeckoTerminal since 2021, 3.7 million have subsequently died.
Several factors are considered when evaluating whether a coin has reached its end.
“A coin is classified as ‘dead’ when it loses all utility, liquidity, and community engagement. Key indicators include near-zero trading volume, abandoned development (no GitHub commits for 6+ months), and a price drop of 99%+ from its all-time high. Teams often vanish without warning—social media accounts go dormant, domains expire,” Alsie Liu, Content Manager at Dune Analytics, told BeInCrypto.
Half of all tokens launched since 2021 have died. Source: CoinGecko.
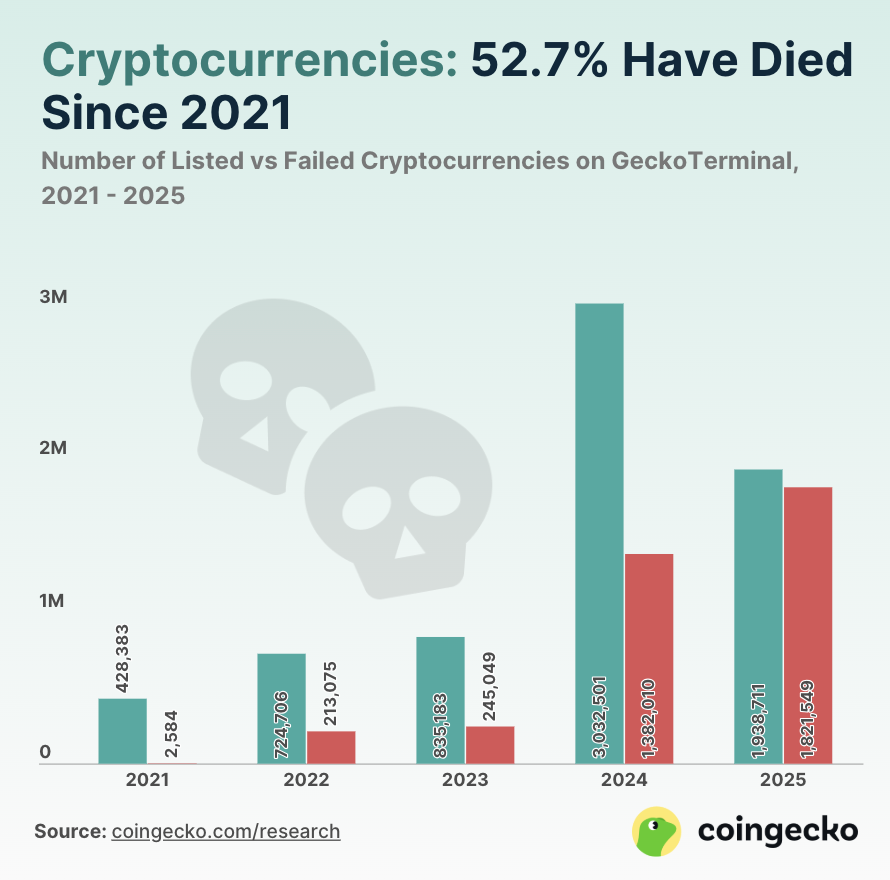
A significant 53% of listed cryptocurrencies have failed, with most collapses concentrated in 2024 and 2025. Notably, the over 1.82 million tokens already stopped trading in 2025 significantly outpaced the approximately 1.38 million failures recorded throughout 2024.
With seven months out of the year ahead, this trend of increasing failures in the current year will continue to grow.
CoinGecko specifically suggested a potential link between economic concerns like tariffs and recession fears, noting a surge in meme coin launches after a certain election, with subsequent market volatility likely contributing to their decline.
However, not all responsibility can be placed on a greater economic downturn. Other aspects can contribute to these project failures.
“Common factors include inability to find product market fit leading to negligible interest from users or investors, or project teams that focus too much on short-term speculation with no long-term roadmap, and sometimes abandonment by developers (rug pulls). Broader issues like fraudulent intentions, weak user traction, novelty-driven hype, financial shortfalls, poor execution, strong competition, or security failures also contribute to project failure,” a Binance spokesperson told BeInCrypto.
The rapid rise in ghost tokens also came with the exponential launch of projects en masse, particularly since the start of 2024.
Analyzing the Life-Death Ratio
Last year was novel in its own right following the proliferation of meme coins. This new narrative emerged particularly after the launch of Pump.fun, a Solana platform that allows anyone to launch a token at a minimal cost.
According to CoinGecko data, 3 million new tokens were listed on CoinGecko in 2024 alone. Half of these projects died, but the other half survived. However, the situation in 2025 appears less stable.
The difference between token launches and failures in 2025 is minimal. Source: CoinGecko.
While the number of new token launches remains high, the number of failures is nearly equivalent, with launches only marginally exceeding deaths by about a thousand.
“Ecosystems with low barriers to token creation see the highest number of ghost coins. In general, platforms that make it very easy and cheap to launch new tokens see the most abandoned coins. During this cycle, Solana’s meme coin surge (e.g., via token launchpads like Pump.fun) drove a flood of new tokens, many of which lost user traction and daily activity once initial hype faded,” Binance’s spokesperson explained.
As of March 5, the meme coin market capitalization had sharply decreased to $54 billion, marking a 56.8% drop from its peak of $125 billion on December 5, 2024. This downturn was accompanied by a significant decrease in trading activity, with volumes falling by 26.2% in the preceding month alone.
Certain token categories have been hit harder than others.
Music and Video Tokens Among the Hardest-Hit Categories
A 2024 BitKE report indicated that video and music were prominent categories with many failed cryptocurrency projects, reaching a 75% failure rate. This outsized percentage suggests that niche-focused crypto ventures often face challenges in achieving long-term viability.
“These niches face adoption and utility gaps. Music tokens struggle to compete with Spotify/YouTube, while ‘listen-to-earn’ models often lack demand. As more mainstream celebrities get into the space without knowing much about blockchain technology, tokens have become the new cash-grab business,” Liu explained.
Binance’s spokesperson noted that legal and technical hurdles, such as music licensing and the significant resources needed for video delivery, complicated the scaling of decentralized alternatives.
They further explained that many projects struggled to remain sustainable without substantial user adoption or strong network effects.
“This highlights that a good concept alone is not enough; crypto projects must also compete with entrenched Web2 platforms, navigate complex industry challenges, and deliver real-world utility to succeed. Without aligning with user behavior and market needs, even well-intentioned initiatives risk fading into ghost tokens,” Binance told BeInCrypto.
Despite the discouraging number of failed tokens, this situation offers important insights into building resilient projects that withstand unfavorable market conditions.
What Can We Learn From Catastrophic Token Collapses?
Prospective token creators can learn significant lessons from once-popular projects that ultimately failed. The negative outcomes experienced by these ventures, particularly in severe instances, can motivate the development of new projects responsibly and avoid similar pitfalls.
Binance referred to notorious ghost coin cases BitConnect and OneCoin.
“BitConnect, once a top-10 coin, collapsed in 2018 after being exposed as a Ponzi scheme promising ~1% daily returns. Investors lost nearly $2 billion. OneCoin, raising ~$4 billion, never had a real blockchain and relied on aggressive multi-level marketing before collapsing. Both cases highlight the dangers of projects built on hype, unrealistic promises, and lack of verifiable technology,” Binance’s spokesperson explained.
While concerning, the rising number of ghost coins serves as a crucial reminder that discernible warning signs often precede the downfall of these cryptocurrencies.
These cases underline the necessity of rigorous research, validating underlying principles, and maintaining a cautious perspective, especially when investment gains appear unrealistically high. Prioritizing risk management and sustainable long-term factors should outweigh short-term speculative trading.
Binance particularly highlighted the importance of “Do Your Own Research” (DYOR) when evaluating crypto projects.
“Practically, this means reviewing the whitepaper, assessing whether the project solves a real problem, verifying the team’s credibility, examining tokenomics and supply distribution, and checking community and development activity,” Binance said, adding that “In essence, DYOR is about empowerment and protection. It helps investors identify solid projects and avoid scams or ghost tokens by spotting red flags early. Given how fast crypto markets move, personal due diligence remains essential for navigating the space safely and successfully.”
Ultimately, the prevalence of ghost tokens highlights a critical truth for crypto participants: thorough research and fundamental value are paramount for identifying lasting projects.
As the broader crypto market begins to recover from recent lows, on-chain data reveals a growing behavioral divide between Bitcoin’s long-term and short-term holders.
Its Long-term holders (LTHs) have resumed net accumulation for the first time since the last local top, while short-term holders (STHs) appear to be exiting the market.
BTC LTHs Return to Accumulation as STHs Capitulate
In a new report, pseudonymous CryptoQuant analyst IT Tech noted that a clear behavioral divide has emerged between BTC’s LTHs and STHs, suggesting the early formation of a re-accumulation phase.
This is based on an assessment of BTC’s Net Position Change for Long-Term Holders (LTH), which, per the analyst, has now flipped positive for the first time since BTC’s last local peak.
“This suggests that experienced, conviction-driven participants are gradually returning to accumulation after several months of sustained distribution. Their activity often reflects strategic, cycle-aware repositioning, not necessarily whale-sized capital flows,” the analyst noted.
Meanwhile, BTC STHs—those who have held BTC for less than 155 days—are selling into weakness, with net outflows remaining firmly in negative territory. This trend suggests capitulation, as newer investors reduce their exposure to the coin in response to recent price troubles.
Bitcoin Long-Term Holder Net Position Change. Source: CryptoQuant
IT Tech noted that this behavioral divergence “tends to signal early stages of a re-accumulation phase.”
“Suppose long-term participants continue increasing their positions while short-term supply gets flushed out. This setup may serve as a constructive base for future price recovery, even if short-term price action remains choppy,” the analyst said.
Momentum Builds for Bitcoin as Buying Pressure Surges
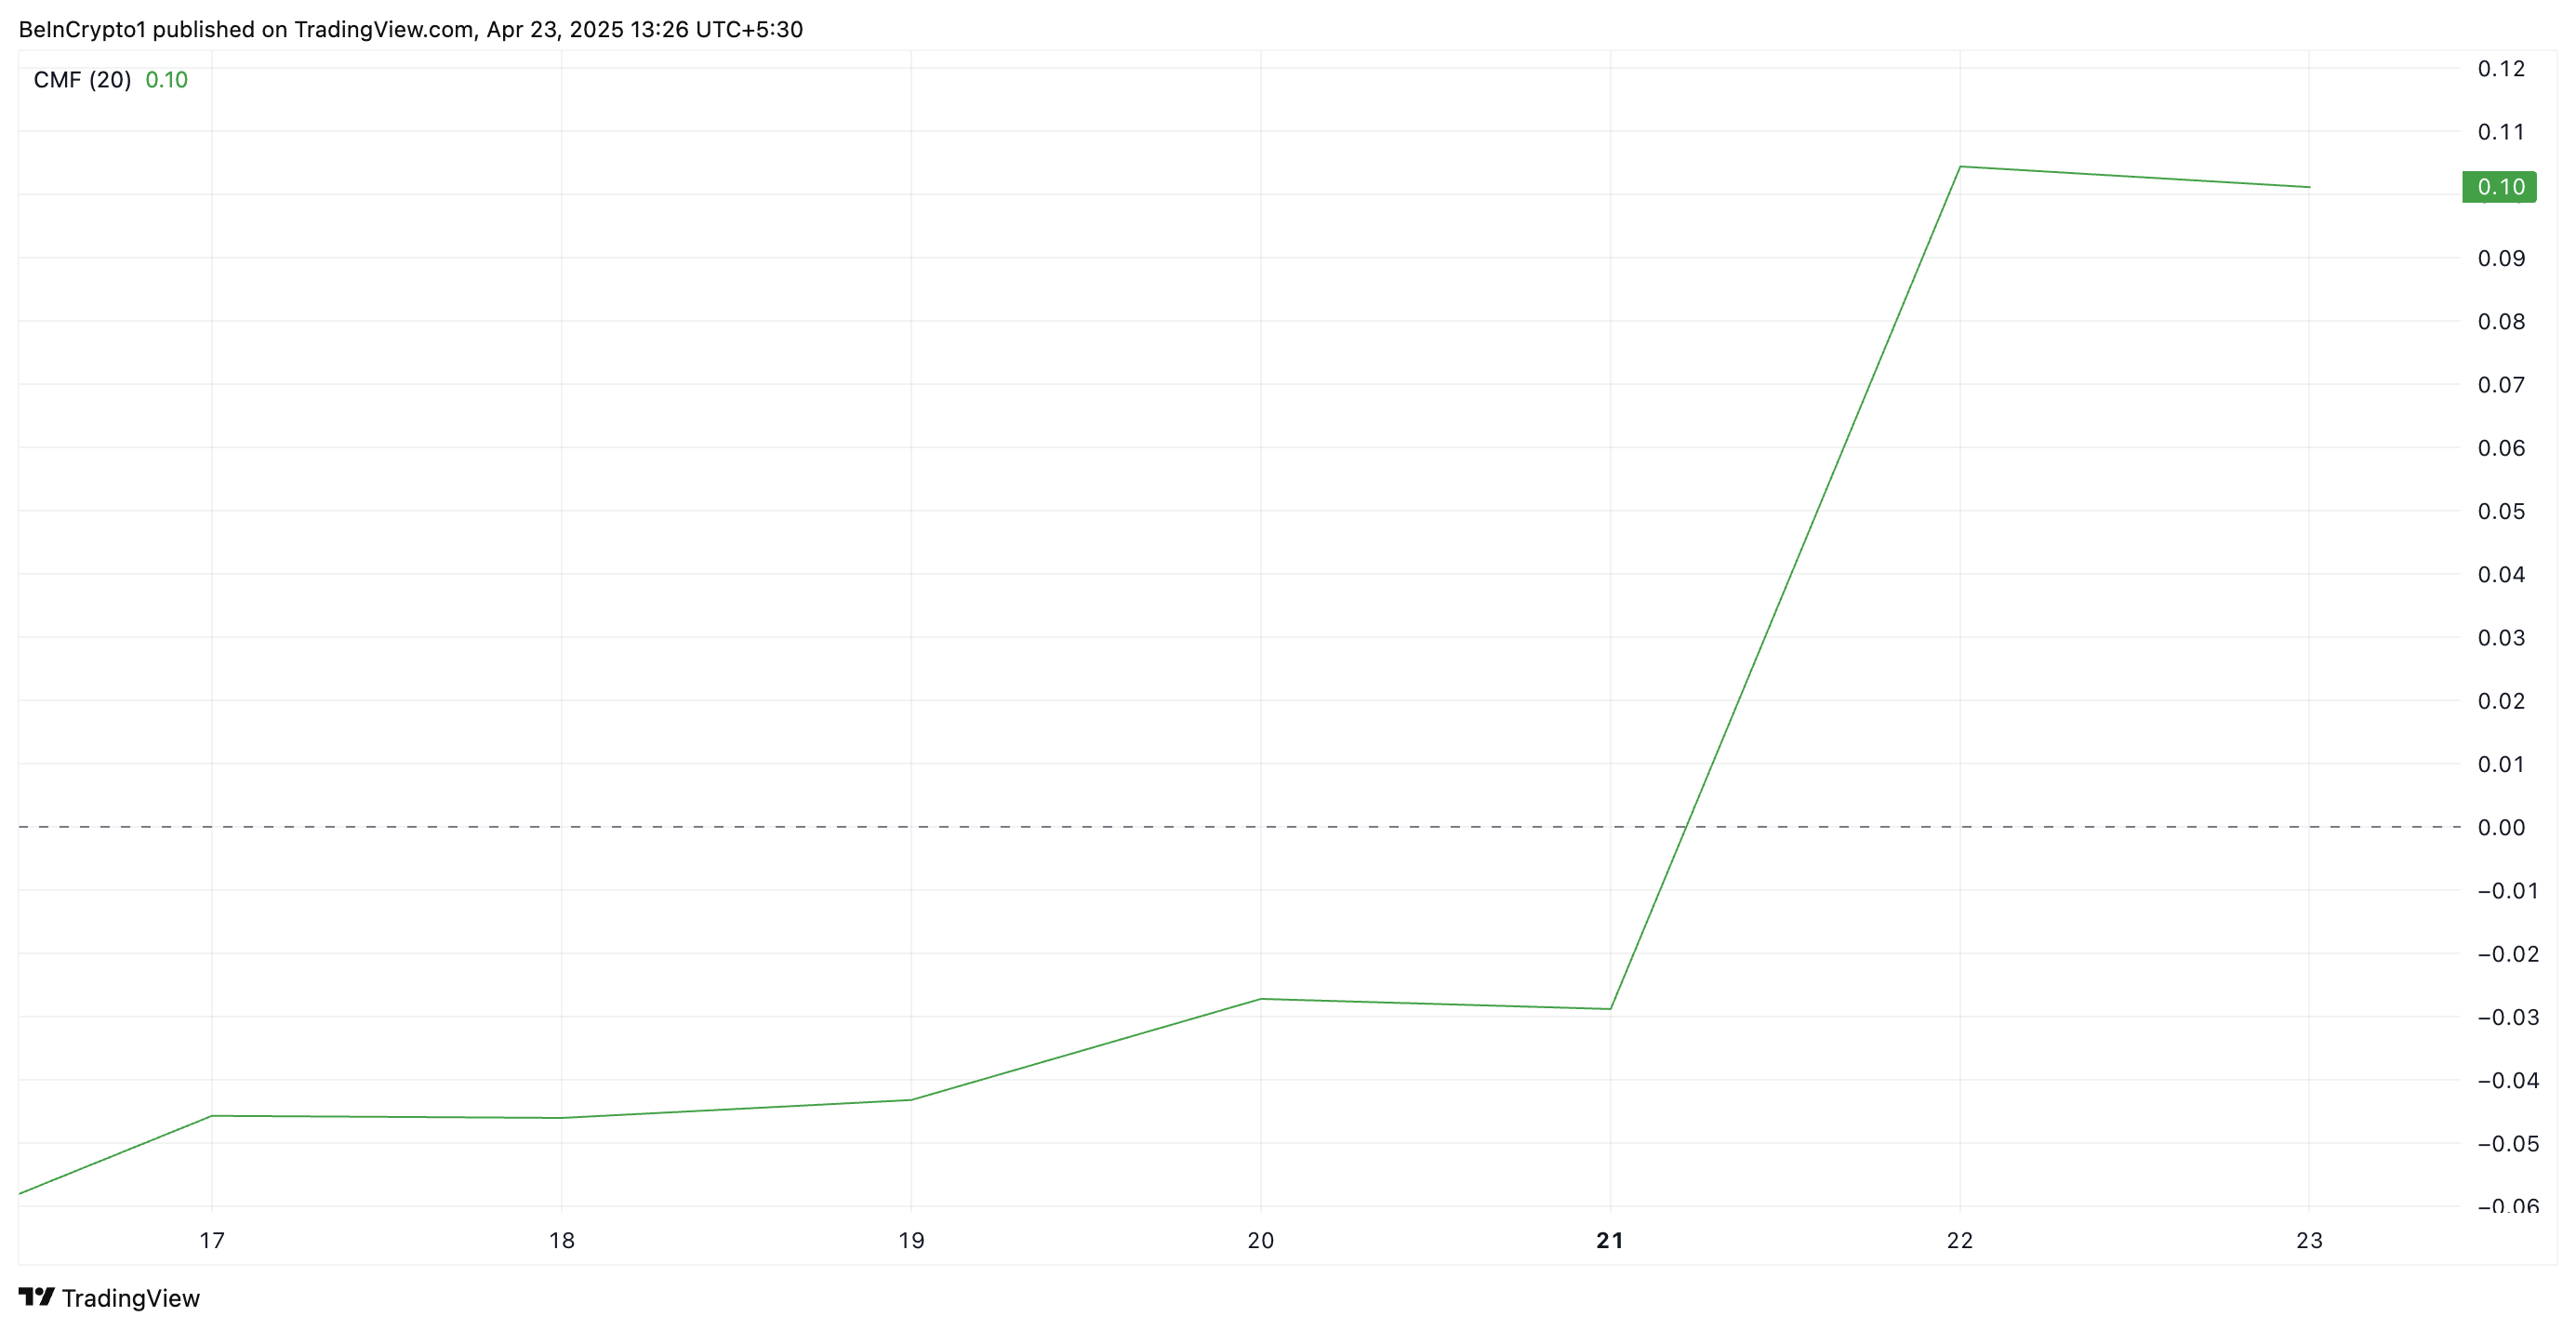
On the daily chart, BTC’s positive Chaikin Money Flow (CMF) reflects increasing investor demand and positive cash flow momentum. This further reinforces the possibility of a bullish breakout as projected by the analyst.
At press time, this momentum indicator, which measures how money flows into and out of an asset, is at 0.10. A positive CMF reading like this indicates that buying pressure outweighs selloffs among market participants and hints at an extended price growth for BTC.
Moreover, the coin’s Aroon Up Line currently sits at 100%, reinforcing the strength of its ongoing uptrend.
An asset’s Aroon Indicator measures the strength and direction of a trend by tracking the time since the highest and lowest prices over a given period. It comprises two lines: Aroon Up, which measures bullish momentum, and Aroon Down, which tracks bearish pressure.
As with BTC, when the Aroon Up line is at 100, it signals strong upward momentum and a dominant bullish trend. This suggests that buying pressure is high, and the price may continue rising.
BTC Bulls Eye New Highs
BTC now trades firmly above the key support formed at $91,851. If the bullish pressure holds and demand rockets, the king coin could continue its uptrend to exchange hands at $95,971.
However, if traders resume profit-taking, this bullish projection will be invalidated. In that scenario, BTC’s price could retest the support at $91,851. Should it fail to hold, its price could fall to reach $87,730.


@Ripple‘s RLUSD stablecoin is growing on @ethereum, with supply up ~4x since January. pic.twitter.com/nQ88TYVtnc
(@tokenterminal) June 28, 2025