The price of XRP has climbed 7% in the past 24 hours, reaching $2.32, as crypto markets turn green amid growing chatter over easing tensions in the Middle East and important developments in the long-running Ripple vs. SEC lawsuit.
After recent market uncertainty caused by the Israel-Iran conflict, crypto prices are starting to recover. XRP, in particular, has seen a strong upswing, with trading volume doubling during this price jump. The token has not only erased the losses from last week’s selloff but has also reclaimed its key price zone around $2.30.
A big reason behind XRP’s rally is the crucial court deadline today, June 16, 2025, in the Ripple vs. SEC case. If both parties fail to submit a corrected motion by the end of the day, the case could move to a full appeal, dragging the matter out for months. However, if they manage to settle or file the needed documents, it could lead to a favorable outcome for Ripple — possibly classifying XRP as a non-security for retail sales. This could open the door for XRP-backed financial products like ETFs and settle the lawsuit by mid-2025.
There’s also fresh ETF news. Purpose Investments, a major asset management firm, may have received its final prospectus receipt, potentially clearing the way to launch its XRP ETF soon. If approved, this would be a major milestone for XRP adoption in traditional markets.
Adding to the positive sentiment, former CFTC Chairman Christopher Giancarlo recently revealed that U.S. regulators are actively discussing the idea of Bitcoin and XRP-backed bonds. This news has excited investors, boosting market confidence around XRP’s future potential.
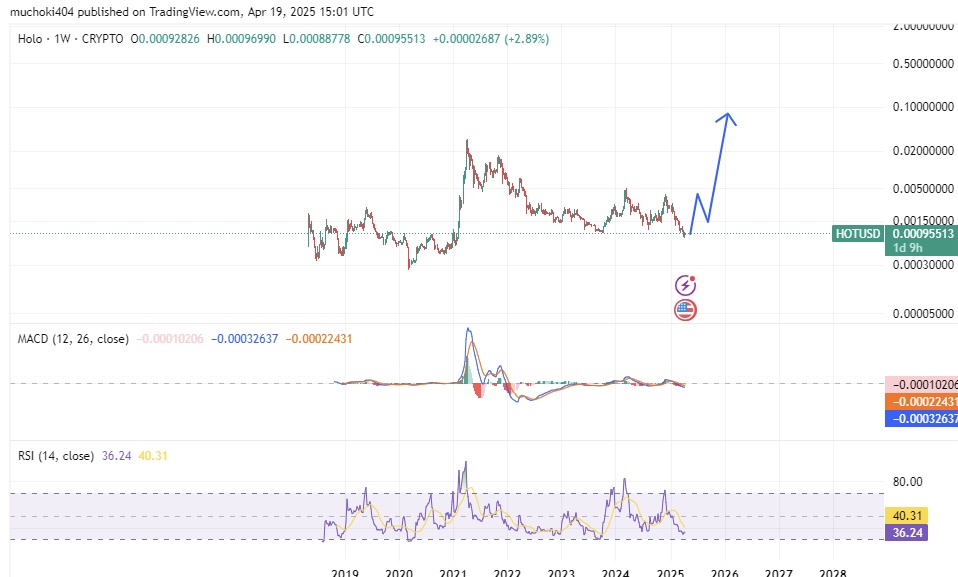
HOT price may reach a potential peak of about $0.0707 in 2025, based on Coinpedia’s formulated forecast.
The rising adoption and use case expansion of the Holochain will play a crucial role in HOT price action over the next five years.
The future growth prospects of Holo (HOT) coin are heavily dependent on the success of the Holochain’s peer-to-peer, energy efficient platform for decentralized applications. Having existed for more than five years, HOT coin has gained significant traction but the team has to deliver a sustainable and scalable platform to capture a wider share of global DeFi space.
Most importantly, HOT price action in the next five years will heavily depend on the global regulatory environment, led by the United States, Europe, and other major economies.
Holo price may reach a potential peak of about 10 cents in 2026 and a possible low of around $0.001148.
Price Prediction for 2027
Considering the established four-year crypto cycle, diminishing returns, and regulatory outlook, HOT price may reach a potential low of about $0.001630 in 2027 and a possible peak of around 14 cents.
Price Prediction for 2028
As the next Bitcoin-halving year, which also coincides with the next U.S. Presidential election, HOT price may reach a potential peak of about 19 cents and a possible low about $0.002216.
Price Prediction for 2029
If Holo price will have established a rising trend in the prior years, HOT price may reach a peak of about 25 cents in 2029 and a possible low of around $0.002925.
Price Prediction for 2030
By the end of this decade, HOT price may reach a potential peak of about $0.3223 and a possible low of around $0.003685.
Market Analysis
*Predictions below represent respective end of year peaks by the different companies.
2025
2026
2030
Coincodex
$0.000798
$0.000657
$0.00006550
Tradersunion
$0.00101
$0.001179
$0.001877
Pricepredictions
$0.001729
$0.00269
$0.006533
CoinPedia’s Price Prediction
According to Coinpedia’s formulated Holo price forecast for 2025, if the crypto market regains bullish sentiment in the next three quarters, $HOT price will likely end the year at a potential low of about $0.000792, and a possible peak of around $0.0707.
Potential Low
Average Price
Potential High
2025
$0.000792
$0.00386
$0.0707
FAQs
Is HOT a great investment for the next five years?
Yes, it is a potentially profitable investment bolstered by the mainstream adoption of DeFi technology and digital assets.
Top factors that will influence HOT price action by 2030.
The adoption and use case expansion of the Holochain will play a crucial role in HOT price action in the next five years.
Where can you buy HOT tokens?
The HOT coin is listed for trading by Binance, Bybit, Bitget, MEXC, Gate.io, and Crypto.com, among many others.
Will the HOT coin reach $1 by 2030?
With the dubious crypto speculation amid the improving crypto regulatory outlook in major jurisdictions, HOT price could rise to $1 by 2030. However, considering diminishing returns, HOT price may not reach $1 in the next five years.
The post Holo Price Prediction for 2025-2030: When Will $HOT Reach $1? appeared first on Coinpedia Fintech News
Story Highlights The price of Holo (HOT) today is $0.0009571 HOT price may reach a potential peak of about $0.0707 in 2025, based on Coinpedia’s formulated forecast. The rising adoption and use case expansion of the Holochain will play a crucial role in HOT price action over the next five years. The future growth prospects …
Roman Storm’s landmark trial is still ongoing, and federal prosecutors admitted that they’re considering charges against employees at Dragonfly Capital, a VC that backed Tornado Cash.
The presiding Judge sealed a statement describing the specific employees in question. However, the possible charges wouldn’t be directed at Dragonfly or the entire firm. General Partner Tom Schmidt was asked to testify, but pled the Fifth.
Today, they referred to Tornado Cash’s other business connections, specifically its VC backer Dragonfly Capital.
AUSA Rehn: We’ve spoken with Tom Schmidt’s lawyer John Bostick Judge: Are you looking at possibly prosecuting everyone at DragonFly? AUSA Rehn: Not everyone, but Schmidt and
Rehm: My chief says we’ll ask to seal this Judge Failla: Yes, I seal it
Apparently, these emails discussed whether or not to add KYC guidelines to Tornado Cash. Some online commentators speculated that the firm explicitly advised Tornado Cash to disregard KYC protocols, but this is controversial.
Possible New Charges
In any event, US prosecutors claimed that they’re considering charges against several Dragonfly employees due to their possible involvement in Tornado Cash’s alleged illegal activity.
These charges wouldn’t apply to the entire corporate entity or every employee, but the presiding Judge agreed to seal the exact transcript of this exchange.
Tornado Cash’s lawyers requested that Tom Schmidt, a general partner at Dragonfly, testify on the platform’s behalf. However, Schmidt’s attorney invoked the Fifth Amendment, refusing to do so.
Essentially, he argued that Schmidt would be forced to bear witness against himself, which is unconstitutional. It’s unclear if this argument will hold up, but Schmidt didn’t testify today.
For now, then, it’s difficult to make any predictions about Dragonfly’s entanglement with the Tornado Cash case. If prosecutors decline to criminally charge the prominent VC firm, this might jeopardize Schmidt’s bid for immunity.
Of course, the defense called him as a witness, so he could potentially refuse to testify without the Fifth Amendment’s protection.
The trial is now in recess for the weekend, and closing arguments are expected next week.
The crypto market’s ongoing growth is propelling several tokens toward new highs, with many already achieving this milestone in the past week. Among those poised to follow suit is BNB, which is on track to make history.
BeInCrypto has identified two additional altcoins that are quickly approaching their all-time highs and could soon set new records.
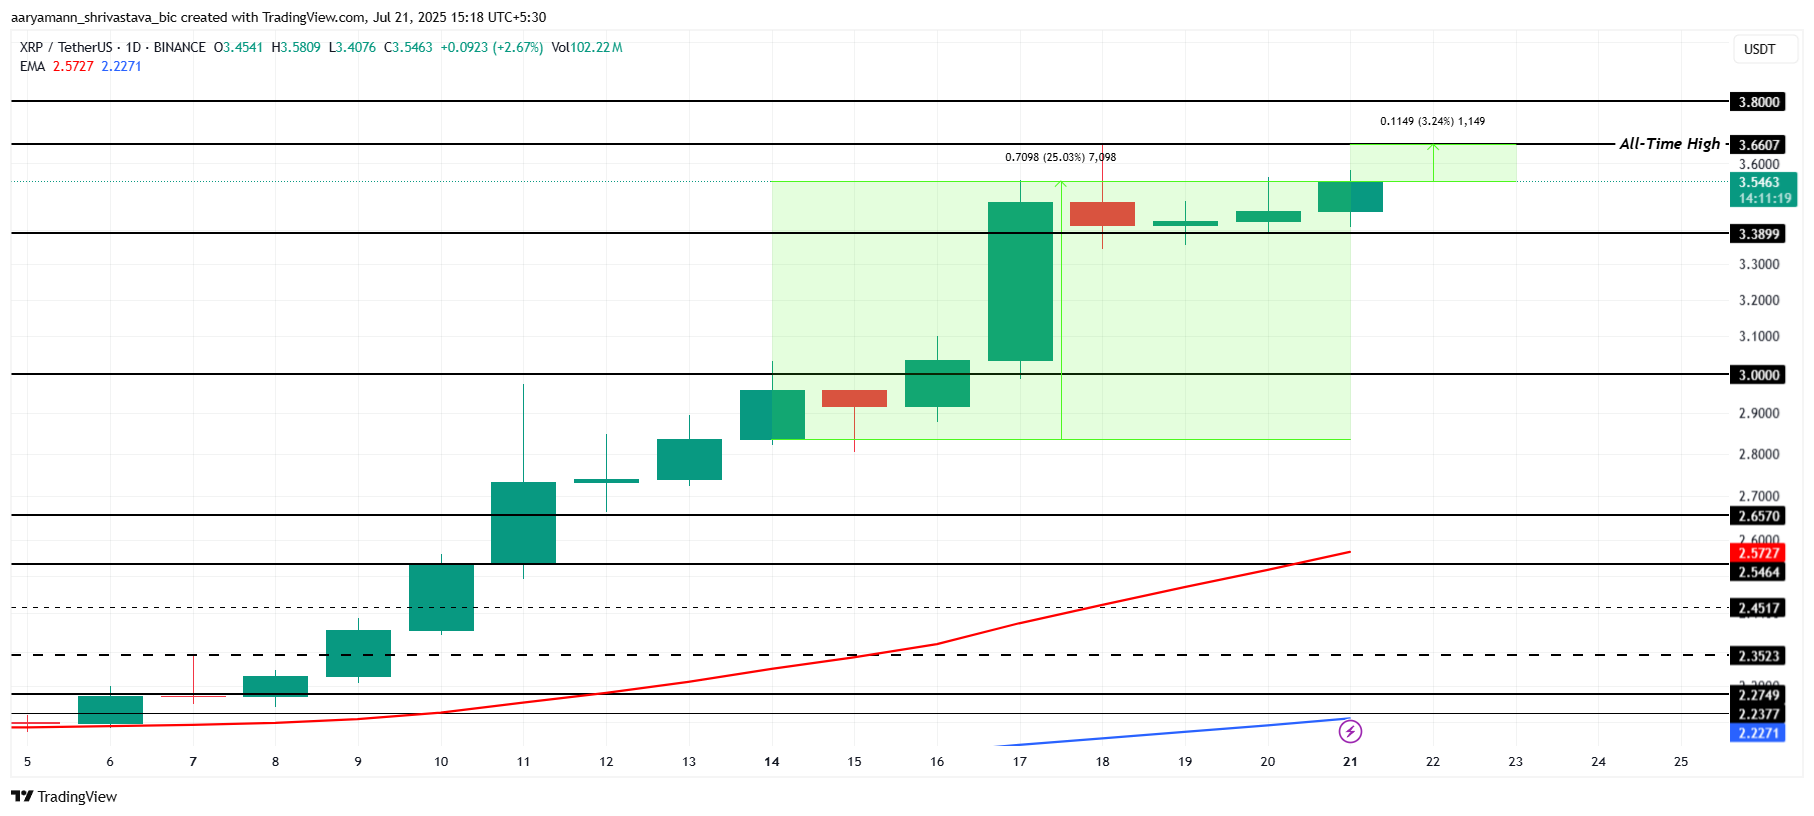
XRP
XRP price recently marked a new all-time high, reaching $3.66 for the first time in over six months. While the altcoin experienced a slight dip shortly after, it now trades just 3.2% below its ATH, signaling strong investor interest.
The exponential moving averages show a bullish Golden Cross and are currently serving as dynamic support. This technical signal suggests that XRP is primed for continued gains. A breakout past the $3.66 level could propel the altcoin toward $3.80, enabling it to set a fresh all-time high.
For token TA and market updates: Want more token insights like this? Sign up for Editor Harsh Notariya’s Daily Crypto Newsletter here.
However, profit-taking remains a risk as some investors may look to cash in on recent gains. If selling pressure intensifies, XRP price could break below the $3.38 support level. A fall to $3.00 would invalidate the bullish outlook and potentially mark the beginning of a broader correction.
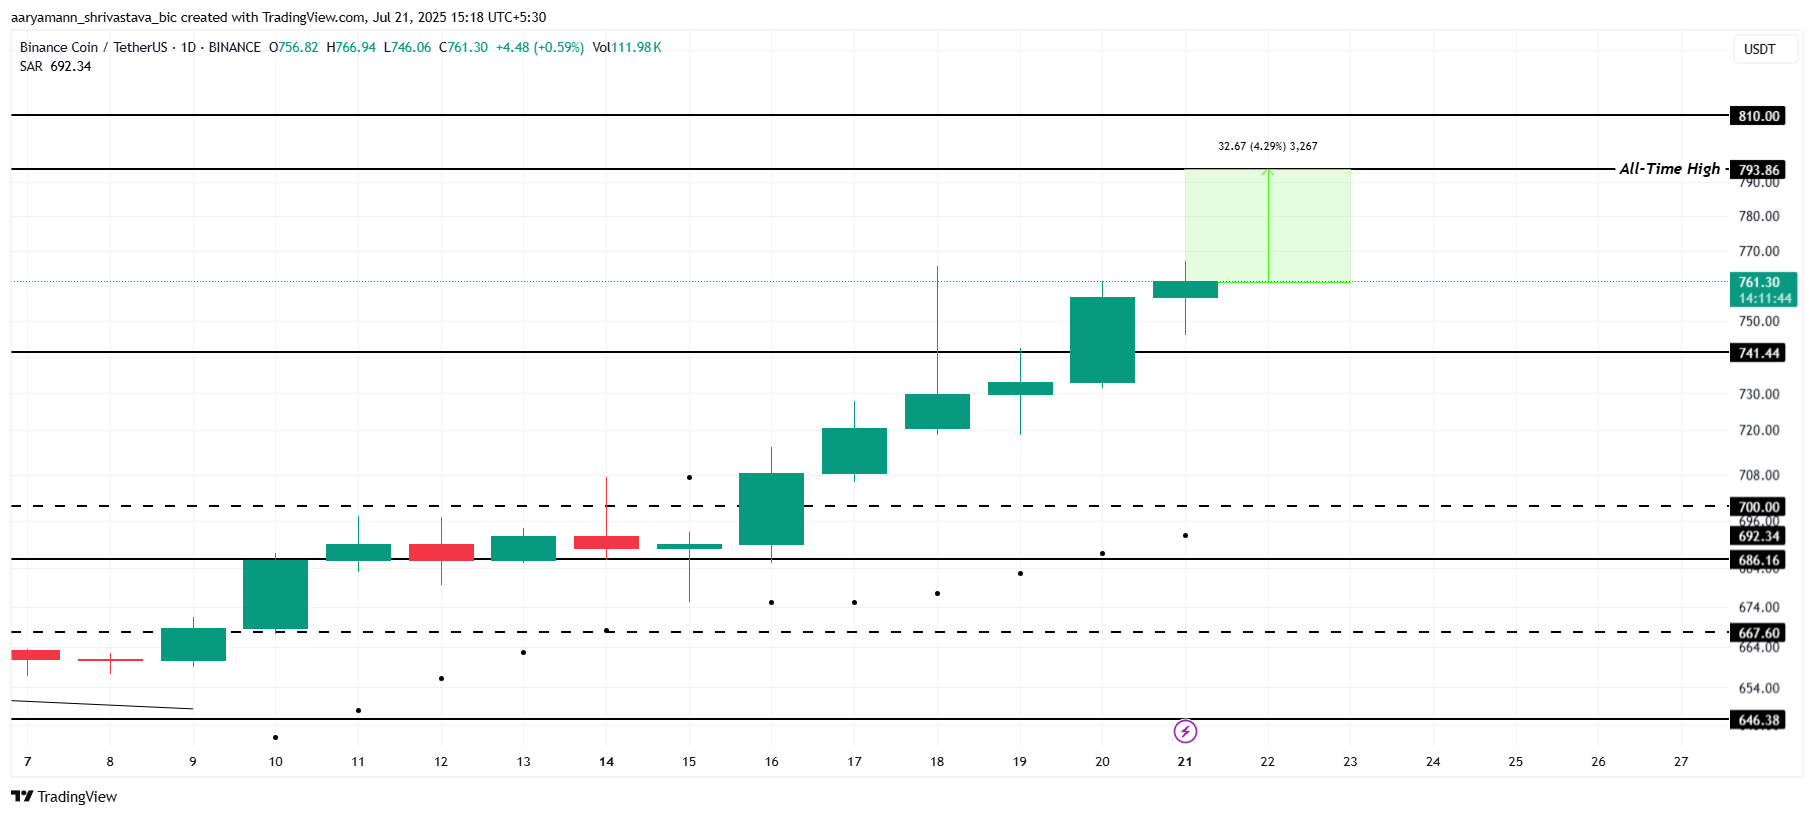
BNB
BNB price is currently trading at $761, just 4% short of breaching its all-time high of $793. Investors have waited seven months for this moment. To achieve a breakout, the altcoin must first secure $741 as a stable support.
The Parabolic SAR indicator is currently positioned below the candlesticks, acting as a strong signal of bullish momentum. This technical pattern suggests an ongoing uptrend. If sustained, BNB could surpass the $793 mark and also climb to $810, setting a new all-time high and reinforcing investor optimism.
However, a premature sell-off could hinder this rally. If BNB fails to hold the $741 support level, it risks declining to $700. Such a drop would invalidate the bullish outlook and may trigger a wave of caution across the market, especially among short-term traders banking on a breakout.
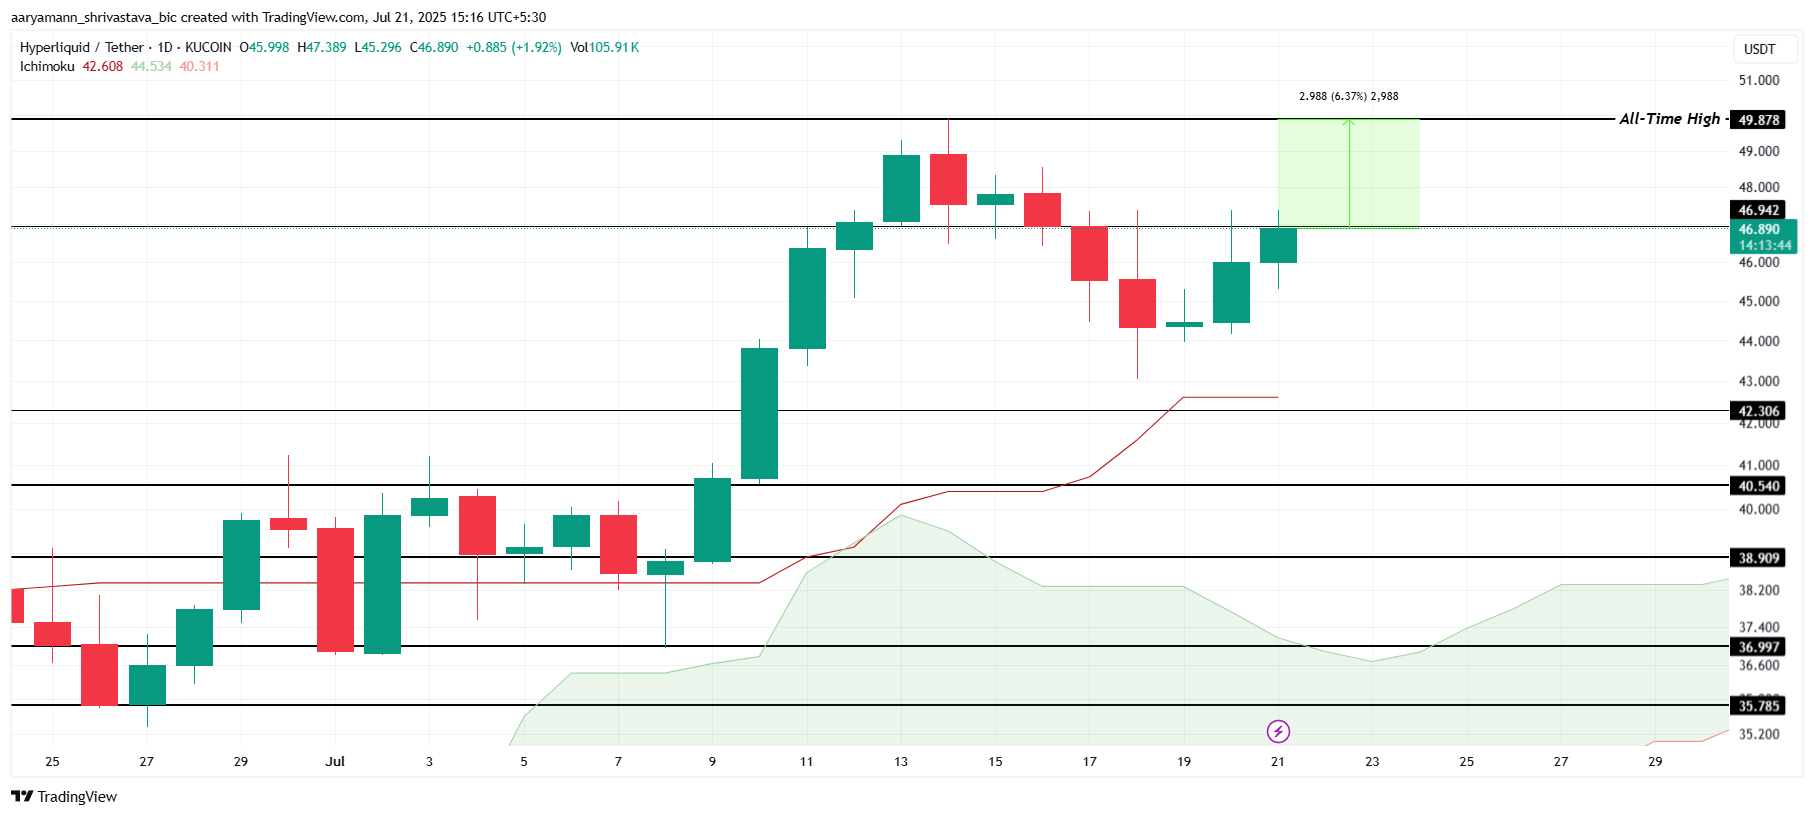
Hyperliquid (HYPE)
HYPE is positioned to chart a new all-time high, provided it secures $46.94 as solid support. Maintaining this floor could pave the way for HYPE to extend its upward momentum in the near term.
Currently trading at $46.89, HYPE is just over 6% away from breaching its all-time high of $49.87, recorded last week. The Ichimoku Cloud forming below the candlesticks signals growing bullish strength. This technical setup indicates a high probability for HYPE to surpass the $50.00 mark soon.
However, if HYPE fails to establish $46.94 as reliable support, the bullish outlook could be invalidated. A drop toward $42.30 would represent a significant correction, erasing recent gains. Such a reversal would also reduce investor confidence and signal a potential shift in short-term market sentiment.