Bitcoin is back on the move and is on the brink of making history again. At the time of publication, the BTC price is hovering around $109,418.91, up 3.62% since yesterday. Successively, its market cap has risen to $2.17 trillion, while the daily trading volume has surged by over 46%. With Bitcoin now just a few percentage points away from surpassing the current ATH, marketers are stressing out on one single question: Will Bitcoin price hit the ATH in the next 24 hours? Let us decode the quest in this Bitcoin price analysis.
Bitcoin (BTC) Price Analysis: What’s Next?
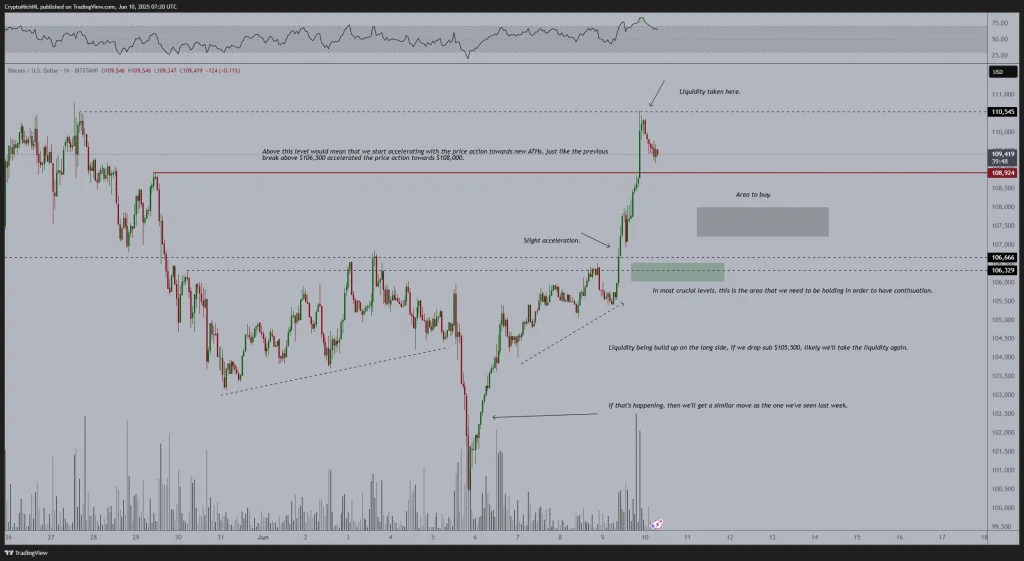
Bitcoin’s current pace is boosted by consecutive breakouts above crucial resistance levels. It is worth noting that, once BTC price crossed $106,500, it quickly rallied to the $110,000 mark, a move that analyst Michael Van de Poppe rightly anticipated. According to him, the breakout above $108,900 accelerated price action further, with a peak now seen at $110,561.
A brief sideways trend, as seen in the past, typically follows such parabolic moves. This could mean Bitcoin might hover near current levels or slightly correct before launching toward new highs. The RSI on the hourly chart hints at temporary exhaustion, but the structure remains bullish.
The ideal zone to buy remains between $107,000 and $108,000, a support area noted for strong continuation potential. Liquidity pools below $105,500 could also serve as a bounce region if prices retrace further. If current momentum sustains and dips remain shallow, Bitcoin breaching ATH levels within the next 24 hours is not just possible, but highly probable.
The Hong Kong Monetary Authority (HKMA), the city’s de facto central bank, has finalized its regulatory framework for stablecoin issuers, publishing two sets of guidelines that will come into effect on August 1. While the framework is now in place, the HKMA is expected to issue the first batch of stablecoin licences in early 2026, and has called on potential issuers to submit their applications by the end of September.
Hong Kong Pushes Following Genius Act
On Tuesday, the HKMA released finalized guidelines and consultation conclusions outlining upcoming rules for stablecoin oversight. The documents cover supervision of licensed issuers, as well as AML and CTF requirements. As part of the new framework, Hong Kong will also launch a public registry of licensed stablecoin issuers.
“In the future, the public may refer to the register of licensed stablecoin issuers as shown on the HKMA’s website,” the regulator said.
At a media briefing, the Hong Kong Monetary Authority (HKMA) said the city’s stablecoin regulations will take effect this Friday, August 1. However, the first licences for stablecoin issuers are now expected to be granted in early 2026.
Many in the market had hoped the licences would be issued this year, but the HKMA’s comments suggest it’s taking a more cautious approach.
The regulator added, “Considering Hong Kong’s well-established systems, we do not expect to achieve large-scale (stablecoin adoption) immediately in the early stages. Instead, we aim to progress step by step, gradually driving the digital transformation of Hong Kong.”
The HKMA is encouraging anyone interested in applying for a stablecoin license to get in touch with the regulator by August 1. To be considered for the first round of approvals, applicants must also submit their full applications by September 30.
The HKMA Warns Against Hype and Scams
The HKMA made it clear that, as of now, no stablecoin licences have been granted, and cautioned the public against trusting individuals or companies claiming to be licensed or regulated in Hong Kong.
The new guidelines require stablecoin issuers to follow rules on managing reserves, issuing and redeeming coins, handling risks, and running their operations properly.
To prevent money laundering, licensed issuers must check customers’ identities, manage wallet risks, follow rules for tracking transfers, and keep an eye on transactions.
The HKMA also said it will carry out checks and investigations if the rules are broken and can take action against those who don’t comply. Authorities also advised skepticism toward those saying they are in the process of applying, stressing that anyone holding unlicensed stablecoins is doing so at their own risk.
The HKMA expressed concern over growing hype in the market. Chief Executive Eddie pointed to a surge in excitement around stablecoins that had triggered sharp increases in trading activity and stock prices, moves the regulator believes were largely unwarranted.
The post Hong Kong Finalizes Stablecoin Rules Effective Aug. 1, Warns Against Hype as Licensing Delayed to 2026 appeared first on Coinpedia Fintech News
The Hong Kong Monetary Authority (HKMA), the city’s de facto central bank, has finalized its regulatory framework for stablecoin issuers, publishing two sets of guidelines that will come into effect on August 1. While the framework is now in place, the HKMA is expected to issue the first batch of stablecoin licences in early 2026, …
Bitcoin (BTC) price performed underwhelmingly on Thursday, posting a mild 2% dip before stabilizing at $89,000 while the aggregate market cap rose by 6%. With Bitcoin market dominance down, early media chatter suggests the upcoming White House crypto summit scheduled for Friday, is expected to drive another wave of volatile price action in the days ahead.
Bitcoin Faces Stiff Resistance at $93,000 as Traders Rotate Into Altcoins
Bitcoin (BTC) performance on Thursday was underwhelming despite bullish sentiment across global financial markets, including cryptocurrencies.
BTC price formed a local bottom at $81,400 on Wednesday, before rebounding 14% after the U.S. Secretary of Commerce hinted that Trump may ease the 25% tariffs imposed on Canada and Mexico.
Bitcoin Price Action
However, Bitcoin bulls encountered resistance at $92,790, prompting traders to shift capital toward other high-performing assets. The latest charts indicate BTC has since retraced 4% to $88,900 at press time, signaling hesitation ahead of key macro developments.
Bitcoin Market Dominance Dips as Investors Bet on Altcoins Ahead of White House Crypto Summit
When Bitcoin underperforms the broader market, it often signals shifts in investor sentiment and risk appetite. In alignment with recent trends, the upcoming White House Crypto Summit has become a dominant discussion point among traders.
Following the announcement of the U.S. Crypto Strategic Reserve last weekend, altcoins outperformed Bitcoin’s 13% price gain.
Notably, Cardano (ADA) surged 100% within 24 hours of the announcement. Investors now anticipate that if the White House summit delivers favorable regulatory measures or investment plans for the reserve, altcoins could see another explosive rally.
Bitcoin Dominance (BTC.D) | March 6
Bitcoin dominance (BTC.D) has plunged 5% since Trump announced the Crypto Strategic Reserve on March 2. On Thursday, BTC.D fell 0.6 percentage points to 61.28%, indicating investors are rotating capital into altcoins, betting that regulatory clarity could fuel short-term gains beyond BTC.
David Sacks, Trump’s newly appointed Crypto Czar, has criticized the Biden administration for what he calls a massive financial blunder. Sacks pointed out that the U.S. government auctioned off 195,000 BTC over the past decade for just $366 million, missing out on $17 billion in potential profits as Bitcoin surged 4,500% since those sales.
“The Biden administration had a golden opportunity and fumbled it,”
Trump’s Crypto Czar, David Sacks, hinting that over 195,000 BTC that could have been added to US reserves, March 5, 2025.
With the White House Crypto Summit kicking off within 24 hours, expectations are mounting that the Trump administration could introduce expansive crypto-friendly policies, potentially reshaping U.S. digital asset regulation.
Bitcoin Price Forecast: Death Cross Flashes Short-term Risk Signals as BTC Fails $93,000 Test
Bitcoin price forecast show that BTC currently hovers around $89,112, showing signs of weakness as bearish momentum gains traction. The Super SMA 5-8-13 crossover indicates a Death Cross, with the 5-period SMA ($89,626) slipping below the 8-period ($88,864) and 13-period ($88,171).
This bearish alignment suggests a potential continuation of the downtrend, with BTC at risk of retesting the $80,727 support marked by the Parabolic SAR.
Bitcoin Price Forecast
Momentum indicators confirm downside risks. The MACD histogram has entered positive territory, yet the MACD line at -934 remains below the signal line at -1,663, suggesting a lack of bullish conviction.
The previous rally failed to breach key resistance, reinforcing sellers’ dominance as volume on the latest red candle suggests strong rejection above $90,000.
A decisive break below $88,171 could trigger cascading sell orders, driving BTC toward $84,000, with $80,727 as the next major support.
However, if bulls reclaim $89,626, Bitcoin could aim for a reversal, targeting $92,500 before challenging $97,500. Failure to reclaim momentum risks accelerated liquidation, reinforcing the bearish structure hinted at by the recent Death Cross.
Shiba Inu (SHIB) trades in the green over the past 24 hours with a modest 4% gain despite whale transactions on the network dropping by a staggering 84%. The sharp drop signals reduced activity from top holders and may suggest waning interest. As whales remain on the sidelines, what’s next for Shiba Inu price? Will