Gemini filed for an IPO, following in the footsteps of Circle’s recent successes. Nonetheless, this move has caused skepticism in the community as some KOLs wonder if this IPO is a bubble indicator.
The company has shown interest in an IPO for several months, and Cameron Winklevoss recently teased big future developments in a public appearance.
Still, this Gemini IPO is not necessarily a huge surprise; the firm teased such a development for months. At the recent Bitcoin Conference, Cameron Winklevoss described bold plans for his firm and the crypto industry as a whole. An IPO would certainly fit the bill. Nonetheless, some influential community members wonder if this is oversaturating the market:
“Oh boy, here comes the next one already. So we have Bitcoin Treasury companies and IPOs this cycle. Doubt Gemini is a good investment, but neither is Circle, and look what they’re valued at. Bubble forming,” WhalePanda claimed via social media.
In other words, some KOLs believe that Gemini’s IPO might represent a market top indicator. The firm has made some advancements recently, but an IPO doesn’t necessarily signal strong fundamentals. Whatever happens, it’s still in the early stages.
Airdrop tokens are under the spotlight as Kadena (KDA), Huma Finance (HUMA), and Sophon (SOPH) face volatile market reactions following their recent distributions.
Kadena kicked off a Galxe campaign with a $55,000 prize pool but remains down 14.4% in the last week. HUMA has dropped over 51% in just three days after its Season 1 airdrop, despite strong investor backing. Meanwhile, SOPH plunged 33% within 24 hours of launch due to a massive token unlock and continues to test key support levels amid high leverage and limited utility.
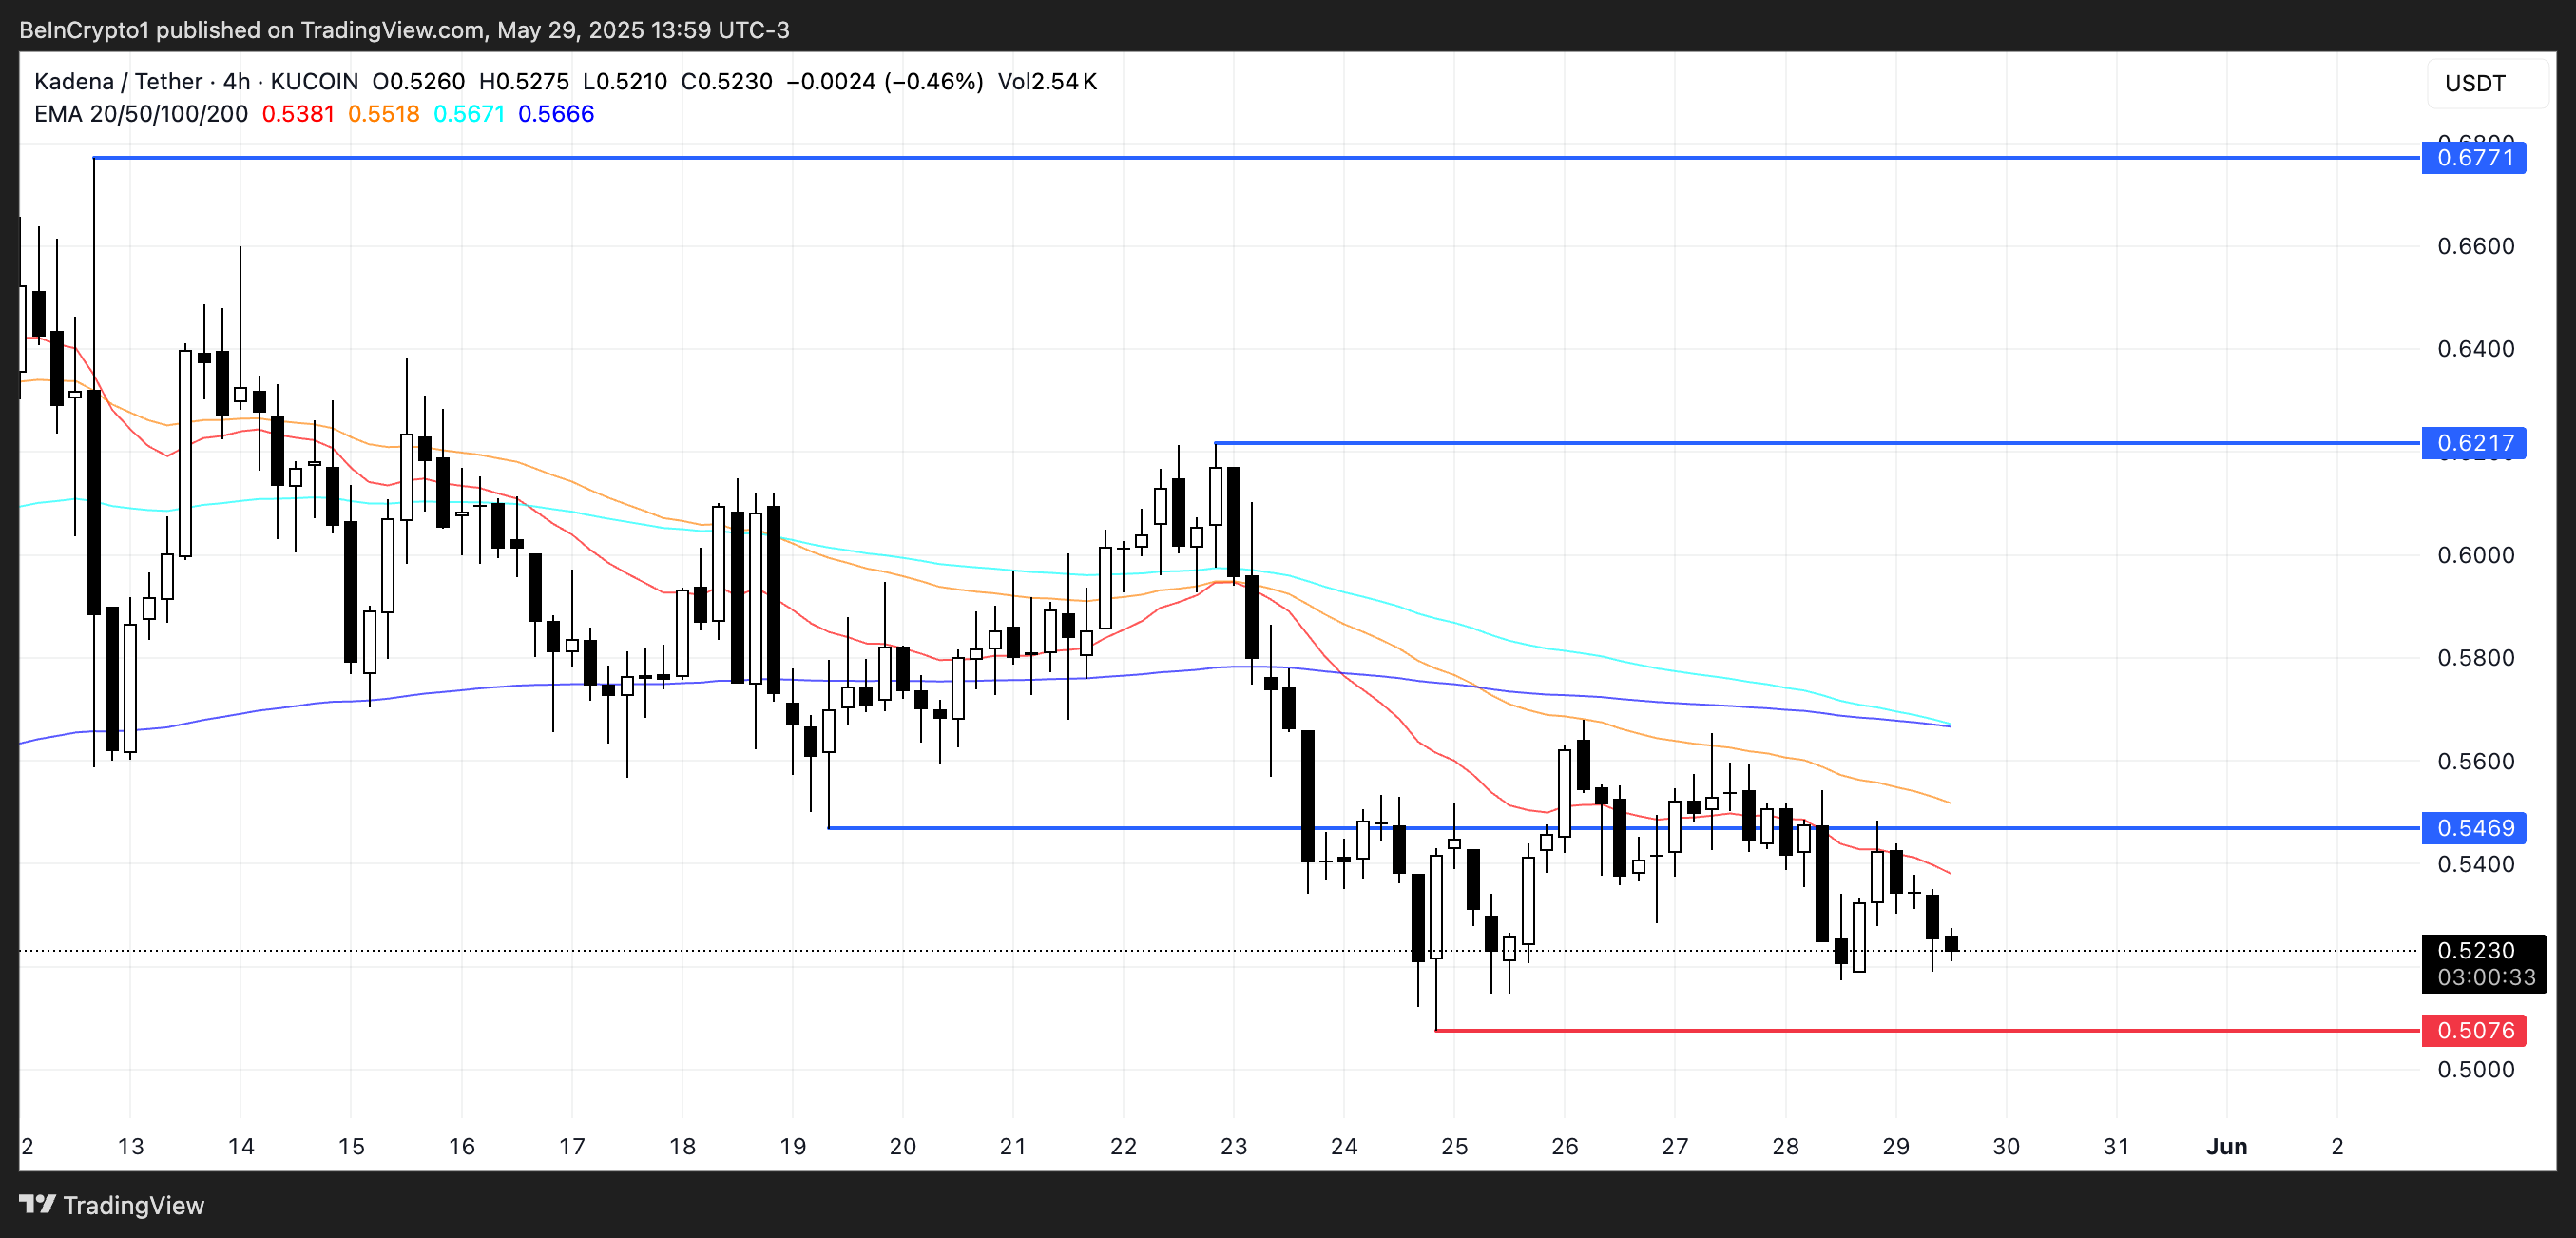
Kadena (KDA)
Kadena leads the list of top crypto airdrops for the final week of May, raising over $35 million with backing from major investors like Multicoin Capital, CoinFund, and SV Angel.
The project, a Layer 1 Proof-of-Work blockchain focused on scalability, launched a confirmed airdrop campaign through Galxe with a 100,000 KDA prize pool—valued at around $55,000.
Users can participate by completing tasks such as connecting wallets, joining social channels, or holding KDA tokens. The campaign runs until August 24, offering a strong incentive for community engagement and ecosystem growth.
However, if sentiment shifts and buying pressure returns, the token may retest resistance at $0.54, with further upside potential toward $0.621 and $0.677.
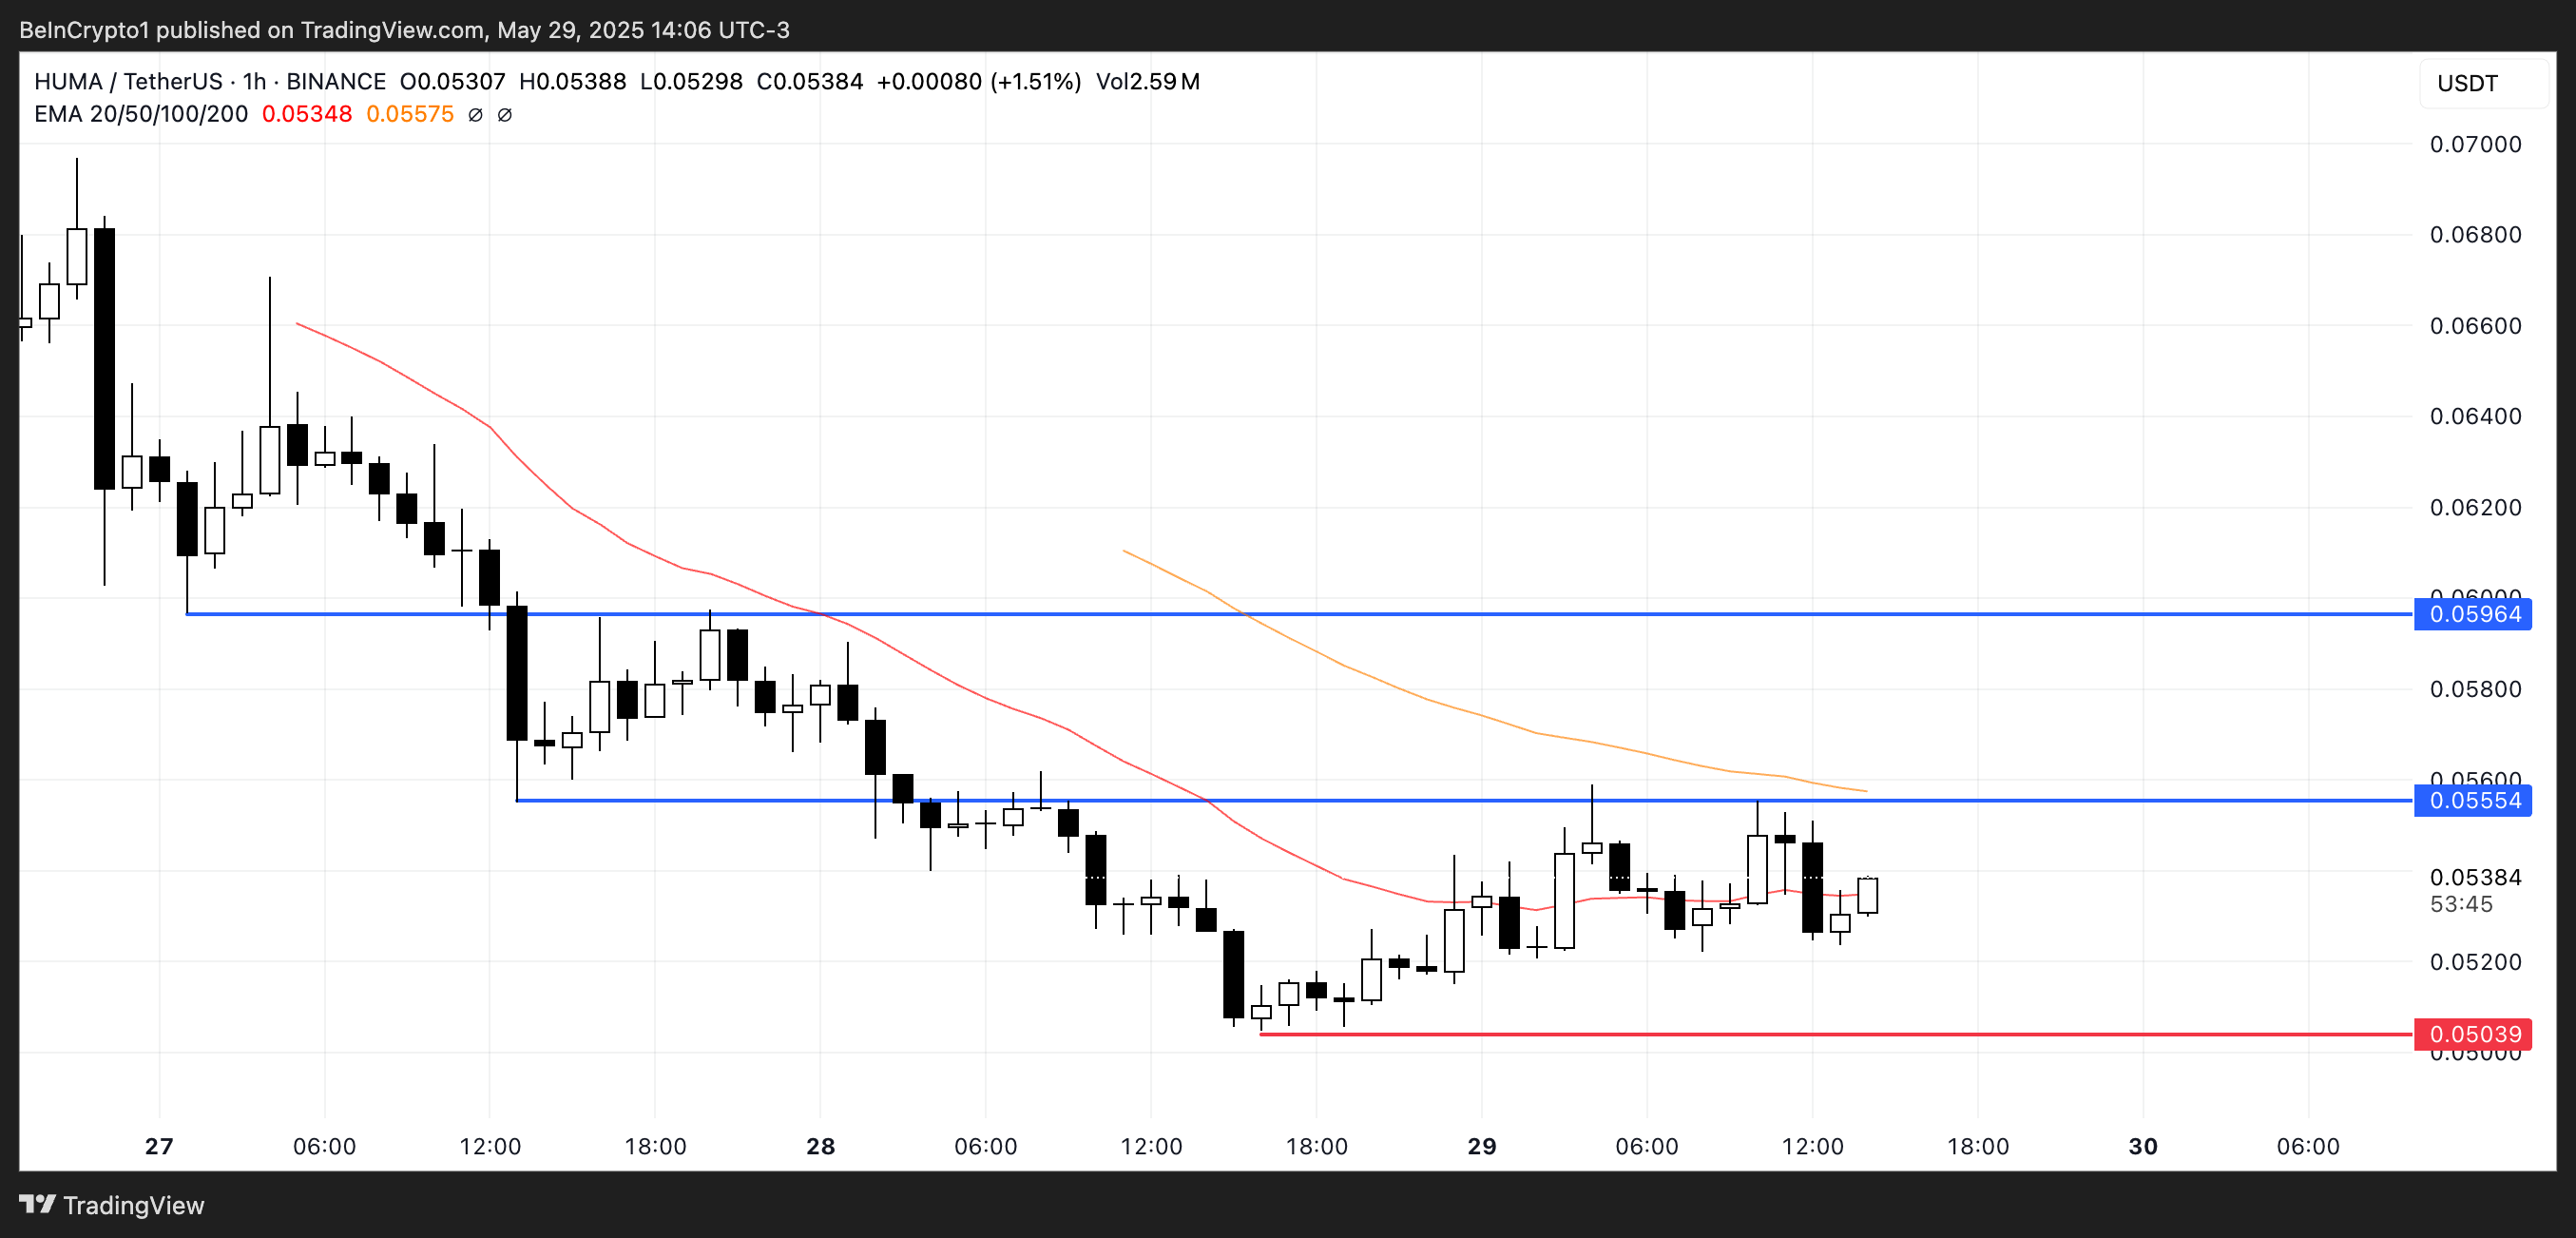
Huma Finance (HUMA)
Huma Finance recently unveiled its full tokenomics and Season 1 airdrop details, allocating 5% of the total 10 billion HUMA token supply to early users.
Backed by major investors like Circle and HashKey Capital, Huma is positioning itself as a first mover in the emerging PayFi sector. It aims to merge instant payments with DeFi and real-world assets.
Despite raising over $46 million and planning a second airdrop of 2.1% post-TGE, the project faced criticism for its relatively low initial airdrop allocation.
The team insists this is just the beginning, but market engagement has been modest, signaling shifting user preferences toward newer airdrop models.
Since the airdrop, HUMA has plunged more than 51% in just three days, reflecting a lack of buying support following the airdrop. If the current downtrend continues, the price could fall below $0.0503, testing new lows.
However, if sentiment shifts and the token finds support, it could rebound to challenge resistance at $0.055. A stronger rally could even push HUMA up toward $0.0596, though sustained momentum would be needed to reverse the early bearish pressure.
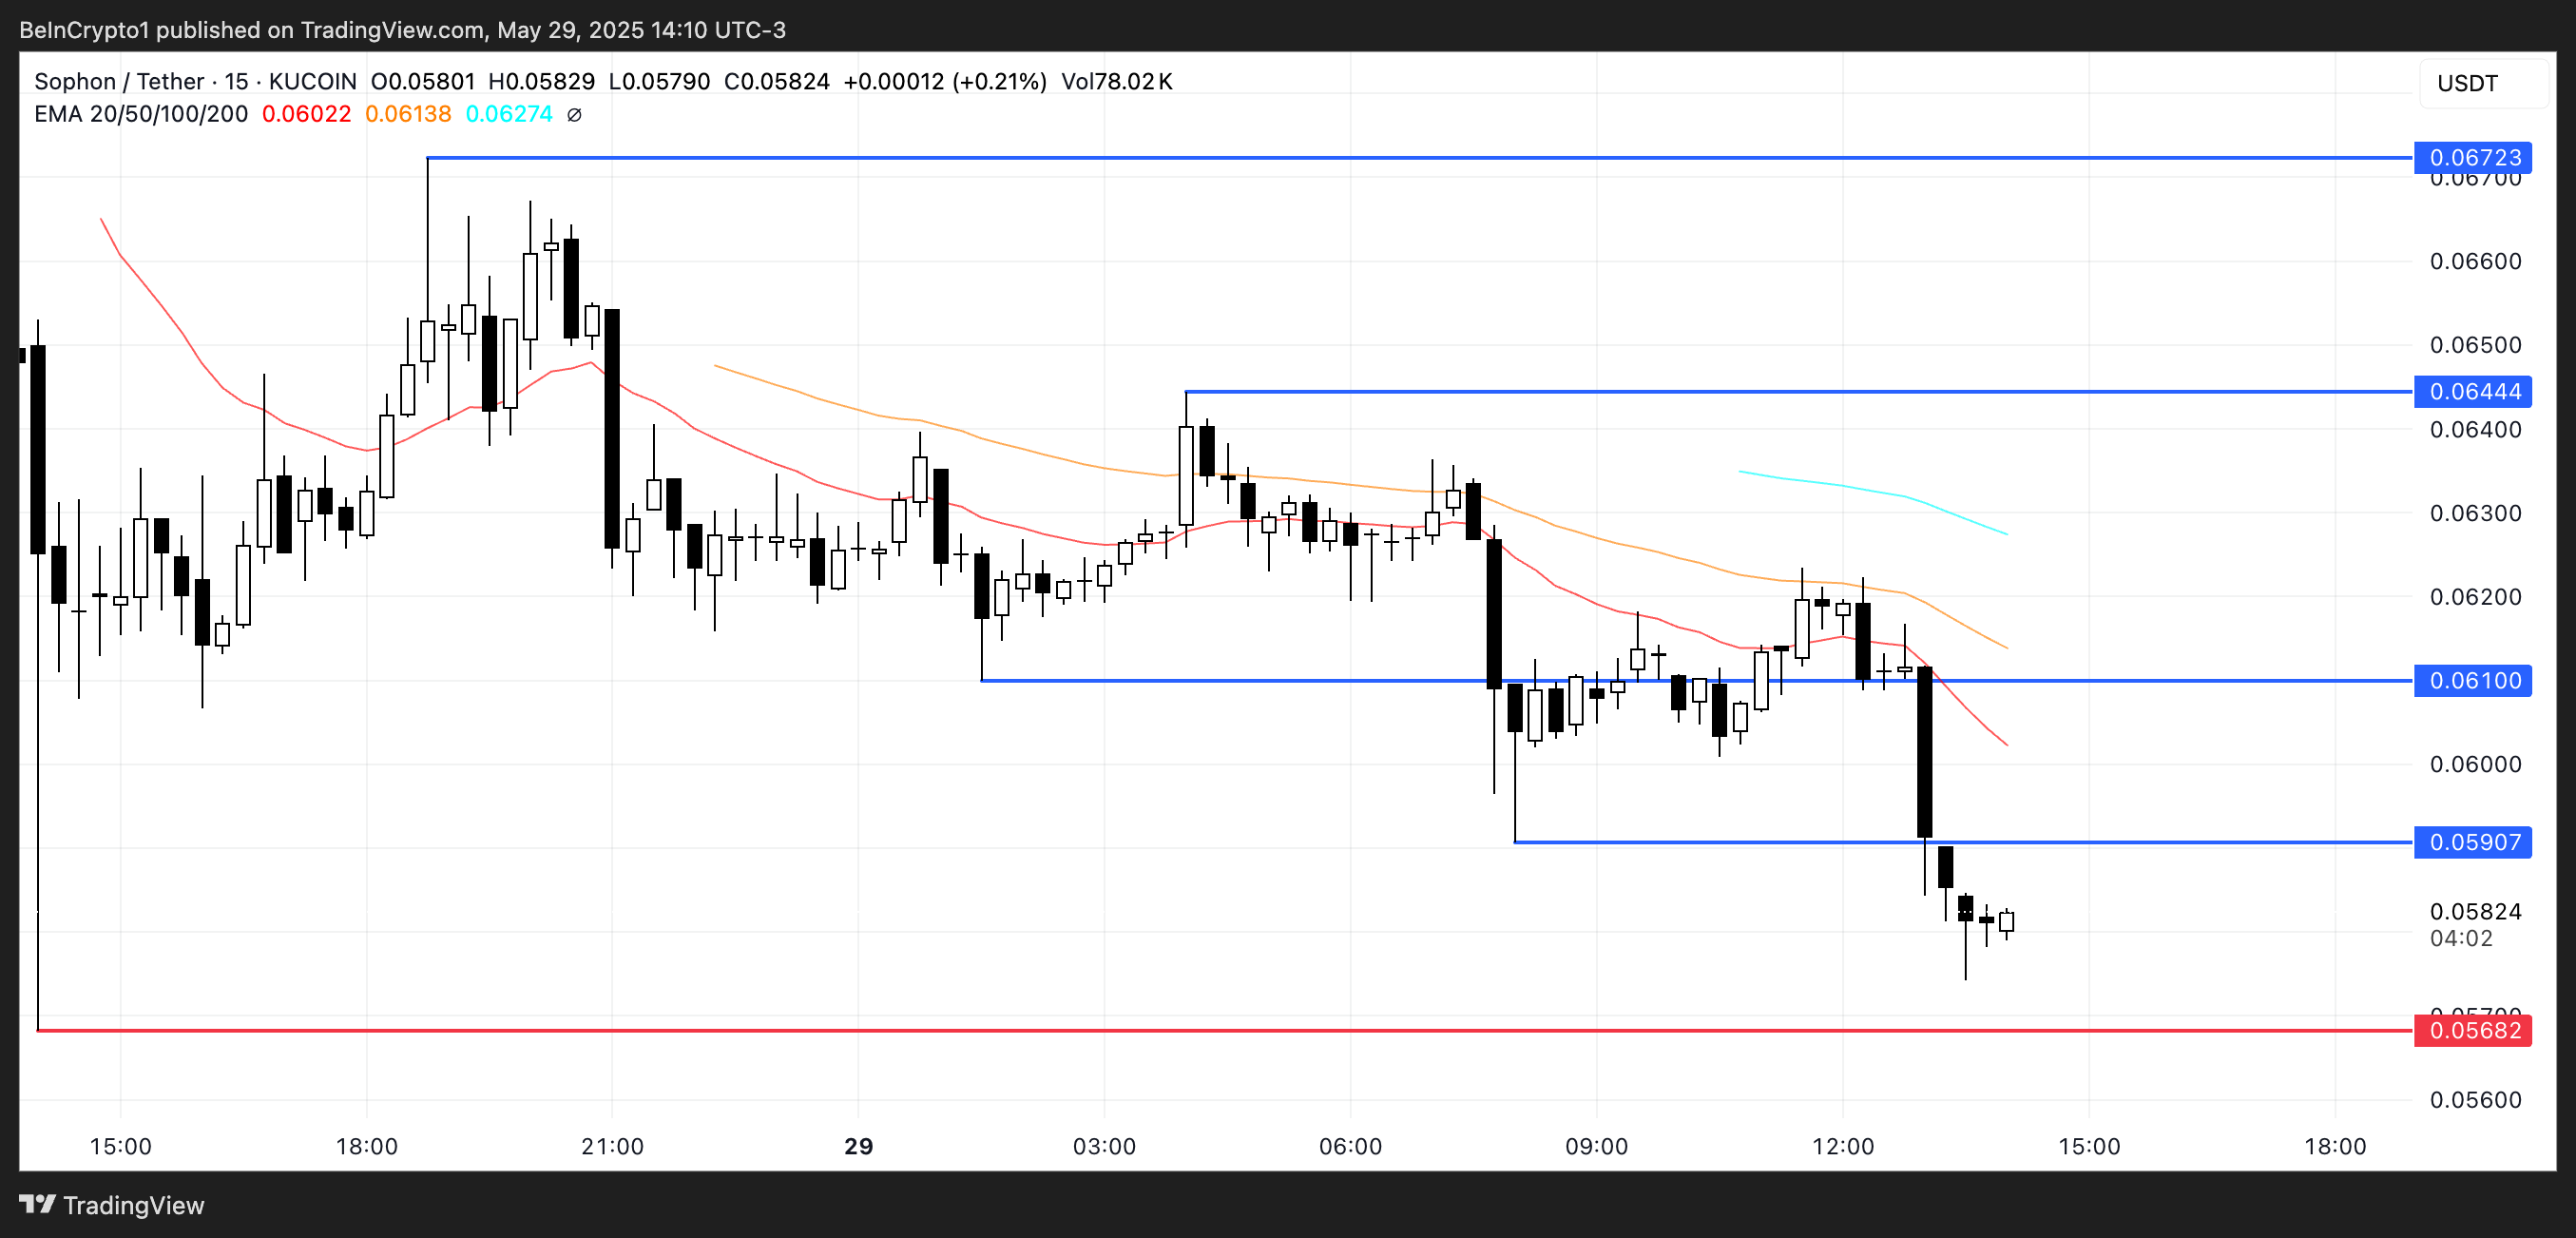
Sophon (SOPH)
Sophon’s SOPH token dropped over 33% within 24 hours of its debut and Binance listing, primarily due to the sudden release of 900 million airdropped tokens.
Despite strong backing—including over $70 million in funding and support from Binance Labs—the token’s limited immediate utility and the overwhelming supply shock triggered a sharp sell-off.
Adding to the volatility, Binance assigned SOPH a “seed tag” and enabled futures trading with up to 75x leverage, amplifying price swings.
SOPH is now hovering near a key support level at $0.056, which may be tested soon if pressure continues. Should the token regain bullish momentum, it could challenge resistance at $0.059.
A strong uptrend could push SOPH further to $0.061, $0.064, and possibly $0.067.
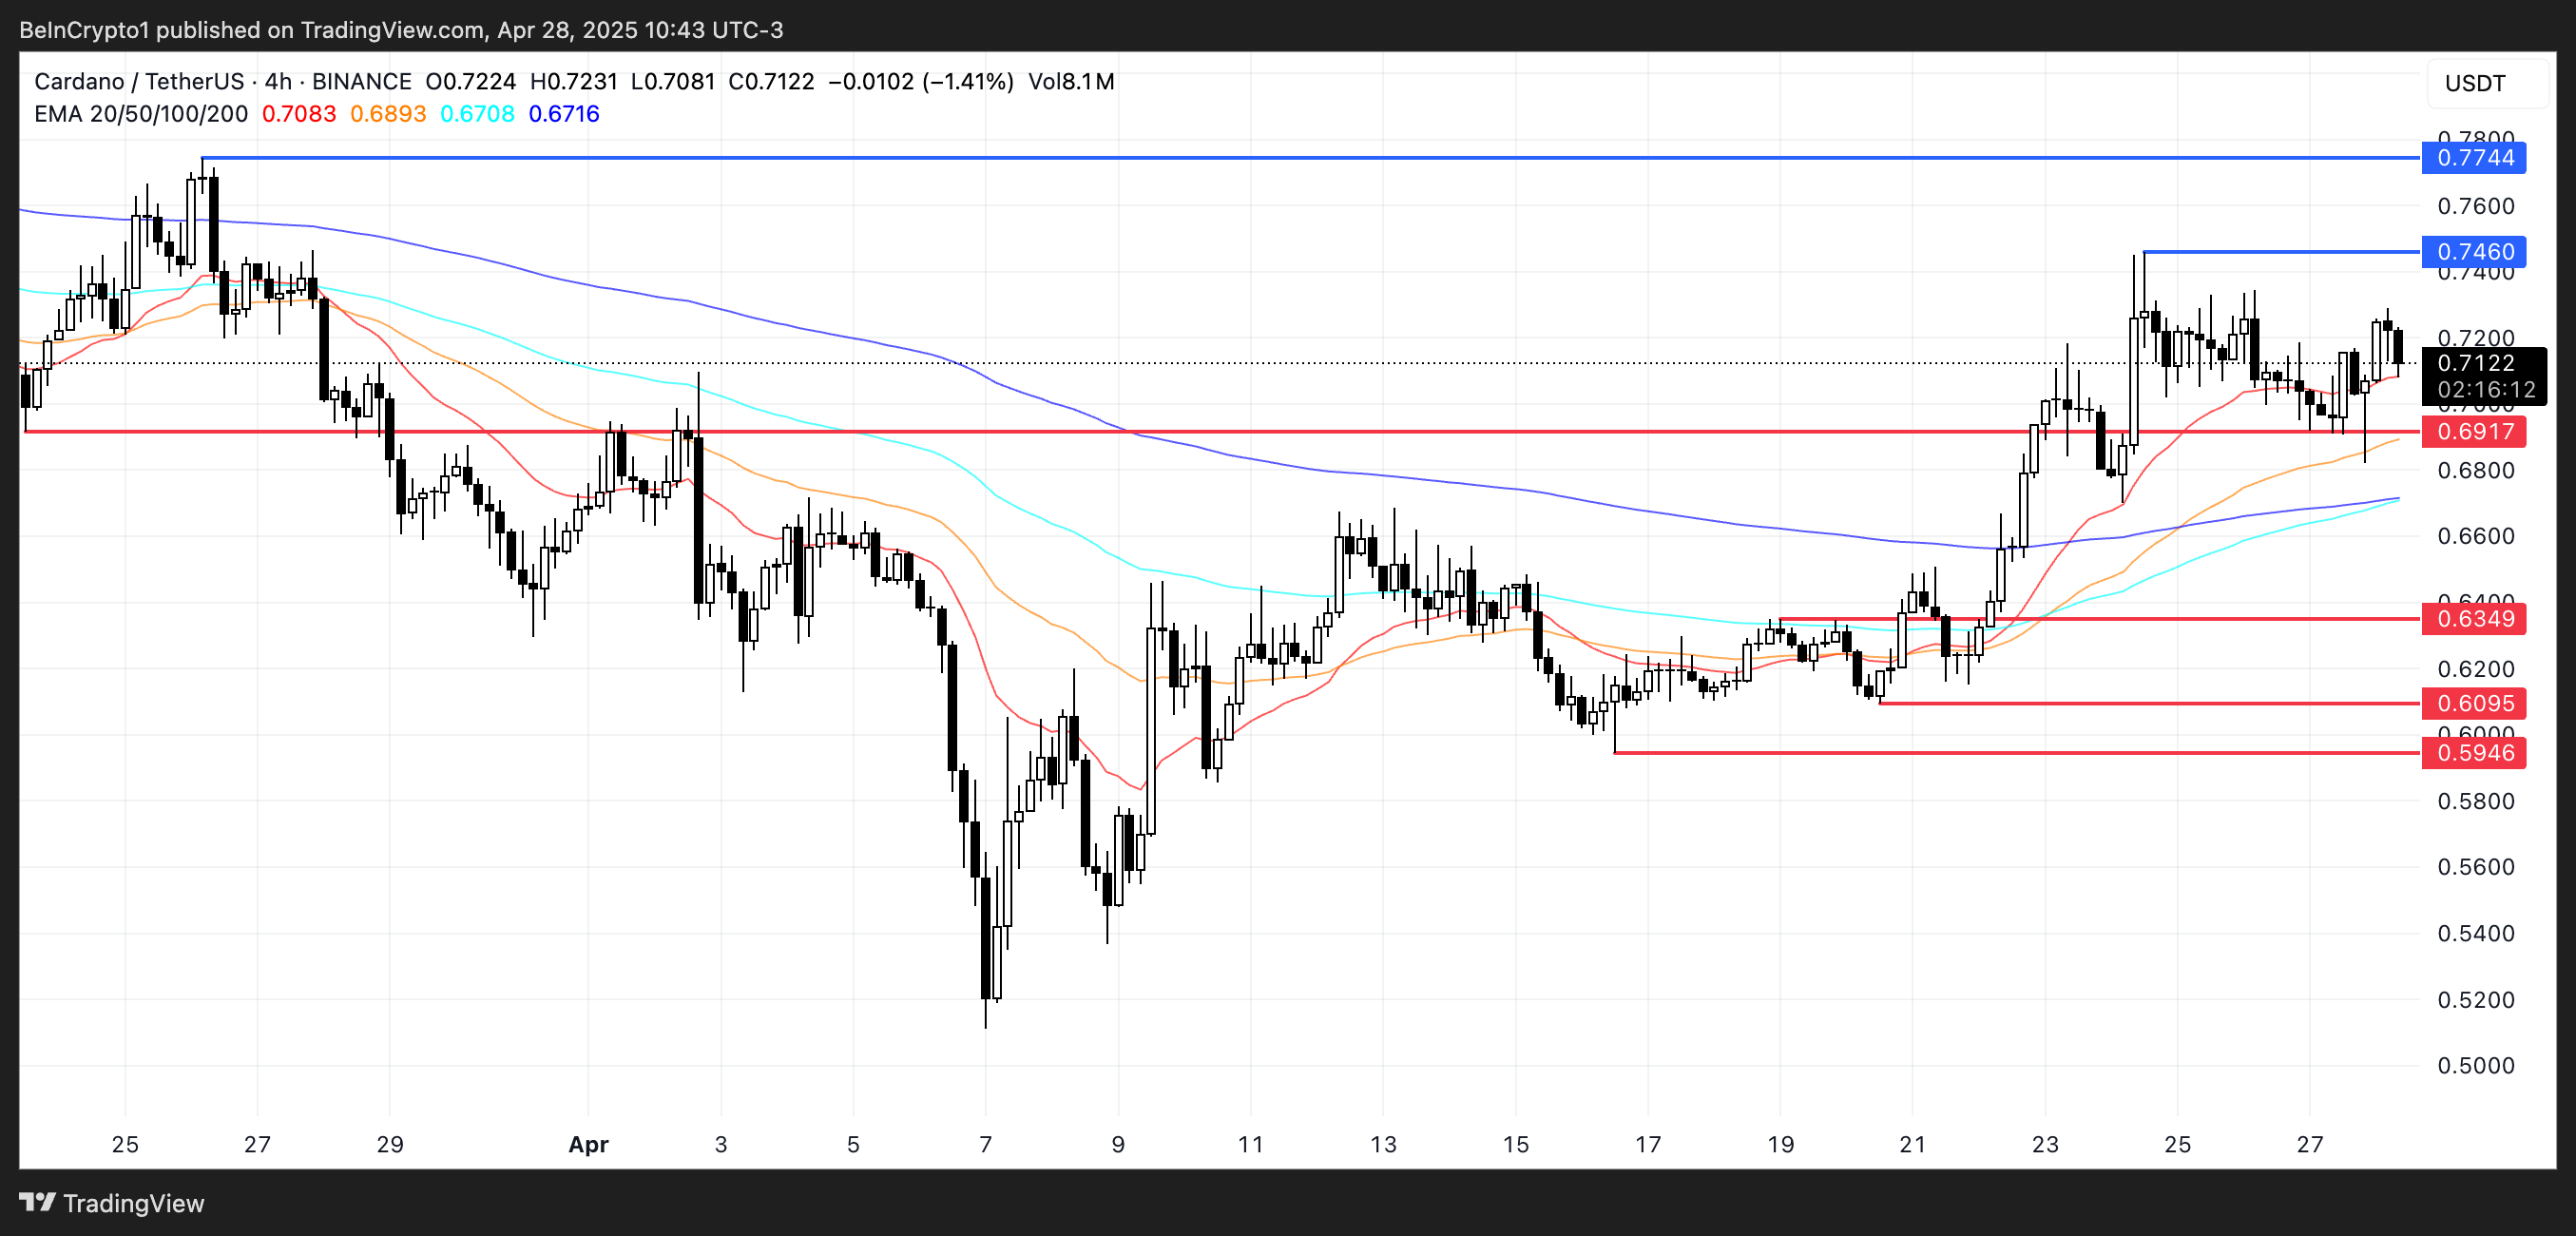
Cardano (ADA) is up more than 12% over the last seven days and is now trading above $0.70 for the first time since the end of March. Trading volume is also rising, up 33% in the past 24 hours to reach $723 million.
Despite the price recovery, some technical indicators suggest that ADA’s momentum is weakening and approaching key decision points. Here’s a closer look at Cardano’s current setup as the new week begins.
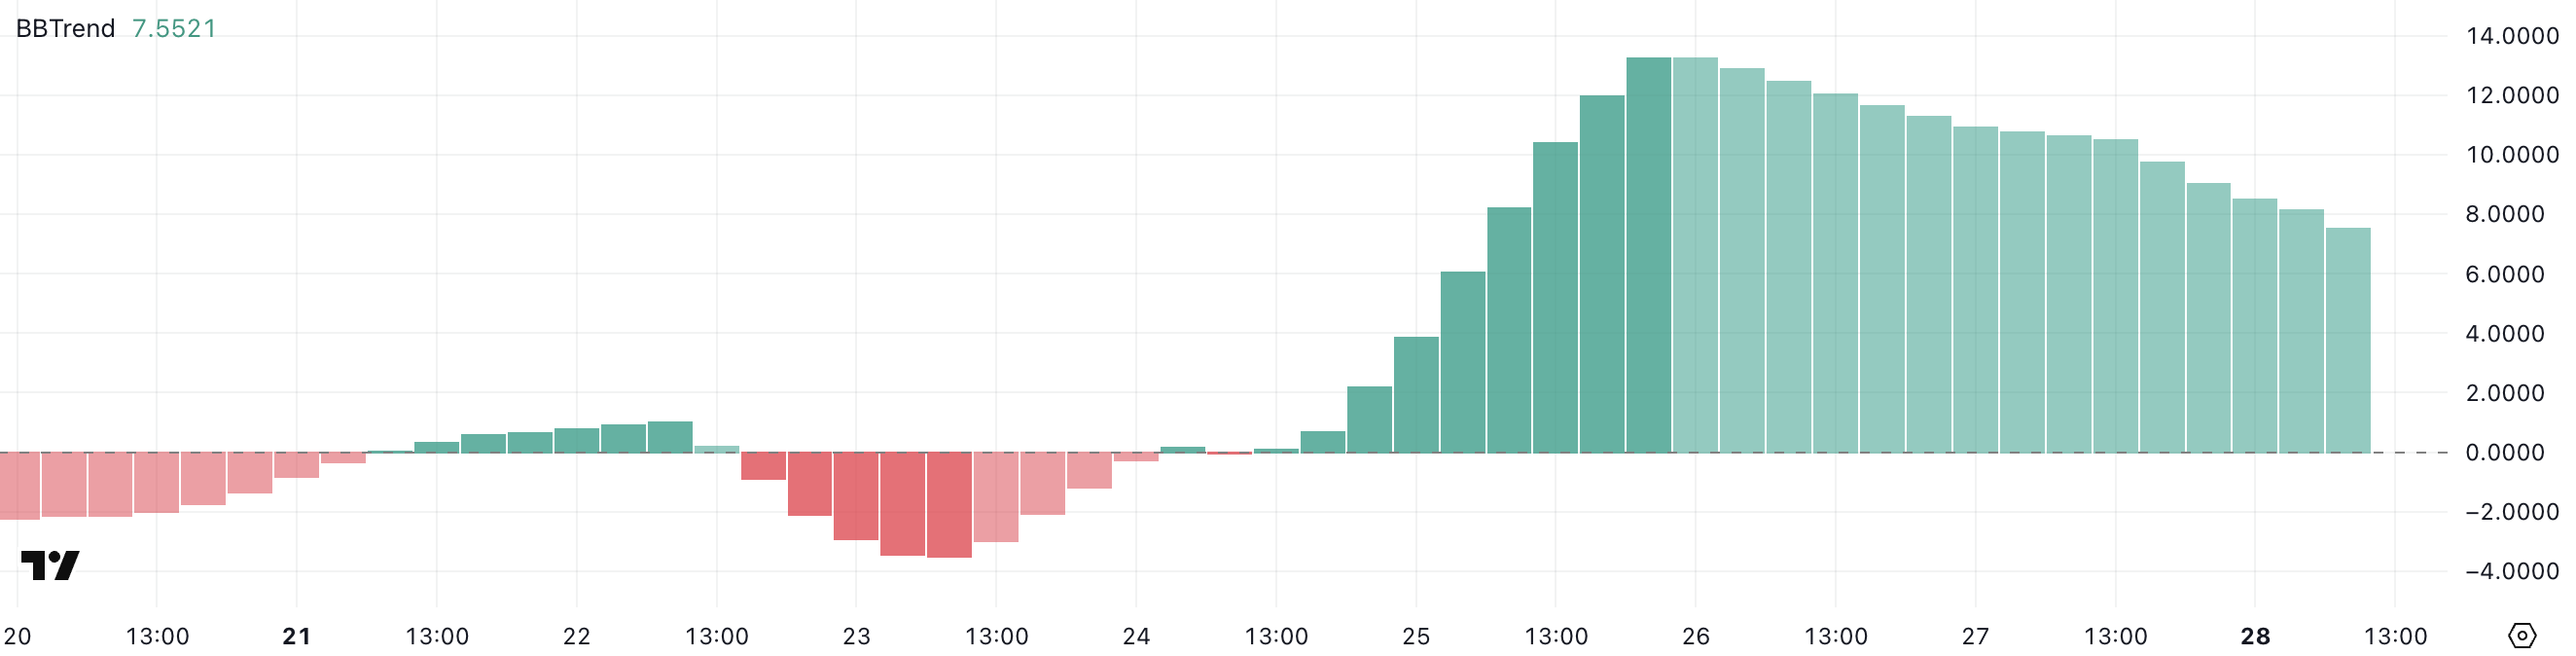
Cardano BBTrend Weakens After Positive Streak
Cardano BBTrend indicator is currently at 7.55, down from 13.27 just three days ago. This sharp decline shows that the strength of recent price expansion has cooled, even though the asset has posted positive daily closes over the last four days.
The falling BBTrend suggests that while ADA has been moving higher, the expansion’s underlying momentum is losing intensity.
The BBTrend, or Bollinger Band Trend indicator, measures the strength of a price trend based on the expansion or contraction of Bollinger Bands.
A rising BBTrend typically signals strong momentum and increasing volatility, while a falling BBTrend suggests weakening momentum or the start of a consolidation phase.
With ADA’s BBTrend now at 7.55, the indicator still points to some positive momentum, but at a much weaker pace than earlier in the week.
If the BBTrend continues to decline, ADA could enter a consolidation phase, but if buying pressure returns, the token could extend its current positive streak.
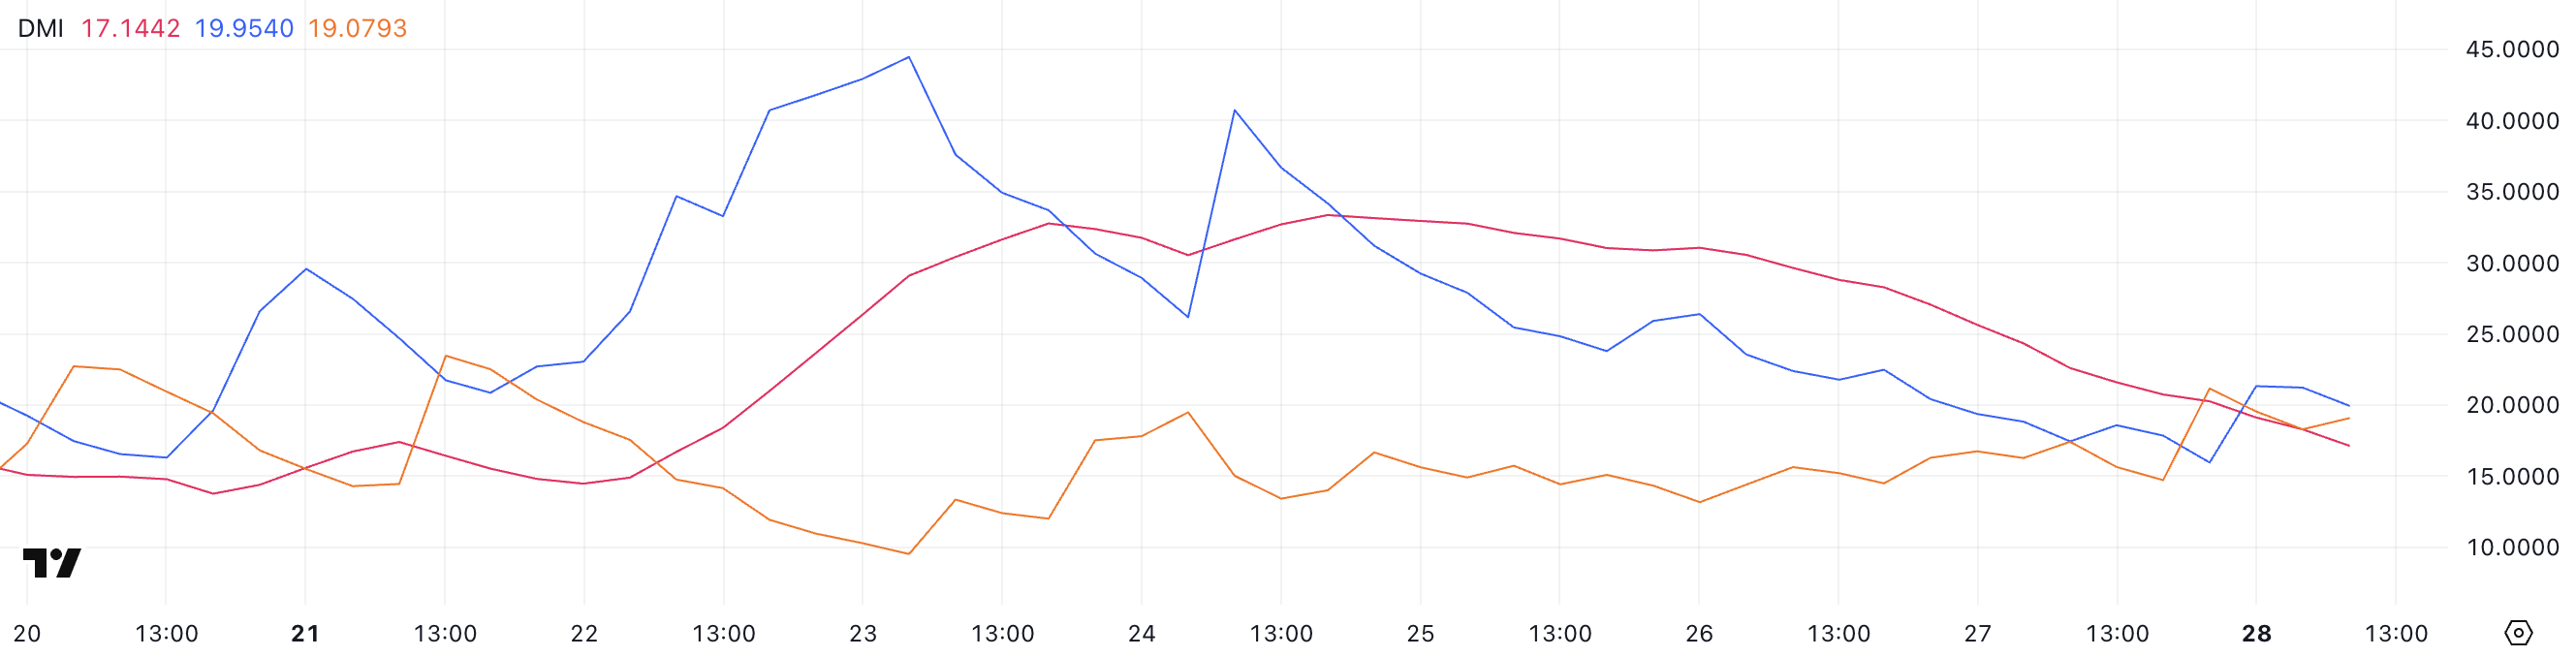
ADA Faces Indecision as Buyers and Sellers Battle for Control
Cardano Directional Movement Index (DMI) shows its Average Directional Index (ADX) currently sitting at 17.14, a notable drop from 31 two days ago.
This sharp decrease signals that the strength of ADA’s recent trend has weakened significantly. Meanwhile, the +DI (positive directional indicator) is at 19.95, up from 15.96 a few hours ago but still down from 26 two days ago.
The -DI (negative directional indicator) sits at 19.07, slightly down from 21.16 earlier but up compared to 14.49 two days ago, reflecting mixed momentum between buyers and sellers.
The ADX measures the strength of a trend without indicating its direction.
Readings above 25 typically suggest a strong trend, while readings below 20 point to a weak or consolidating market. With ADA’s ADX now at 17.14, trend strength is weak, and neither buyers nor sellers currently have a clear advantage.
Cardano’s Bullish Structure Faces Critical Test Near $0.69
Cardano’s Exponential Moving Average (EMA) lines suggest an uptrend, with the short-term EMAs positioned above the long-term ones.
However, Cardano price has repeatedly tested the support level at $0.69 and is trading very close to it.
This price action signals that while the broader trend remains positive, the bullish momentum has weakened, and the $0.69 support is becoming a critical zone.
If ADA loses the $0.69 support, the next downside targets would be around $0.63, followed by $0.609 and potentially $0.59 if selling pressure accelerates.
On the other hand, if buyers step back in and reinforce the uptrend, ADA could rally to retest resistance at $0.746.
A breakout above $0.746 could open the door for a move toward $0.77, offering a strong bullish setup if momentum strengthens again.